A Project for a New Echo-Mapping Campaign
at Intermediate Redshift
Abstract
AGN masses can be estimated by ”single epoch” spectral measurements through a mass-luminosity- linewidth relation calibrated by echo mapping measurements of a reference sample of low redshift () and low luminosity () AGNs. To analyze the possible dependence of this relation on luminosity we selected a sample of bright, intermediate redhift () objects and we started a spectrophotometric monitoring campaign with a typical sampling time of about one month. Variability observations of lines with shorter wavelength than Hβ will also provide new information on the structure of the broad line region. Cross-correlation analysis of continuum and line variations will require years of monitoring. We present a preliminary analysis of the data collected during the first year of observations and we discuss the adequacy of the spectrophotometric accuracy attained and future prospects of this project.
1Università di Roma La Sapienza, Dipartimento di Fisica, p.le Aldo Moro 2, I-00185 Roma, Italy
2INAF - Osservatorio Astronomico di Bologna, Italy
3Università di Roma Tor Vergata, Dipartimento di Fisica, via della Ricerca Scientifica 1, I-00133 Roma, Italy
Introduction
Broad emission lines in AGN spectra respond to variation of the central source continuum luminosity with a delay due to light-travel time effects. This allows to derive the geometry of the broad line region (BLR) through the ”echo mapping” process, based on cross-correlation analysis of continuum and line variations. Studies of Seyfert galaxies provided sizes of the BLR from light-days to light-weeks, an order of magnitude smaller than originally predicted by photoionization models, providing new insight into the physics of BLR gas (Peterson 1993; Netzer & Peterson 1997). Adding to the geometrical information an estimate of cloud velocity, derived from the width of emission line , it is possible to derive the mass of the central black hole as . The analysis of a sample of 34 AGNs with and , observed partly at the 2.3 m telescope of the Steward Observatory and partly at the 1 m telescope of the Wise Observatory, allowed the extension of the sample up to 100 times brighter objects and the definition of a size-luminosity relation of the type , resulting in a mass-luminosity relation: (Kaspi et al. 2000). The latter relation can be used to derive ”single epoch” mass estimates based on measurements of and , allowing, in principle, to study the evolution of AGN masses in cosmic time. However this requires an extrapolation of the above relation to high-redshift and high-luminosities objects. The reliability of the extrapolation depends on the possibility of a calibration with masses and luminosities directly derived from echo-mapping measurements of high- and high- objects, which are observed at shorter rest-frame waveleghts where different emission lines are seen (e.g C IV 1540 Å instead of Hydrogen Balmer lines).
For this purpose we have started a spectrophotometric monitoring campaign of a sample of bright, intermediate redshift objects, using the 1.5 m and the 1.8 m telescopes, respectively of the Loiano (Bologna) and Asiago (Padua) Observatories.
Sample and Observations
Selection from the Veron-Cetty & Veron (2003) catalog of all AGNs brighter than , and yields 12 objects with redshifts in the range 1.083 to 3.911. We started repeated observations of 5 of them, listed in Table 1 together with their positions, redshifts, apparent magnitudes. Both Loiano and Asiago telescopes are equipped with identical Faint Object Spectrograph & Camera, BFOSC and AFOSC respectively, designed to allow a quick switching between spectroscopic and imaging mode. BFOSC uses a back illuminated 1300x1340 CCD array EEV D129915 with 20x20 micron pixels corresponding to a scale of 0.58 arcsec pixel-1. We adopted a 5”-wide slit and a grism with a dispersion of 3.97 Å pixel-1 corresponding to a spectral resolution of Å and a spectral range 3800-8500 Å.
AFOSC uses a 1100x1100 CCD array TEK1024 Thinned with 22x22 micron pixels corresponding to 0.473 arcsec. We adopted a 8”.4-wide slit and a grism with a dispersion of 4.99 Å pixel-1, corresponding to a resolution Å and a spectral range 3500-8450 Å. For each QSO we selected a comparison star of comparable magnitude included in a field of about 15x15 arcmin (see Maoz et al. 1994), and spectroscopic observations were performed rotating the slit to include the comparison star. This allows the normalize the data at one reference epoch, as described below. Typical observations consist of two consecutive exposures of 1800 s. The QSO to reference star ratio, as a function of wavelength is computed for each frame. This quantity must be independent of extinction changes during the night. This allows a check of consistency between the frames and the rejection of the data if inconsistencies occur.
Direct B and R images in 15x15 arcmin field centered on the QSO are taken to check possible variability of the reference star and the consistency of spectrophotometry with broad band photometry.
TABLE 1
quasar
V
APM08279+5255
3.911
15.20
PG1247+268
2.042
15.60
PG1634+706
1.337
15.27
PG1718+481
1.083
14.60
HS2154+2228
1.290
15.30
Data Reduction
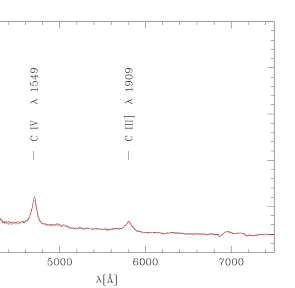
The spectra of each QSO and the relevant reference star were extracted with the standard IRAF procedures and calibrated in wavelength using exposures of He-Ar and Hg-Cd arc spectra, with BFOSC and AFOSC respectively, taken close to each spectroscopic exposure. Data of two consecutive exposure of the reference star and the QSO were added to reduce noise. Then a continuum of the star was derived at each epoch. Defining where and are star continua at a reference epoch and at the generic i-th epoch respectively, we reduce each QSO spectrum to the reference epoch by computing . An absolute flux calibration, which is not necessary for relative variability measurements, was also applied at the reference epoch, based on the observation of a standard star. Since all spectra are reduced to the reference epoch, the same conversion to physical units was applied to all of them. Thus the procedure does not add further uncertainties to relative spectrophotometry. However uncertainty of the absolute calibration itself is 10%, i.e. less accurate than relative photometry discussed below. As an example, the spectrum of PG 1247+268 at two epochs, normalized to the reference epoch, is shown in Figure 1.
Results and Discussion
Line and continuum spectra were measured at each epoch. For each line to be monitored we selected line-free regions on both sides of the line and defined continuum values in 100 Å bands. The line flux is defined as the integral of the flux above a straight line connecting the two continuum values. Lines and continuum regions depend on the QSO redshifts. Here we present preliminary result of the analysis of two objects PG 1247+268 and PG 1634+706. In the case of the first () we analyzed C IV 1549 and CIII] 1909 while in the case of the second () we analyzed CIII] 1909 and MgII 2798. The relevant bands for continuum measurements, selected on the basis of an inspection of the average spectra, are reported in Table 2. Figure 2 represents line and continuum light curves of PG 1247+268. The number of observations is still too small to derive any reliable conclusion about variability. However, we can evaluate the adequacy of observation and data reduction adopted for the program. The relative rms variations for the lines and relevant continua of both QSOs are reported in Table 2. These variations include the intrinsic QSO variability during one year, thus they represent an upper limit to the uncertainty of our photometry. Since typical continuum QSO variability is of the order of a few tenths of a magnitude in a timescale of yr in the rest-frame, we will be able to measure intrinsic variations after one more year of observation.
TABLE 2 CIV CIII] MgII cont line cont cont line cont cont line cont PG 1247+268 4500 4712 4850 5510 5807 6020 0.05 0.03 0.06 0.04 0.03 0.05 PG 1634+706 4232 4461 4623 6280 6538 6750 0.01 0.06 0.02 0.02 0.06 0.02

References
- Kaspi et al. (2000) Kaspi, S., et al. 2000, ApJ 533, 649
- Maoz et al. (1994) Maoz, D., et al. 1994, ApJ 421, 34
- Netzer (2003) Netzer, H. 2003, ApJ 583, L5
- Netzer & Peterson (1997) Netzer, H., & Peterson, B. 1997, Astronomical Time Series, Eds. D. Maoz et al., p.85
- Peterson (1993) Peterson, B. 1993, PASP 105, 247
- Veron-Cetty & Veron (2003) Veron-Cetty, P. & Veron, P. 2003, A catalogue of quasars and active nuclei (11th edition)