Redshift Dependence of QSO Spectral Variability
Abstract
We present a combined analysis of the optical spectral variability for two samples of QSOs, 42 objects at monitored at the Wise Observatory (Giveon et al. 1999), plus 59 objects up to in the field of the Magellanic Clouds, detected and/or monitored within the MACHO Project database (Geha et al. 2003). Our analysis shows some increase of the observed spectral variability as a function of redshift, with a large scatter. These data are compared with a model based on the addition of flares of different temperatures to a stationary quasar SED, taking into account also the intrinsic scatter of the SEDs.
Università di Roma Tor Vergata, Dipartimento di Fisica, via della Ricerca Scientifica 1, I-00133 Roma, Italy
Università di Roma La Sapienza, Dipartimento di Fisica, p.le Aldo Moro 2, I-00185 Roma, Italy
Introduction
Variability of the spectral energy distribution (SED) of Active Galactic Nuclei (AGNs) is a powerful tool to investigate the role of the main emission processes, and the origin of their variations. Many variability mechanisms have been proposed in the past, including supernovae explosions (Aretxaga et al. 1997), instabilities in the accretion disk (Kawaguchi et al. 1998), and gravitational lensing due to intervening matter (Hawkins 1983). Since it is likely that different physical phenomena are causing variability in different bands and timescales, multifrequency analyses will be ultimately needed to obtain a complete description. However, we have shown in a previous paper (Trevese & Vagnetti 2002) that even a two optical band analysis, once performed on a statistical sample, provides valuable constraints on the origin of variability. In the optical band, AGNs most commonly become bluer, i.e. their spectrum becomes harder, when brighter. This has been shown to occur for some individual AGNs (Cutri et al. 1985; Edelson et al. 1990; Kinney et al. 1991; Paltani & Courvoisier 1994), and for a few complete samples: PG quasars at monitored at the Wise Observatory (Giveon et al. 1999, hereafter referred as WO quasars), faint quasars in the SA 57 with two-epoch information (Trevese et al. 2001), and quasars from the MACHO Project database (Geha et al. 2003, hereafter referred as MP quasars), which are here studied together with the WO quasars (see also Vagnetti & Trevese 2003). Our analysis (Trevese & Vagnetti 2002) of the two-color WO light curves confirms the hardening in the bright phase of individual quasars. This in turn accounts for two other effects: (i) average variability of quasar samples is greater at higher rest-frame frequencies (Di Clemente et al. 1996), a results confirmed by recent results of Vanden Berk et al. (2004), de Vries et al. (2003), de Vries (2004), and (ii) – at a given observed frequency – variability is correspondingly greater at higher redshifts (Giallongo, Trevese & Vagnetti 1991). To quantify the amount of spectral variability, we (Trevese & Vagnetti 2002) introduced the spectral variability parameter ( being the specific flux and the spectral slope) and the use of the - plane to derive constraints on the variability mechanisms. In particular, it was shown that the variation of the spectral slope implied by changes of the accretion rate is not able to explain values deduced from the observations, while “hot spots” on the accretion disk, possibly caused by instability phenomena (Kawaguchi et al. 1998), can easily account for the observed spectral variability.
Samples
The present analysis is based on the sets of light curves for the Wise Observatory (WO) sample (Giveon et al. 1999) and for the MACHO Project (MP) sample (Geha et al. 2003), both available in electronic form. The WO sample consists of 42 PG quasars selected to be nearby, i.e. , and bright, i.e. mag, monitored in the Johnson-Cousins B and R bands with the 1 m Wise Observatory telescope for a total duration of 7 years and a median observing interval of 39 days. The MP sample includes 47 quasars discovered behind the Magellanic Clouds on the basis of their variability, and 12 additional quasars previously known in the same area. All the 59 MP quasars were monitored for 7.5 years with Mount Stromlo Observatory’s 1.27 m telescope, with average sampling times of 2-10 days. Magnitudes in the special MACHO red and blue passbands were then transformed and made available as standard V and R magnitudes. The MP quasars cover the redshift interval and have apparent mean magnitudes . The combined analysis of the two samples allows the investigation of the spectral variability as a function of .
Single Band Variability
Analysis of the dependence of variability on redshift and luminosity on single magnitude-limited samples is affected by the strong - correlation intrinsic to the samples themselves, therefore it is preferable to combine more samples to cover a larger portion of the - plane (see e.g. Giallongo, Trevese & Vagnetti 1991). Thus, we combine the MP sample, with data in V and R for 59 quasars, and the WO sample, which has variability information in B and R for 42 PG quasars at . Following Giallongo, Trevese & Vagnetti (1991), we measure variability in a fixed bin of the rest-frame Structure Function, 75-150 days. For the R band, which is common to the two samples, we find no correlation of variability with redshift for the MP sample alone, but we find an increase of variability with redshift for the combined samples, with correlation coefficient and probability , and a more significant result, , if we consider only objects of the two samples in a limited range of absolute magnitudes (). We find also that variability increases with , with for the combined samples, and with for the MP sample alone. These results confirm the previous trends found, e.g., by Giallongo, Trevese & Vagnetti (1991) and by Cristiani et al. (1996). Variability increases also as a function of rest-frame frequency (Di Clemente et al. 1996); results for the MP and WO samples have been shown by Vagnetti & Trevese (2003).
Spectral Variability
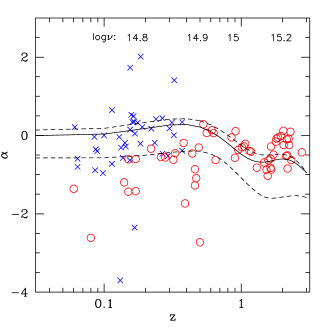
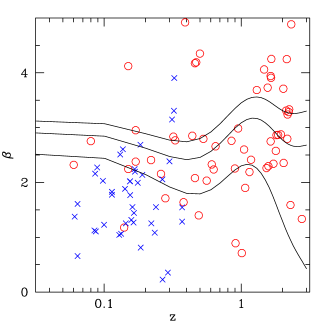
As the MP sample includes objects in a large range of redshift, up to , the spectral slope measured at a given observed frequency is in fact the slope of the SED at different emission frequencies, increasing with . Therefore we plot, in Figure 1 (left) vs for the two samples, compared with a prediction for an average SED, as determined by Elvis et al. (1994). To take into account the large scatter of the quasar SEDs, we also show the predictions for the 90% percentiles reported by Elvis et al. (1994). The comparison is consistent with the assumption of an average SED approximately independent of in shape, although some larger scatter in the spectral slopes appears in the low- data. To perform a similar comparison for the spectral variability parameter , as a function of , we require a model for the variability of the SED; we adopt, as in Trevese & Vagnetti (2002), the addition of a blackbody flare to the average SED by Elvis et al. (1994). In Figure 1 (right), showing vs for the two samples, some increase of with is apparent, but there is a large scatter. The model predictions, for flares of different temperatures added to the average quasar SED, account for at least part of the scatter.
Conclusions
The study of spectral variability of quasars is a powerful tool to test the validity of different emission and variability models against time-dependent data of statistical quasar samples. For such purpose, it is necessary to obtain variability information in at least 2 bands. The samples of quasars by Giveon et al. (1999), with light curves for 42 quasars in B and R, and that by Geha et al. (2003), with information in V and R for 59 quasars, are both appropriate for this purpose. Moreover, the latter sample allows to extend investigation of the spectral variability to high . Since the MP sample is selected on the basis of variability, our analysis could be biased by possible systematic differences in the variability properties of the two samples. However, since the variability threshold adopted for detection in the MP sample is low (0.05 mag), the incompleteness respect, e.g., to color-selected samples becomes negligible (see Trevese et al. 1989). Investigation of spectral variability as a function of redshift corresponds to the study of the perturbations of the SED at different rest-frame frequencies. Large samples with multi-band variability information are ultimately needed to characterize the dependence of the spectral variability parameter on both and . Progress in this direction will be achieved by a new analysis of the type presented by Vanden Berk et al. (2004), if repeated observations will provide a better time sampling.
References
- Aretxaga et al. (1997) Aretxaga, I., Cid Fernades, R., & Terlevich, R. 1997, MNRAS, 286, 271
- Cristiani et al. (1996) Cristiani, S. et al. 1996, A&A, 306, 395
- Cutri et al. (1985) Cutri, R. M., et al.1985, ApJ, 296, 423
- de Vries et al. (2003) de Vries, W. H., Becker, R. H., & White, R. L. 2003, AJ, 126, 1217
- de Vries (2004) de Vries, W. H. 2004, (theese proceedings)
- Di Clemente et al. (1996) Di Clemente, A., Natali, G., Giallongo, E., Trevese, D., & Vagnetti, F. 1996, ApJ, 463, 466
- Edelson et al. (1990) Edelson, R. A., Krolik, J. H., & Pike, G. F. 1990, ApJ, 359, 86
- Elvis et al. (1994) Elvis, M., et al. 1994, ApJS, 95, 1
- Geha et al. (2003) Geha, M. et al. 2003, ApJ 125,1
- Giallongo, Trevese & Vagnetti (1991) Giallongo, E., Trevese, D., & Vagnetti, F. 1991, ApJ, 377, 345
- Giveon et al. (1999) Giveon, U. et al. 1999, MNRAS, 306, 637
- Hawkins (1983) Hawkins, M. R. S. 1983, MNRAS, 202, 571
- Kawaguchi et al. (1998) Kawaguchi, T. et al.1998, ApJ, 504, 671
- Kinney et al. (1991) Kinney, A. L. et al. 1991, ApJS, 75, 645
- Paltani & Courvoisier (1994) Paltani, S., & Courvoisier, T. J.-L. 1994, A&A, 291, 74
- Trevese et al. (2001) Trevese, D., Kron, R. G., & Bunone A. 2001, ApJ, 551, 103
- Trevese & Vagnetti (2002) Trevese, D., & Vagnetti, F. 2002, ApJ, 564, 624
- Trevese et al. (1989) Trevese, D. et al. 1989, AJ 98, 108
- Vagnetti & Trevese (2003) Vagnetti, F., & Trevese, D. 2003, ’Synergies in Wide Field Observations’, JENAM 2003, Baltic Astronomy, in press
- Vanden Berk et al. (2004) Vanden Berk, D.E. et al. 2004, ApJ 601, 692