CCD Photometry of NGC 1817 and NGC 1807 ††thanks: Tables 4 and 5 are only available in electronic form from CDS via anonymous ftp to cdsarc.u-strasbg.fr (130.79.128.5) or via http://cdsweb.u-strasbg.fr/cgi-bin/qcat?J/A+A/ Fig 1 and Table 1 and 2 are only available in electronic form via http://www.edpsciencies.org
We have investigated the area of two NGC entries, NGC 1817 and NGC 1807, with deep CCD photometry in the intermediate-band system. The photometric analysis of a selected sample of stars of the open cluster NGC 1817 yields a reddening value of = 0.190.05, a distance modulus of = 10.90.6, a metallicity of [Fe/H] = 0.340.26 and an age of = 9.050.05. Our measurements allow us to confirm that NGC 1807 is not a physical cluster.
Key Words.:
Galaxy: open clusters and associations: individual: NGC 1817, NGC 1807 – Techniques: photometry – Methods: observations, data analysis1 Introduction
The open cluster NGC 1817 (C0509+166), in Taurus [=5, ], is an old and rich but poorly studied open cluster (Friel Friel (1995)). NGC 1817 seems to be as old as the Hyades, although comparison of the red giant clump with that of Hyades/Praesepe suggests that NGC 1817 has a lower heavy-element abundance. Its location at 1800 pc almost directly towards the Galactic anti-centre and 400 pc below the plane [, ], and its metallicity, lower than solar, make it an object of special interest for the research of the structure and chemical evolution of the Galaxy (Salaris et al. Sal (2004), Chen et al. Chen (2003) and references therein). Other clusters (NGC 2266, NGC 5822) also display a metallicity lower than the mean [Fe/H] at their radius, reaffirming the idea that there exists an intrinsic dispersion in [Fe/H] at any radial distance from the Galactic centre.
Cuffey (cuff (1938)) obtained extensive photographic photometry of stars in this area in the blue and red bands down to a limiting magnitude of =14. Then Purgathofer (pur (1961), Purga (1964)) performed a photometric study of the region, reaching =14. Harris & Harris (Har (1977), hereafter HH77) obtained photographic photometry of 265 stars in the central area of this cluster down to a limit =16.7. Grocholski & Sarajedini (Groch (2002)) used the K-band from 2MASS photometry as a distance indicator and unpublished to compare different theoretical isochrones (Grocholski & Sarajedini Gro03 (2003)).
Recently, Mermilliod et al. (Mermi (2003), hereafter Mer03) showed photometry and radial velocity results for 88 red giant stars in the area, finding 39 members of NGC 1817 out to a distance of 27. A radius of at least twice as large as previously tabulated is then expected for NGC 1817.
NGC 1807, C0507+164, also in Taurus [=5, ] shows up as a group of bright stars on a mildly populated background, located close to NGC 1817. The status of NGC 1807 is debatable but it still appears listed as open cluster (Rapaport et al. Rapa (2001)). Some authors do not consider it a physical open cluster (Becker & Fenkart beck (1971), Purgathofer pur (1961)), while others have proposed that it could constitute a multiple system with NGC 1817 (Barkhatova bark (1963)).
Balaguer-Núñez et al. (Bai (1998), hereafter Paper I) performed a deep study of the astrometry of the NGC 1817/NGC 1807 area using plates with a time baseline of 81 years. This first analysis of the astrometric data gave as a result an unusually large size of the open cluster NGC 1817 and a very poor NGC 1807. We decided to undertake a wide-field photometric study of the whole area, enhancing that way the astrometric-only membership analysis, and to derive the physical properties of the existing clusters. In parallel, a new membership segregation was planned based on there being only one very extended cluster in the area. A recalculation of absolute proper motions, with the Tycho-2 Catalogue as reference, has been performed and new membership probabilities, using parametric and non-parametric approaches have been derived (Balaguer-Núñez et al. Bal (2004), hereafter Paper II).
In this paper we discuss the results of the CCD photometric study of the area of NGC 1817 and NGC 1807, covering 65′40′ down to =22. Section 2 contains the details of the CCD observations and their transformation to the standard system. In Sect. 3 we discuss the colour-magnitude diagrams and the process of identifying the sample of candidate cluster members. Section 4 contains the derivation of the fundamental cluster parameters of reddening, distance, metallicity and age. In Sect. 5 we discuss the evidence that NGC 1807 is not a real physical open cluster, and, finally, Sect. 6 summarizes our conclusions.
2 The Data
2.1 Observations
The photometric data were obtained in several observational runs at Calar Alto Observatory (Almería, Spain) and at Observatorio del Roque de los Muchachos (ORM, La Palma, Canary Islands, Spain).
Deep Strömgren CCD photometry of the area was performed at Calar Alto in January 1999 and January 2000 using the 1.23 m telescope of Centro Astronómico Hispano-Alemán (CAHA) and in February 1999 and January 2000 using the 1.52 m telescope of Observatorio Astronómico Nacional (OAN). Further data were obtained at ORM in February 2000 using the 2.5 m Isaac Newton Telescope (INT) of ING (equipped with the Wide-Field Camera, WFC), and in December 1998 and February 2000 using the 1 m Jakobus Kapteyn Telescope (JKT) of ING, with the filter.
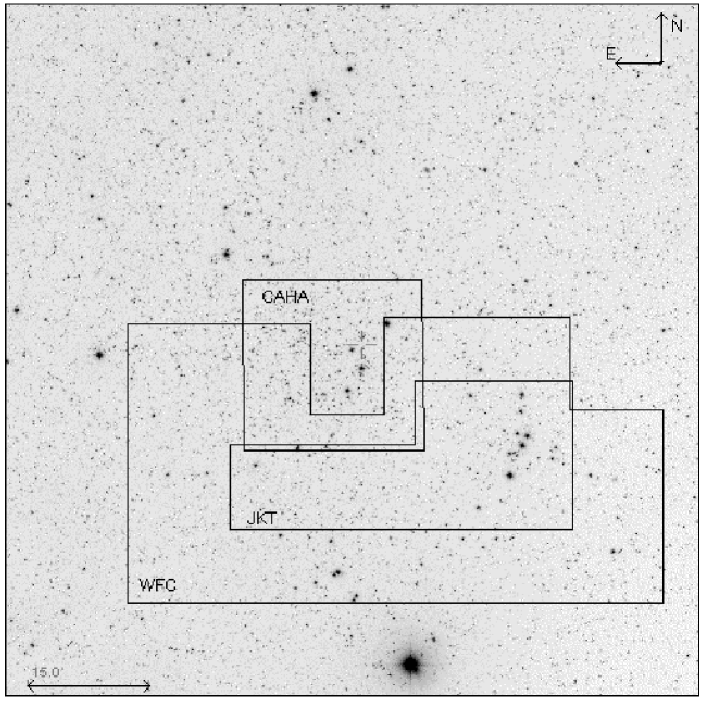
The poor quality of the images obtained on the 1998/99 runs and in the OAN 2000 observations, due to adverse meteorological conditions, prevented us from making use of the data collected during those nights. A log of the observations, the total number of frames, exposure times, seeing conditions and chip specifications, is given in Tables LABEL:log and LABEL:chips. The frames form a mosaic that covers the area shown in the finding chart of the cluster (Fig. 1).
We obtained photometry for a total of 7842 stars in an area of 65′40′ around NGC 1817 and NGC 1807, down to a limiting magnitude =22. Due to the lack of filter at the WFC-INT, it was only possible to measure it at the JKT and CAHA telescopes, thus limiting the spatial coverage of the mosaic with this filter.
Beside long, deep exposures, additional shorter exposures were obtained in order to avoid saturation of the brightest stars.
2.2 Data Reduction
2.2.1 CAHA and JKT Data
Our general procedure has been to routinely obtain twilight sky flats for all the filters and a sizeable sample of bias frames (around 10) before and/or after every run. Flat fields are typically fewer in number, from five to ten per filter. Two or three dark frames of 2000 s were also taken. IRAF111IRAF is distributed by the National Optical Astronomy Observatories, which are operated by the Association of Universities for Research in Astronomy, Inc., under cooperative agreement with the National Science Foundation. routines were used for the reduction process as described below. Dome flats were taken to check shutter effects on the images of the OAN and CAHA telescopes where significant effects were previously noted (Galadí-Enríquez et al. Gala94 (1994), Jordi et al. Jordi95 (1995)). In the current configuration of all the telescopes used this effect is negligible.
The bias level was evaluated individually for each frame by averaging the counts of the most stable pixels in the overscan areas. The 2-D structure of the bias current was evaluated from the average of a number of dark frames with zero exposure time. Dark current was found to be negligible in all the cases. Flatfielding was performed using sigma clipped, median stacked, dithered twilight flats.
Our fields are not crowded. Thus, synthetic aperture techniques provide the most efficient measurements of relative fluxes within the frames and from frame to frame. We use the appropiate IRAF packages, and DAOPHOT and DAOGROW algorithms (Stetson Stet87 (1987), Stet90 (1990)). We analyzed the magnitude growth curves and determined the aperture correction with the IRAF routine MKAPFILE.
From a large number of frames with different FWHM, we applied an iterative procedure to obtain the instrumental magnitudes. In the first step, a preliminary value of the FWHM was used to detect the stars recorded in each frame. DAOPHOT and MKAPFILE were then used to obtain the instrumental photometry and the individual FWHM of each frame. In the second step, the detection of the stars was improved by using the individual FWHM given by DAOGROW. Again, DAOPHOT and MKAPFILE were used to obtain more accurate instrumental photometry and new individual FWHM. The iteration finishes when no new stars are detected and when the individual FWHM are the same as in the previous step. Two iterations were enough in our case.
The same field was measured with both long and short exposure. Cross identification of stars among different frames was performed using the DAOMATCH and DAOMASTER programs (Stetson Stet93 (1993)). We retained only those stars detected in at least three filters, to enable the computation of two independent colours.
Equatorial coordinates were computed using the USNO2 Catalogue (Monet et al. USNO2 (1998)) as reference stars. The region under study contains 2877 stars from this catalog. Following Galadí-Enríquez et al. (gala1 (1998)) the best fitting of these reference stars was a second order pair of equations.
2.2.2 WFC-INT Data
After processing the WFC-INT frames as above, we found problems in the determination of the photometric zero point calibration for the 4 chips of the mosaic, basically due to gain differences between the A2D converters of the 4 CCDs. We decided to employ the pipeline specifically developed by the Cambridge Astronomical Survey Unit for WFC images from the INT, where the four chips are normalized to a common system in their level counts. The pipeline linearizes, bias subtracts, gain corrects and flatfields the images. Catalogues are generated using algorithms described in Irwin (Irw (1985)). The pipeline gives accurate positions in right ascension and declination linked to the USNO2 Catalogue (Monet et al. USNO2 (1998)), and instrumental magnitudes with their corresponding errors. A complete description can be found in Irwin & Lewis (Irwin (2001)) and in http://www.ast.cam.ac.uk/~wfcsur/index.php.
2.2.3 Transformation to standard system
Once the instrumental magnitudes and their errors were obtained, the next step was their transformation into the standard system.
The coefficients of the transformation equations were computed by a least squares method using the instrumental magnitudes of the standard stars and the standards magnitudes and colours in the system. Up to 68 standard stars from the cluster M 67 (Nissen et al. Nissen (1987)) were observed depending on the size of the field. Four to six short exposures in every filter were taken every night with a magnitude limit of =18. Those standard stars with residuals greater than 2 were rejected. Following Jordi et al. (Jordi95 (1995)), the reduction was performed for each night independently and in two steps.
The first step is to determine the extinction coefficients for each passband from the standard stars. To calculate these coefficients we make use of all the stars (300) in the field of M67, increasing the accuracy of our fit. The extinction coefficients for each night and filter are then calculated as the difference between the measurements as a function of the difference in airmasses. For instance, we have: where , are the different measurements of the same star at different airmasses ,. Analogous equations were used for the other passbands. Typical residuals are =0.008 for the CAHA and JKT and =0.001 for the WFC.
Because of the long exposure times, the suitable airmass value for each frame was obtained by integrating the instantaneous airmass throughout the exposure. Following Jordi et al. (Jordi95 (1995)) we approximated the integral by Simpson’s rule with three points.
With the extinction coefficients fixed, the transformation to the standard system was completed in the next step, in which we used only the stars with known standard photometric values present in the field. The equations were as follows:
- =
=
=
=
=
were are the transformation coefficients and the ′ indicates instrumental values.
In the CAHA images we decided to treat all the nights together —after correcting for atmospheric extinction— to fit those coefficients, and then to determine the zero point deviations from that fit for every night. For coherence, we refer those zero points to the precise results obtained with the WFC-INT, thanks to the generous overlap between the CAHA observations and the WFC-INT field.
The internal errors of the individual measurements were computed as described by Jordi et al. (Jordi95 (1995)), taking into account the errors in the instrumental magnitudes on the one hand, and the errors in the transformation equations on the other hand. Final magnitudes, colours and errors were obtained by averaging the individual measurements of each star using the internal error for weighting (Galadí-Enríquez et al. gala1 (1998), Rosselló et al. Ross85 (1985)). The final errors as a function of apparent visual magnitude are given in Table 3 and plotted in Fig. 2. The structure in the magnitude dependence is owed to the mosaic of images from different nights and different telescopes having different limiting magnitude.
| 8- 9 | 3 | 0.011 | 3 | 0.068 | 3 | 0.012 | 3 | 0.042 | 2 | 0.007 |
| 9-10 | 8 | 0.010 | 8 | 0.030 | 8 | 0.041 | 8 | 0.043 | 4 | 0.014 |
| 10-11 | 18 | 0.008 | 18 | 0.007 | 16 | 0.014 | 14 | 0.014 | 8 | 0.039 |
| 11-12 | 36 | 0.010 | 36 | 0.013 | 33 | 0.016 | 32 | 0.022 | 19 | 0.026 |
| 12-13 | 102 | 0.011 | 102 | 0.014 | 100 | 0.025 | 95 | 0.026 | 65 | 0.018 |
| 13-14 | 167 | 0.009 | 167 | 0.011 | 165 | 0.023 | 158 | 0.025 | 86 | 0.018 |
| 14-15 | 300 | 0.009 | 299 | 0.014 | 297 | 0.019 | 292 | 0.022 | 151 | 0.028 |
| 15-16 | 471 | 0.009 | 471 | 0.016 | 467 | 0.024 | 458 | 0.031 | 216 | 0.024 |
| 16-17 | 833 | 0.014 | 833 | 0.026 | 799 | 0.038 | 761 | 0.047 | 355 | 0.027 |
| 17-18 | 1110 | 0.021 | 1110 | 0.036 | 945 | 0.050 | 843 | 0.058 | 317 | 0.037 |
| 18-19 | 1140 | 0.019 | 1139 | 0.038 | 882 | 0.045 | 734 | 0.055 | 36 | 0.036 |
| 19-20 | 1204 | 0.012 | 1204 | 0.029 | 991 | 0.036 | 565 | 0.056 | ||
| 20-21 | 1119 | 0.017 | 1119 | 0.037 | 867 | 0.055 | 143 | 0.072 | ||
| 21-22 | 1007 | 0.045 | 1007 | 0.064 | 387 | 0.090 | 5 | 0.092 | ||
| 22-23 | 252 | 0.090 | 252 | 0.121 | 32 | 0.139 | ||||
| Total | 7770 | 7768 | 5992 | 4111 | 1259 |
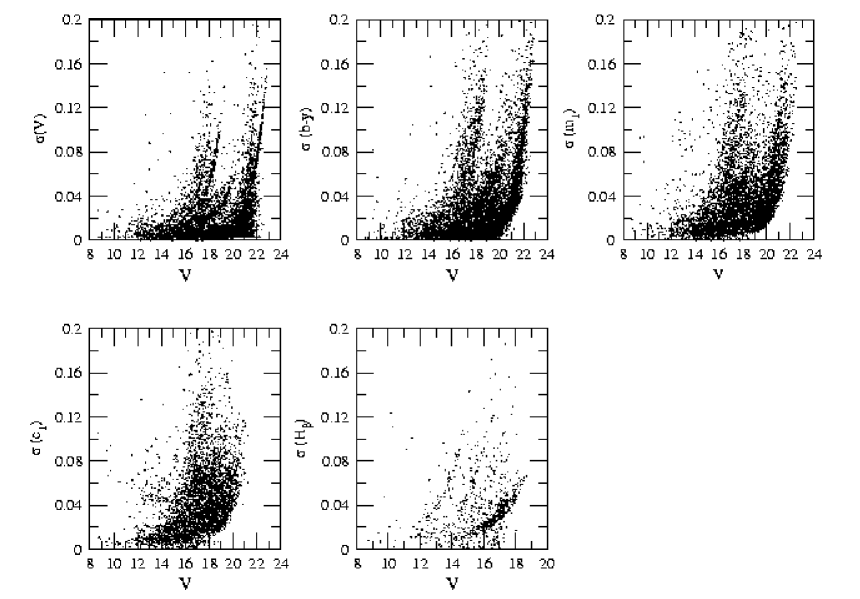
Table 4 lists the data for all 7842 stars in a region of 65′40′ around the open cluster NGC 1817 (Fig. 1). Star centres are given as frame () and equatorial (,) coordinates. Given the large area coverage and depth of our photometry, a new numbering system for stars in this field is introduced. An identification number was assigned to each star following the order of increasing right ascension. Column 1 is the ordinal star number; columns 2 and 3 are and ; columns 4 and 5 are the respective , coordinates in arcmin; columns 6 and 7 are the and its error, 8 and 9 the magnitude and its error, 10 and 11 the and its error, 12 and 13 the and its error, and 14 and 15 the and its error. In column 16, stars considered candidate members (Sect. 3.1.) are labelled ’M’, while those classified as non-members show the label ’NM’.
2.3 Comparison with Previous Photometry
Only four stars in the field of NGC 1817 have been previously studied using Strömgren photometry, in the range of =9.5 to 12.9. Maitzen et al. (Maitz (1981)) performed a photometric search for Ap stars among Blue Stragglers in open clusters, with mean errors of less than 0.01. Mean differences in the sense ours minus others are: 0.03(=0.04) in , 0.02 (=0.04) in , 0.03 (=0.07) in and 0.00 (=0.03) in for the 4 stars in common.
On the other hand, the magnitude derived from the filter can be compared with the published broadband data. The recent study of radial velocities of red giants in the area by Mer03 included photoelectric photometry of 25 stars. We have 22 common stars with the photoelectric photometry of HH77 and 19 common stars with Purgathofer (Purga (1964)), up to =16. The corresponding mean differences in , in the sense ours minus others are: 0.01(0.03),0.01(0.04) and 0.01(0.05), respectively. Transformation between and from several authors (see Moro & Munari, ADPS (2000)) fails to cover the whole range under study. Making use of merged broadband photometry, we can find a linear relation between the two indices: =(1.7190.035), =62. The standard deviation of the residuals about the mean relation is 0.055, where the typical uncertainty in is 0.02 and in is 0.014.
3 Colour-Magnitude Diagrams
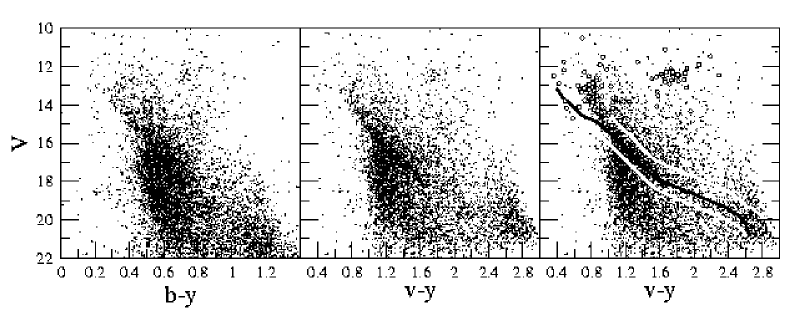
We use the colour-magnitude diagram for our study. As Meiborn (Mei00 (2000)) stated, the colour-magnitude diagram based on this colour index defines the main-sequence of a cluster significantly better than the traditional diagram (Fig. 3 left and centre). The fact that the reddening vector runs parallel to the cluster sequence in this diagram allows a much better separation of cluster and field stars.
The observational colour-magnitude diagram for all the stars in the studied area (Fig. 3) displays a fairly well defined main sequence. Specially outstanding against the field background is the red giant clump and the main sequence between 0.81.8.
3.1 Selection of candidate member stars
The first step in the study of an open cluster is the determination of its member stars. A selection of probable member stars up to the limiting magnitude of our sample can be obtained combining astrometric with photometric criteria. Unfortunately, proper motions (Paper II) and radial velocities (Mer03) are only available for the brightest stars in the area. Photometric measurements help to reduce the possible field contamination in the proper motion membership —among bright stars—, as well as to enlarge the selection of members towards faint magnitudes.
Among those astrometric member stars, we find 13 stars that are not compatible with the sequence of the cluster outlined in the colour-magnitude diagram. Radial velocity information is also taken into account, to reject stars with radial velocities incompatible with membership and to include stars considered members by Mer03 and compatible with membership according to our photometric data. Our astrometric study -based on proper motion from plates-, and thus its segregation of member stars, has a limiting magnitude of =14.5. From this point down to our photometric limit, we construct a ridge line following a fitting of the observational ZAMS (Crawford Craw75 (1975), Craw78 (1978), Craw79 (1979), Hilditch et al. Hil83 (1983), Olsen Ols84 (1984)) in the diagram. A selection of stars based on the distance to this ridge line is then obtained. The chosen margin for candidates includes all the stars between and from the ridge line, as shown in the right panel of Fig. 3. The margins were chosen to account for observational errors and the presence of multiple stars.
4 Physical parameters of the cluster
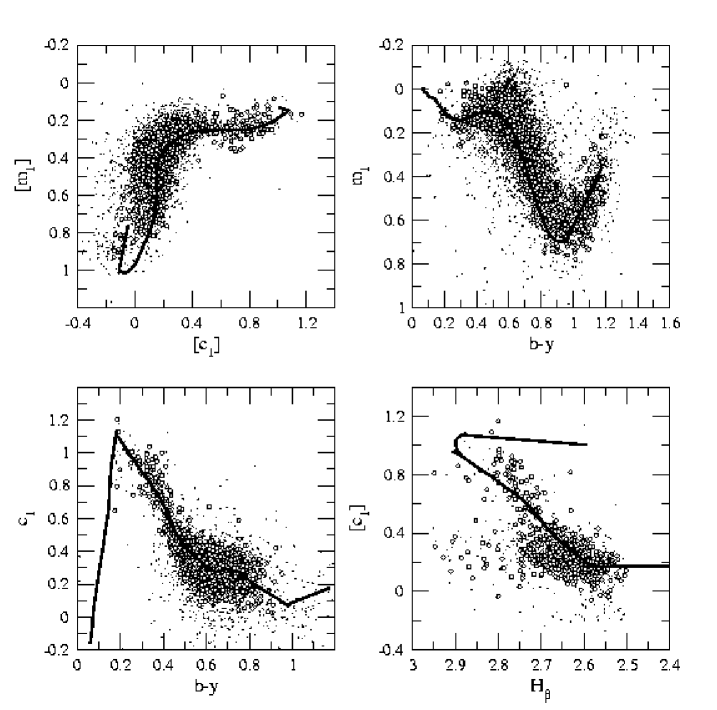
Narrow and intermediate passband photometry constitutes a useful technique for classification of the stars (Stromgren Strom (1966), Philip et al. Phil (1976)). The stars of the area selected as possible cluster members were classified into photometric regions and their physical parameters were determined. The algorithm uses photometry and standard relations among colour indices for each of the photometric regions of the HR diagram. Masana et al. (Mas (2004)) provide improvements to the algorithm classification and parametrization described in Jordi et al. (Jordi97 (1997)) and Figueras et al. (Fig (1991)). Improvements concern the inclusion of a grid of temperatures and gravities dependent on metallicity, the determination of masses and radii as well as the detection of peculiar stars.
Absolute magnitude, effective temperature and gravity as well as the corresponding reddening, distance modulus, metallicity and a raw spectral type and luminosity class are calculated for each star. Typical errors are 0.25 mag in , 0.15 dex in [Fe/H], 270 K in , 0.18 dex in and 0.015 mag in . Even if the result for the physical parameters for a given star would be inaccurate —mainly due to peculiarity, emission lines or binary character—, the high proportion of ”normal” stars makes it possible to ascertain the physical parameters of the cluster.
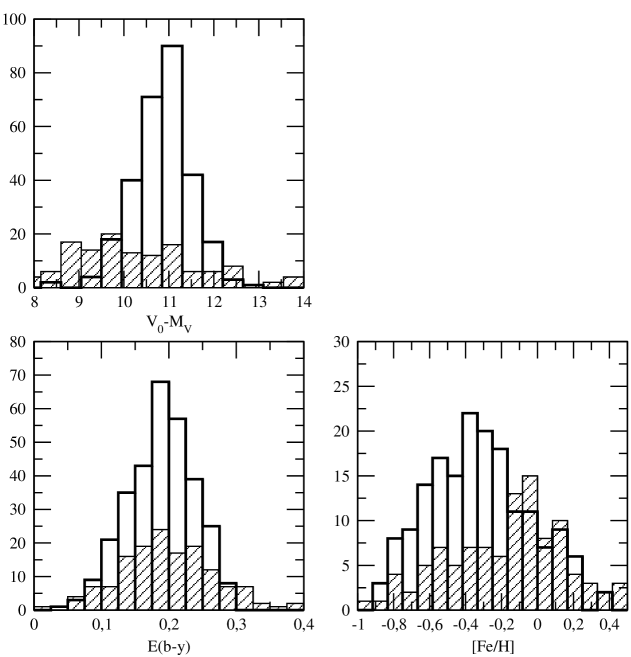
Only 525 stars among the 1592 candidate members have measurements. So the computation of physical parameters is only possible for that subset. Red giant stars are outside of the validity of the calibrations. Excluding peculiar stars and those with inconsistence among their photometric indices, we apply an average with a 2 clipping to that subset and only 264 stars remain (Fig. 5). We found a reddening value of = 0.190.05 (corresponding to = 0.27) and a distance modulus of = 10.90.6. Metallicity is better calculated studying only the 196 F and G stars in our sample, inside the validity range of the calibrations of Schuster & Nissen (Schu (1989), see Masana et al. Mas (2004) for more details). We found a value of [Fe/H] = 0.340.26. Figures 6 show these results.
Our results are consistent with previous results. HH77 give a reddening value of = 0.280.03 and a distance modulus of 11.30.3. Friel & Janes (Friel93 (1993)) give a value of [Fe/H] = 0.390.04 (=4) on the basis of moderate-resolution spectra, while Taylor (Tay (2001)) reexamines the errors in these data and concludes a lower value of [Fe/H] = 0.420.07. Friel et al. (Friel02 (2002)) give a recalibrated value of [Fe/H] = 0.290.05 based on 3 stars. Twarog et al. (Twa (1997)) find an = 0.26, an [Fe/H] = 0.270.02 and = 11.34 based on main-sequence fitting. Dutra & Bica (Dutr (2000)) using DIRBE/IRAS 100 dust emission integrated throughout the Galaxy derive a value of = 0.33.
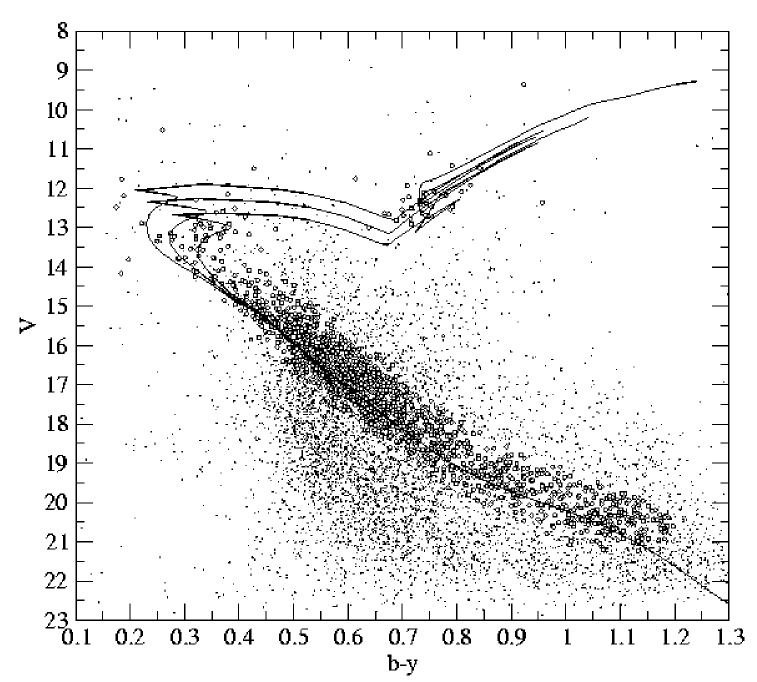
The recent publication by Clem et al. (Clem (2004)) of empirically constrained colour-temperature relations in the Strömgren system allows the transformation of isochrones from the theoretical to the observational colour-magnitude diagram. Several sets of isochrones have been used to analyze our results. The best fitting is found for the Schaerer et al. (Scha (1993)) isochrones. Figure 7 shows isochrones of Z=0.008 shifted by a reddening of 0.19 and an apparent distance modulus of 11.6. We found a best estimation of the age of = 9.050.05. HH77 give a Hyades-age for this cluster: 0.8 Gyr (= 8.9). But a recent determination of ages of old open clusters (Salaris et al. Sal (2004)) gives an age of 1.120.18 Gyr based on the morphological age index provided by Janes & Phelps (JP94 (1994)) but on a new highly homogeneous and reliable calibration in terms of absolute ages. Our age determination, 1.1 Gyr, agrees very well.
There are seven known blue stragglers in our photometry from the catalogue of blue stragglers in open clusters (Ahumada & Lapasset Ahu95 (1995)). But two of them (HH2090, HH1073) are not proper motion members. From a sample of 18 clusters, Wheeler (Wheel (1979)) found a ratio of the number of stragglers to giants of from 1/3 to 1/4. Having 39 confirmed red giants in the cluster (Mer03) we should expect between 10 and 13 blue stragglers. The location in our colour-magnitude diagram of six blue stars that are astrometric members according to Paper II lead us to classify them also as blue stragglers. Their photometry and astrometric segregation from Paper II are listed in Table LABEL:BlueS.
| Id. | HH | |||
|---|---|---|---|---|
| 7091 | 2045 | 0.3210.0059 | 12.3050.0176 | M |
| 157 | 2090 | 0.2090.0097 | 13.1120.0000 | NM |
| 389 | 2072 | 0.1880.0011 | 12.1950.0009 | M |
| 387 | 2110 | 0.1840.0051 | 11.7620.0056 | M |
| 7467 | 2020 | 0.2210.0126 | 12.8960.0074 | M |
| 7746 | 1073 | 0.4210.0147 | 12.2700.0123 | NM |
| 7310 | 3001 | 0.1970.0210 | 13.8160.0309 | M |
| 1126 | 0.1740.0027 | 12.4860.0029 | M | |
| 390 | 0.3790.0036 | 12.1570.0048 | M | |
| 388 | 0.3790.0101 | 11.9140.0035 | M | |
| 45 | 0.4270.0014 | 11.4980.0172 | M | |
| 6161 | 0.2590.0023 | 10.5140.0027 | M | |
| 7332 | 0.1830.1662 | 14.1690.0965 | M |
Open clusters with an age around 1 Gyr, with the turn off on the instability strip, seem to have the largest number of pulsators. There are seven known Scuti stars in the area (Frandsen & Arentoft Fran98 (1998)). Five of them have absolute proper motions and membership probabilities from Paper II. We have calculated the physical parameters for these stars and we are able to confirm the membership of four of them (Table LABEL:Scuti).
| Id. | ||||||||||
|---|---|---|---|---|---|---|---|---|---|---|
| 154 | 0.179 | 0.167 | 12.116 | 0.57 | 11.55 | 7105 | 3.22 | 2.328 | 4.613 | M |
| 155 | 0.160 | 0.160 | 12.257 | 3.95 | 11.44 | 7199 | 3.35 | 2.200 | 3.858 | M |
| 167 | 0.211 | 0.106 | 12.631 | 1.77 | 10.86 | 7794 | 3.92 | 2.035 | 2.545 | NM |
| 184 | 0.216 | 0.136 | 13.494 | 3.30 | 10.20 | 7731 | 4.44 | 1.588 | 1.369 | – |
| 211 | 0.227 | 0.260 | 14.256 | 3.95 | 10.31 | 6780 | 4.72 | 1.246 | 0.972 | – |
| 7298 | 0.168 | 0.154 | 13.405 | 2.77 | 10.63 | 7502 | 3.79 | 1.461 | 1.121 | M |
| 7615 | 0.158 | 0.200 | 11.946 | 1.37 | 10.58 | 6917 | 3.44 | 2.007 | 3.376 | M |
5 NGC 1807: not a real physical open cluster
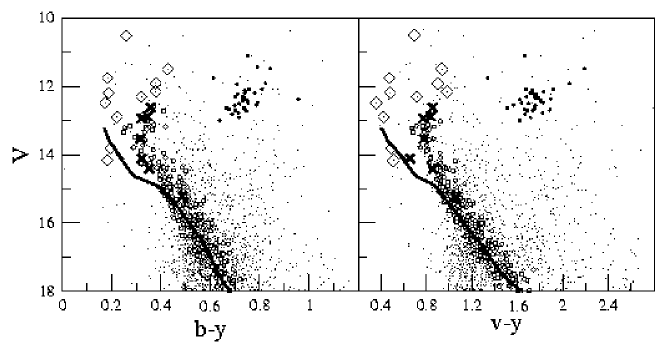
Comparison of the colour-magnitude diagram of the area around NGC 1807 and the centre of the open cluster NGC 1817, Fig. 8, already shows a lack of a reliable main sequence for NGC 1807.
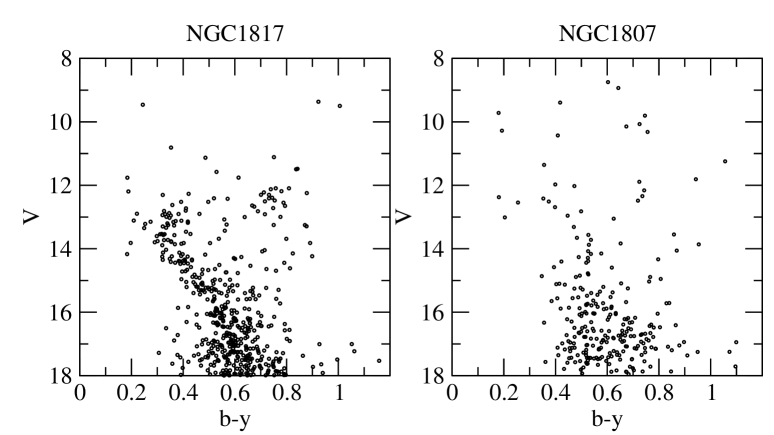
The star HD 33428, one of the brightest stars in the area of NGC 1807 (=8.5), has DDO observations (Yoss et al. Yoss (1981), Piatti et al. picla (1995)), but proper motion studies (Paper II and Hipparcos Catalogue, ESA esa (1997)) show that it cannot belong to NGC 1807. Even in the case of NGC 1807 being a real cluster, this star is a high proper motion star.
The comparison of the result of our study of the physical parameters of NGC 1817 with a study of 200 stars in the area of NGC 1807 (Fig. 6, shaded histogram), shows that the lack of a clear trend is unambiguous.
Paper II also supports the idea of a unique and very extended cluster in the area, showing no hint of two kinematically distinct clusters in the area.
The results from Mer03 of radial velocities of red giants in the area also agree with there being only one and very extended cluster. There are six stars from Mer03 list in the NGC 1807 area. Two of them (M1152, M1208) are members of NGC 1817 and the other four (M598, M682, M1153, M1161) have discordant radial velocities (+74.51, +111.53, +28.49, +11.71 km s-1).
We can conclude that there is no photometric or astrometric evidence supporting the existence of a real cluster NGC 1807.
6 Conclusions
In this paper we give a catalogue of accurate and J2000 coordinates for 7842 stars in an area of 65′40′ around NGC 1817.
We give a selection of probable members of NGC 1817, combining this photometric study with the previous astrometric analysis (Paper II). A better determination of the physical parameters of this extended cluster based on our accurate photometry gives: = 0.190.05, [Fe/H] = 0.340.26, a distance modulus of = 10.90.6 and an age of 9.050.05. The values are consistent with previous studies (see Hou et al. Hou (2002) and references therein).
We have not found any support for considering NGC 1807 a real physical cluster.
Acknowledgements.
We would like to thank Simon Hodgkin and Mike Irwin for their inestimable help in the reduction of the images taken at the WFC-INT. L.B-N, also wants to thank Gerry Gilmore for his continuous help and valuable comments, as well as all the people at the IoA (Cambridge) for a very pleasant stay. L.B-N. gratefully acknowledges financial support from EARA Marie Curie Training Site (EASTARGAL) during her stay at IoA. Based on observations made with the INT and JKT telescopes operated on the island of La Palma by the RGO in the Spanish Observatorio del Roque de Los Muchachos of the Instituto de Astrofísica de Canarias, and with the 1.52 m telescope of the Observatorio Astronómico Nacional (OAN) and the 1.23 m telescope at the German-Spanish Astronomical Center, Calar Alto, operated jointly by Max-Planck Institut für Astronomie and Instituto de Astrofísica de Andalucia (CSIC). This study was also partially supported by the contract No. AYA2003-07736 with MCYT. This research has made use of Aladin, developed by CDS, Strasbourg, France.References
- (1) Ahumada J., & Lapasset E., 1995, A&AS 109,375
- (2) Balaguer-Núñez L., Tian K.P., & Zhao J.L., 1998, A&AS 133, 387 (Paper I)
- (3) Balaguer-Núñez L., Jordi C., Galadí-Enríquez D., & Zhao J.L., 2004 A&A in press (Paper II)
- (4) Barkhatova K.A., 1963, Sbor. Rab. Astr. Ural. 1, 3
- (5) Becker W., & Fenkart R., 1971, A&AS 4, 241
- (6) Chen L., Hou J.L., & Wang J.J., 2003, AJ 125, 1397
- (7) Clem J.L., VandenBerg D.A., Grundahl F., & Bell R.A., 2004, AJ 127, 1227
- (8) Crawford D.L., 1975, AJ 80, 955
- (9) Crawford D.L., 1978, AJ 83, 48
- (10) Crawford D.L., 1979, AJ 84, 1858
- (11) Cuffey J., 1938, Ann. Harvard Obs. 106, 39
- (12) Dutra C.M., & Bica E., 2000, A&A 359, 347
- (13) ESA, 1997, The Hipparcos and Tycho Catalogues, SP-1200
- (14) Figueras F., Torra J., & Jordi,C., 1991, A&AS 87, 319
- (15) Frandsen S., & Arentoft T., 1998, A&A 333, 524
- (16) Friel E.D., 1995, ARA&A 33, 381
- (17) Friel E.D., & Janes K.A., 1993, A&A 267, 75
- (18) Friel E.D., Janes K.A., Tavarez, M., et al. 2002, AJ 124, 2693
- (19) Galadí-Enríquez D., Jordi C., & Trullols E., 1994, in New Developments in Array Technology and Applications, ed. A.G.D. Philip (Proc. IAU Symp. 167), p.327.
- (20) Galadí-Enríquez D., Jordi C., Trullols E., & Ribas I., 1998, A&A 333, 471
- (21) Grocholski A.J., & Sarajedini A., 2002, AJ 123, 1603
- (22) Grocholski A.J., & Sarajedini A., 2003, MNRAS 345, 1015
- (23) Harris G.L.H., & Harris W.E., 1977, AJ 82, 612 (HH77)
- (24) Hilditch R.W., Hill G. & Barnes J.V., 1983, MNRAS 204, 241
- (25) H\aog E., Fabricius C., Makarov V.V., et al. 2000, A& A 357, 367
- (26) Hou J.L., Chang R.X., & Chen L., 2002, ChJAA 2, 17
- (27) Irwin M.J., 1985, MNRAS 214, 575
- (28) Irwin M., & Lewis J., 2001, New Astron. Rev 45, 105
- (29) Janes K.A., & Phelps R.L., 1994, AJ 108, 1773
- (30) Jordi C., Galadí-Enríquez D., Trullols E., & Lahulla F., 1995, A&AS 114, 1
- (31) Jordi C., Masana E., Figueras F., & Torra J., 1997, A&AS 123, 83
- (32) Maitzen H.M., Seggewiss W., & Tüg H., 1981, A&A 96, 174
- (33) Masana E. et al. 2004, (in preparation)
- (34) Meiborn S., 2000, A&A 361, 929
- (35) Mermilliod J.-C., Lathan D.W., Gluskova E.V., et al. 2003, A&A 399, 105 (Mer03)
- (36) Monet, D., Bird A., Canzian, B., et al. 1998, The USNO-A2.0 Catalogue, (U.S. Naval Observatory, Washington DC).
- (37) Moro D., & Munari U., 2000, A&AS 147, 361
- (38) Nissen P.E., Twarog B.A., & Crawford D.L., 1987, AJ 93, 634
- (39) Olsen E.H., 1984, A&AS 57, 443
- (40) Philip A.G.D., Miller T.M., & Relyea L.J., 1976, Dudley Observatory Report No. 12
- (41) Piatti A.E., Clariá J.J., & Abadi M.G., 1995, AJ 110, 2813
- (42) Purgathofer A., 1961, Z.Astrophys. 52, 186
- (43) Purgathofer A., 1964, AnWie 26, 37
- (44) Rapaport M., Le Campion J.-F., Soubiran C., et al. 2001 A&A 376, 325
- (45) Rosselló G., Calafat R., Figueras F., et al. 1985 A&AS 59, 399
- (46) Salaris M., Weiss A., & Percival S.M., 2004, A&A 414, 163
- (47) Schaerer D., Meynet G., Maeder A., & Schaller G., 1993, A&A 98, 523
- (48) Schuster W.J., & Nissen P.E., 1989, A&A 221, 65
- (49) Stetson P.B., 1987, PASP 99, 191
- (50) Stetson P.B., 1990, PASP 102, 932
- (51) Stetson P.B., 1993, Proc. IAU Coll. 136. Cambridge University Press, Cambridge, p.291.
- (52) Strömgren B., 1966, ARA&A 4, 433
- (53) Taylor B.J, 2001, A&A 377, 473
- (54) Twarog B.A., Ashman K.M., & Anthony-Twarog B.J., 1997, AJ 114, 2556
- (55) Wheeler J.C., 1979, AJ 234, 569
- (56) Yoss K.M., Karman R.A., & Hartkopf W.I., 1981, AJ 86, 36
| Telescope | Date | Seeing() | n. of frames | Exp. | Times | () | ||
| 1.23 m CAHA | 1999/01/12-15 | (1) | 19 | 1900 | 800 | 400 | 400 | 2000 |
| 1.23 m CAHA | 2000/01/05-10 | 1.0-1.3 | 54 | 2200 | 1400 | 900 | 800 | 1400 |
| 1.52 m OAN | 1999/01/13-16 | (1) | 36 | 1900 | 800 | 400 | 400 | 2000 |
| 1.52 m OAN | 2000/02/07-14 | (1) | 23 | – | – | 900 | 800 | 1400 |
| 1 m JKT | 1998/12/11-14 | (1) | 81 | 2000 | 1200 | 800 | 700 | 1200 |
| 1 m JKT | 2000/02/02-06 | 0.9-1.3 | 37 | – | – | – | – | 2000 |
| 2.5 m WFC-INT | 2000/02/02-03 | 1.3 | 23 | 2000 | 2000 | 1200 | 500 | – |
(1) Poor weather conditions. Images not used in the final data.
| 1.23 m CAHA | 1.52 m OAN | 2.5 m WFC-INT | 1 m JKT | |
| Type: | SiTe2b | TK1024AB | 4 EEVi42-80 | SiTe2 |
| Dimensions: | 20482048 | 10241024 | 4 20484100 | 20482048 |
| Pixel size: | 24=0.4 | 24=0.4 | 13.5=0.33 | 24=0.33 |
| Field of view: | 10′10′ | 6′.96′.9 | ′34.2′ | 10′10′ |
| Gain: | 2.6e-/ADU | 6.55e-/ADU | 2.8 e-/ADU | 1.41e-/ADU |
| Read-out noise: | 6.0 e- | 6.4 e- | 7.7 e- | 7.5 e- |
| Dymamic range: | 65553 | 65536 | 65000 | 65000 |
| Typical bias level: | 154 | 470 | 1623 | 625 |
| Overscan region: | right | top | right-top-left | top-right |