New membership determination and proper motions of NGC 1817. Parametric and non-parametric approach. ††thanks: Table 5 is only available in electronic form from CDS via anonymous ftp to cdsarc.u-strasbg.fr (130.79.128.5) or via http://cdsweb.u-strasbg.fr/cgi-bin/qcat?J/A+A/ Fig 1 and Table 1, 2 and 4 are only available in electronic form via http://www.edpsciencies.org
We have calculated proper motions and re-evaluated the membership probabilities of 810 stars in the area of two NGC objects, NGC 1817 and NGC 1807. We have obtained absolute proper motions from 25 plates in the reference system of the Tycho-2 Catalogue. The plates have a maximum epoch difference of 81 years; and they were taken with the double astrograph at Zô-Sè station of Shanghai Observatory, which has an aperture of 40 cm and a plate scale of 30″ mm-1. The average proper motion precision is 1.55 mas yr-1. These proper motions are used to determine the membership probabilities of stars in the region, based on there being only one very extended physical cluster: NGC 1817. With that aim, we have applied and compared parametric and non-parametric approaches to cluster/field segregation. We have obtained a list of 169 probable member stars.
Key Words.:
Galaxy: open clusters and associations: individual: NGC 1817, NGC 1807 – Astrometry – Methods: data analysis1 Introduction
The open cluster NGC 1817 (C0509+166), in Taurus [=, ], is an old and rich but poorly studied open cluster (Friel Friel (1995)). NGC 1817 seems to be as old as the Hyades, with a lower heavy-element abundance. Its location at 1800 pc almost directly towards the Galactic anti-center and 400 pc below the plane [, ] and its metallicity, lower than solar, make it an object of special interest for the research of the structure and chemical evolution of the Galaxy.
NGC 1807 (C0507+164), also in Taurus [=, ] shows up as a group of bright stars on a mildly populated background, located close to NGC 1817.
A recent determination of mean proper motions of open clusters (Dias et al. Dias02 (2002)) based on the Tycho-2 Catalogue (H\aog et al. tyc2a (2000)) gives absolute values for NGC 1817. But the study is based on only 19 stars in an area of 15, with ten stars considered as cluster members. The only accurate study of astrometric data, based on automatic measurements of 12 plate pairs, (Balaguer-Núñez et al. Bai (1998), hereafter Paper I) gave relative proper motions of 722 stars in the area. These proper motions were analyzed to determine membership for two clusters in the area: NGC 1817 and NGC 1807.
Later on, Balaguer-Núñez et al. (PaperIII (2004), hereafter referred to as Paper III) undertook a wide field photometric study (1998-2000) of a 65′40′ area around NGC 1817 in the system down to a limiting magnitude . These photometric results confirm that NGC 1807 is not a real physical open cluster and that only one very extended open cluster, NGC 1817, covers the area.
Moreover, Mermilliod et al. (Mermi (2003), hereafter Mer03) have determined radial velocities of red giant stars in the area. Two stars in the region of NGC 1807 have the same radial velocities as the stars in NGC 1817.
The inappropriate assumption of there being two open clusters in the membership analysis of Paper I, could affect the conclusions, as will be shown later. So a new membership determination seems advisable and two completely different methods have been used for this purpose. This has never been done before on the same set of data, which makes our comparison specially interesting.
Since the publication of Paper I, the release of the Tycho-2 Catalogue allows an accurate transformation from and coordinates derived from plate measurements to the ICRS system, leading to proper motions computed directly in absolute sky coordinates, which would make the resulting catalogue much more useful for further studies. Finally, as is shown in this paper, a central overlap technique applied to the PDS scan data of all the available 25 plates makes it possible to enlarge the sample in Paper I by about one hundred stars.
In this paper we determine precise absolute proper motions of 810 stars within a 15 15 area in the NGC 1817 region, from automatic PDS measurements of 25 plates. The estimated membership probabilities lead us to a complete astrometric study of the cluster area. Section 2 describes the plate material as well as the proper motion reduction procedure and results, with comparisons with the Tycho-2 Catalogue. Section 3 accounts for the membership determination, using parametric and non-parametric approaches. Section 4 is devoted to the analysis of results. Finally, a summary is presented in Sect. 5.
2 Proper motion reduction
2.1 Plate material and measurements
Twenty-five plates of the NGC 1817 region are available. They were taken with the double astrograph at the Zô-Sè station of Shanghai Observatory. This telescope, built by Gaultier in Paris at the beginning of the last century, has an aperture of 40 cm, a focal length of 6.9 m and hence a plate scale of 30″ mm-1. The size of the plates is 24 cm by 30 cm, or 20 25. Although the plates cover quite a wide sky area, only a section of around the cluster center was measured for this study. The oldest plate was taken in 1916, and the most recent ones in 1997. The plate material and measurements are basically explained in Paper I. However, as we decided not to use the plate-pairs technique, we include detailed information on each individual plate in Table LABEL:plates. Moreover, the central overlap technique let us make use of all of the original 25 Shanghai plates, one more than in Paper I (plate CL82005).
2.2 Proper motions
The absolute proper motions in the region of NGC 1817 were obtained by following the central overlap procedure (Russel russel (1976); Wang et al. Wang95 (1995), Wang96 (1996), Wang00 (2000)). At the time of the previous reduction (Paper I) only 15 PPM (Röser & Bastian PPM (1991)) stars were available as standard stars. So the reduction of relative proper motions based on plate pairs was the appropiate choice.
The central overlap method simultaneously determines the plate-to-plate transformation parameters, the star motions and their errors. This method has rigorous mathematical foundations (Eichhorn Eich (1988)), but its computational requirements are so huge that, in practice, it cannot be implemented in its strict formulation. The usual approach to the method is generally known as iterative central-overlap algorithm, and implies the separation of the determination of plate and star parameters in consecutive steps that are iterated until convergence is achieved. This procedure is known to be equivalent, in practice, to the one-step block-adjustment approach, and has been extensively used during the last decades (Wu et al. Wu (2002), Galadí-Enríquez et al. 1998a among others). In applying the central overlap technique, the plate measurements are first reduced to a reference catalogue system, using the data for those stars with reference positions to determine the plate constants. As initial catalogue, 86 stars from the Tycho-2 Catalogue at epoch J2000 (H\aog et al. tyc2a (2000)) were selected. The plate constants are then applied to all the stellar measurements, giving equatorial coordinates for each star from each plate on which the star appears. The data for each star are then selected and solved by least squares for improved positions and proper motions. These revised star parameters form a new catalogue, which is on the system of the original reference catalogue, but has been strengthened and expanded to include additional stars. This new catalogue is used for a new determination of the plate constants, and the resulting positions solved for a further improvement of the stars’ positions and proper motions.
The iteration requires equatorial coordinates for each star on each plate as starting values. After positions for each star on each plate are computed, proper motions are determined from a linear regression of position versus time. If the error of one proper motion component exceeded 3, the most deviant measurement was discarded and the proper motion recomputed, until the error fell bellow the mentioned limit. In the next iteration, all stars with precise proper motions are used as reference stars for a new transformation from plate to spherical coordinates. In the first iteration, only linear terms were used; in the second iteration, higher order terms were included. Only significant transformation terms were kept. To select the best plate constant model, we used Eichhorn & Williams’ criterion (Eichhorn & Williams Eicwill (1963), Wang et al. Wang82 (1982)) and obtained a model with six linear constants on coordinates, a magnitude and a coma term, and a magnitude distortion term. We require that any star remaining in the final catalogue has at least one measurement from the modern epoch plates.
The whole process is iterated until convergence is achieved. The criteria for convergence were: mean differences in position smaller than 1.1 mas, r.m.s. smaller than 3.6 mas and differences in proper motion below 0.1 mas yr-1. The final outcome results in 810 stars.
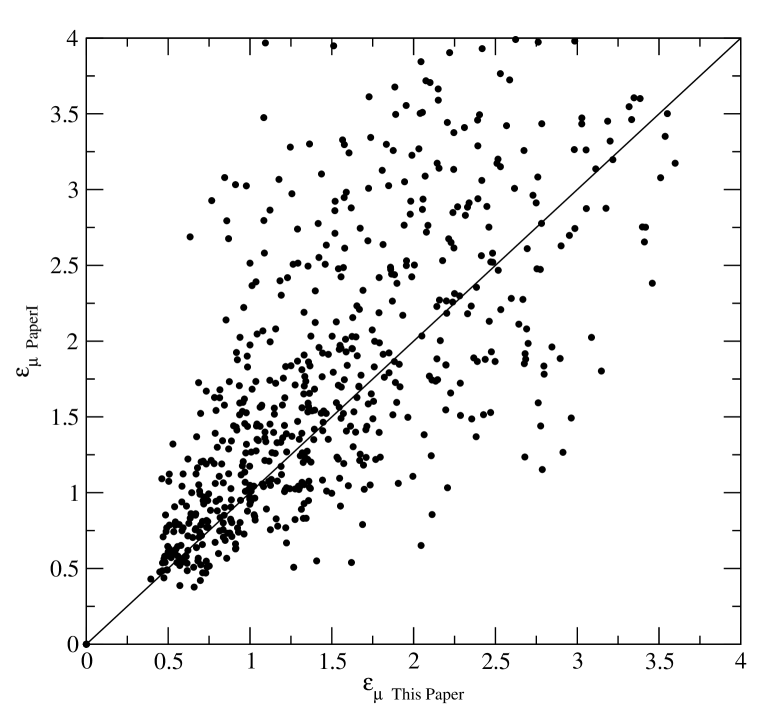
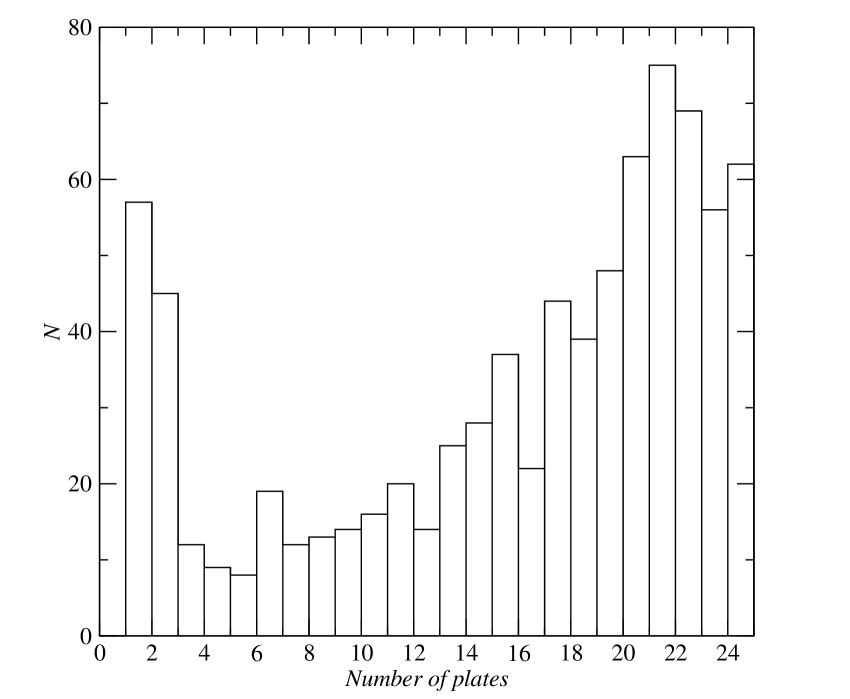
Table 2 shows the mean precisions of final proper motions for stars in the NGC 1817 region detected on more than 3 plates. 21 stars with errors greater than 3 mas yr-1 were not included. Errors for stars on only two plates were not computed. The units of the proper motions and their precisions throughout are mas yr-1. The precision of the final proper motions strongly depends on the number of plates. Figure 1 gives the number of stars for which various numbers of plates are available. More than of proper motions were obtained from at least 5 plates.
Thanks to the addition of one more plate and the use of the overlap technique we determined proper motions for 88 stars more than in Paper I. Most of these recovered stars were measured in 2-3 plates. In addition, the mean number of plates per star also increased by a factor 1.8 (up to eight more plates). The errors are a factor of 0.77 better than in Paper I. Figure 2 shows the errors in the proper motions compared to those in Paper I.
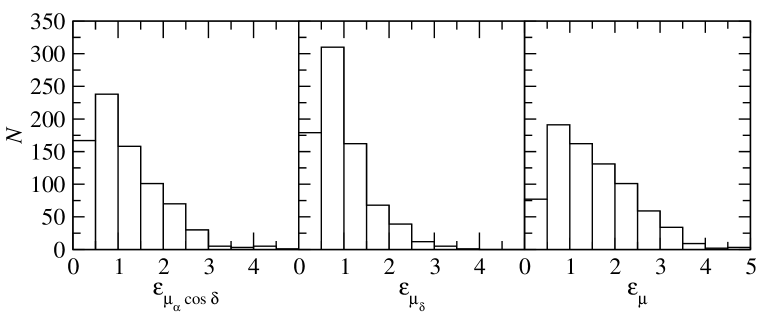
The mean errors in the proper motions for more than of the stars are = 1.16 mas yr-1, = 0.96 mas yr-1 and = 1.55 mas yr-1, where . In the most precise case, the errors are 0.97 mas yr-1 for stars with more than 21 plates ( of stars). Figure 3 shows the distribution of proper motion errors with the number of stars: vs , and .
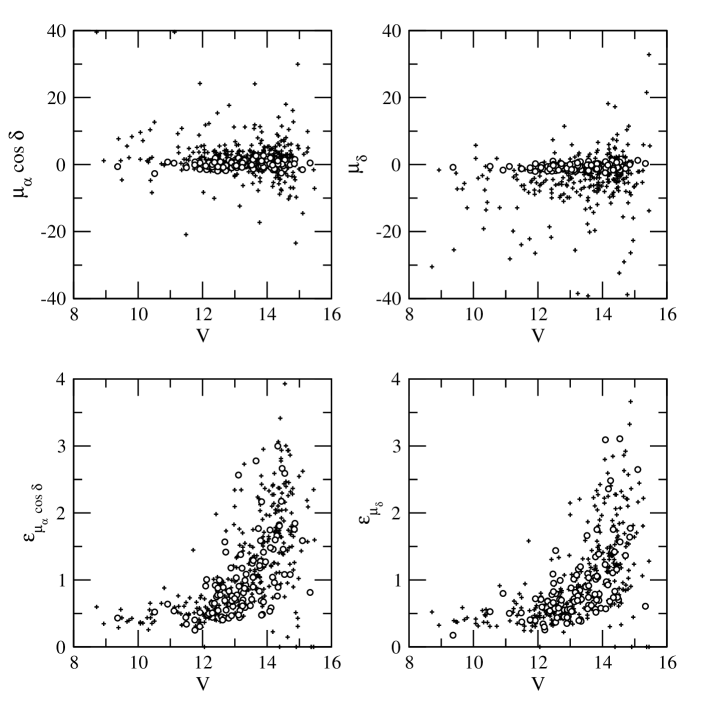
Figure 4 gives , and their errors as a function of magnitude of the stars in common with Paper III. Since the CCD photometry in Paper III covers a smaller area than the astrometric catalogue from this paper, these graphs cannot display the data for all the stars present in this study, but they describe well the behaviour of the data as a function of apparent brightness. No systematic trends in proper motion are apparent as a function of magnitude for member stars (see Sect. 4).
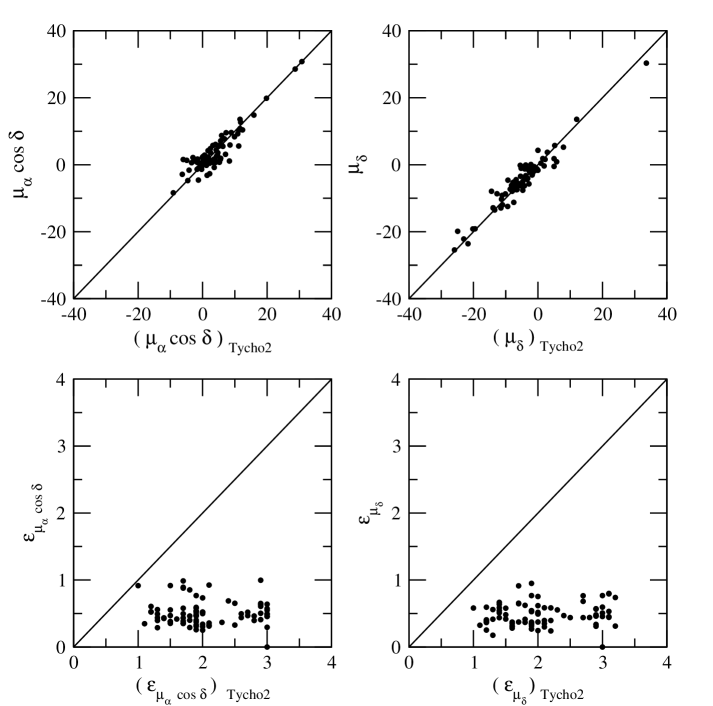
Our absolute proper motions and their errors are compared with those of the Tycho-2 Catalogue in Fig. 5. Mean differences in the sense ours minus Tycho-2 are 0.099 ( = 2.592) and 0.659 ( = 2.557) mas yr-1 in and , respectively. A linear fit to the proper motion data gives us:
= ; =
= ; =
where is the correlation coefficient.
3 Membership determination
3.1 The classical approach
Accurate membership determination is essential for further astrophysical studies of clusters. The fundamental mathematical model for cluster-field segregation set up by Vasilevskis et al. (vas (1958)) and the technique based upon the maximum likelihood principle developed by Sanders (san (1971)) have since been continuously refined.
An improved method for membership determination of stellar clusters based on proper motions with different observed precisions was developed by Stetson (ste (1980)) and Zhao & He (zhaohe (1990)). This model has been frequently used (Wang et al. Wang95 (1995), Wang96 (1996), Wang00 (2000) among others).
We used a maximum likelihood method with a 9-parametric gaussian model for the frequency function, as described in Wu et al. (Wu (2002)). The quality of the fit should be optimized near the vector point diagram (VPD) region occupied by the cluster stars, where the model is most crucial for providing reliable membership determinations. Outliers cause the estimated distribution of field stars to be flatter than the actual one, thus increasing the final probability of cluster membership (Kozhurina-Platais et al. kozhu (1995), Cabrera-Caño & Alfaro canno (1985), Zhao & Tian Zhao (1985), Zhao et al. Zhao82 (1982)). To minimize the effect of high proper-motion field stars in the model, we restricted the membership determination to the range 30 mas yr-1.
By applying the standard maximum likelihood method, several drawbacks of the parametric method were identified. The cluster motion is not very well separated from the mean field motion, making the convergence of the results unstable and producing an unrealistic intrinsic velocity dispersion of the cluster: the circular gaussian distribution intended to fit the cluster tends to assume an excessive width to improve the representation of the field distribution. This does not happen when this method is applied to dense clusters that stand out on the field, when the field population represents a small fraction of the total number of stars. But this behaviour seems unavoidable in situations like ours, with a cluster with very low contrast with the field. In these cases the parametrization of the field model is difficult and, at the same time, crucial, because the residuals of an inaccurate field model can be of the same order of or bigger than the cluster signal, and the membership calculations can be affected by this. As the cluster is at a distance of 1.8 kpc, it is clear that our measurements lack the resolution needed to resolve its internal velocity dispersion. And thus, to be on the safe side we decided to set the cluster intrinsic dispersion to zero in order to minimize the problem just outlined. This way, the model will assign to the cluster gaussian distribution a width related only to the measurement errors. We have tried fixing different internal velocity dispersions for the cluster, in the range of plausible velocities (1 to 3 km s-1) and distances (1.5 to 2 kpc), but the slight differences do not affect the values obtained or the segregation, since the membership probability is a relative quantity. We obtained the distribution parameters and their corresponding uncertainties shown in Table 3.
| NGC 1817* | 0.261 | 0.29 | 0.96 | |||
| field | 2.29 | 4.25 | 5.69 | 6.38 | ||
| 0.03 | ||||||
| * 0 (fixed) |
3.2 The non-parametric approach
As discussed by many authors (Cabrera-Caño & Alfaro canno (1985), for example), the membership determination based on fits of parametric probability density functions (PDFs) has several limitations. A circular bivariate function is a good representation of the cluster PDF if the intrinsic velocity dispersion of the cluster is not resolved. Moreover, the choice of an elliptic bivariate gaussian function for the field distribution is known to be unrealistic. The proper motion distribution of field stars has an intricate structure dominated by the combination of solar motion and galactic differential rotation. Furthermore, real field distribution wings are stronger than those predicted by a gaussian model (Marschall & Van Altena Mars (1987)). Soubiran (Sou (1992)) modeled the field population in the direction of the North Galactic Pole by means of the sum of three gaussian distributions. But adding further gaussians to the field in the classical parametric model has been shown to give poor results (Galadí-Enríquez et al. 1998b , hereafter Gal98).
In our case, as seen in Paper I and in the previous section, the cluster mean proper motion is close to the maximum of the field distribution and the cluster is loosely concentrated, making necessary an accurate model of the field distribution. Following Gal98, we perform an empirical determination of the PDFs without relying on any previous assumption about their profiles. For a sample of individuals distributed in a two-dimensional space with coordinates , it is possible to tabulate the frequency function by evaluating the observed local density at each node of a grid of points extending over the region of interest in the space. If the grid is dense enough, the empirical frequency function will be equivalent, for all practical purposes, to the true . The kernel used to estimate that local density around a point will be a normal circular kernel. The smoothing parameter (gaussian dispersion), is chosen using Silverman’s rule (Sil (1986)). The procedure was tested for several subsamples applying different proper motion cutoffs. Satisfactory results are obtained with a proper motion cutoff of 15 mas yr-1.
The only assumptions we need to apply in the non-parametric approach in our case, are the following:
-
1.
it is possible to select some area in the region under study relatively free of cluster stars, and to determine the frequency function corresponding to the VPD of this area. This will provide a representation of the field frequency function with a small (or negligible) cluster contribution, and
-
2.
the frequency function found this way is representative of the field frequency function over the whole plate and, specifically, in the area occupied by the cluster.
The empirical frequency function determined from the VPD corresponding to the area occupied by the cluster, , is made up of two contributions: cluster and field. To differentiate the two populations we need to estimate the field distribution. For this purpose, we studied the VPD for the plate area outside a circle centered on the cluster. The center of the cluster was chosen as the point of highest spatial density. We did tests with circles of very different radii, searching a reasonable tradeoff between cleanness (absence of a significant amount of cluster members) and signal-to-noise ratio (working area not too small). The kernel density estimator was applied in the VPD to these data, yielding the empirical frequency function, for a grid with cell size of 0.2 mas yr-1, well below the proper motion errors.
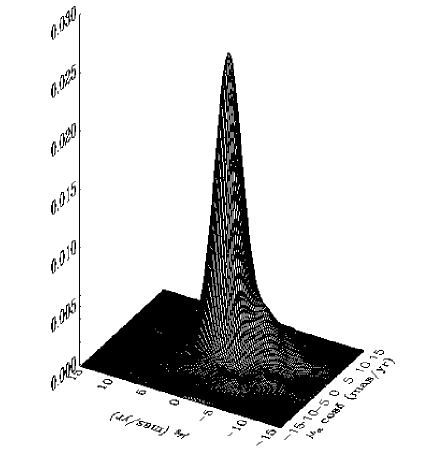
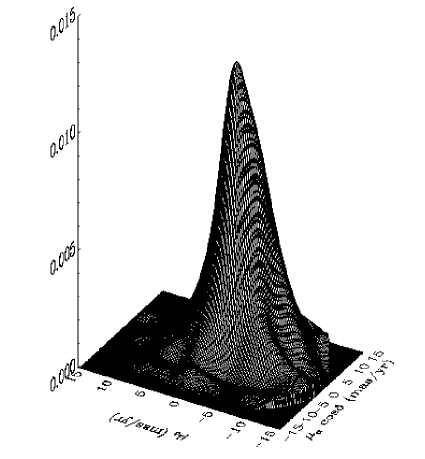
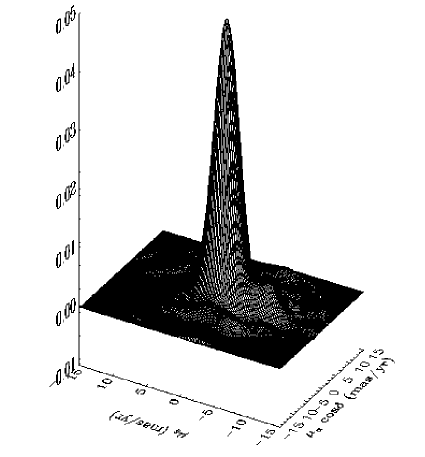
We finally found that the area outside a circle with a radius of 20 centered on the cluster yields a clean frequency function with low cluster contamination and low noise. This way we deduce the frequency function representative of the field population. The next step was to determine from a plate area centered on the cluster and containing both populations (cluster and field). We found that in our case the inner circle with a radius of 20 is well suited for our purposes. Assuming that the spatial stellar density of the field population is approximately uniform over the whole area surveyed, we can scale the field frequency function previously computed to represent the field frequency function in the inner circle by simply applying a factor linked to the area. The cluster empirical frequency function can then be determined as =. These empirical frequency functions can be normalized to yield the empirical PDFs for the mixed populations (circle), for the field (outside the circle) and for the cluster (non-field) population. Figure 6 displays these three functions. The probability for a star in a node of the grid being a member of the cluster is = ( - )/. The empirical tables can then be used to estimate the probability of a star being a cluster member according to the probability of its nearest node. These probability tables are then applied to all the stars in the surveyed area, both inside and outside the circle defined to determine the functions.
Of course, the field PDF estimated in the outer area cannot be an absolutely perfect representation of the true field PDF in the whole area. This introduces undesired noise in the frequency function of the cluster. The negative density values found in several zones obviously lack physical meaning. These negative values allow us to estimate the typical noise level, , present in the result. To avoid meaningless probabilities in zones of low density we restricted the probability calculations to the stars with cluster PDF 3. The maximum of the cluster PDF is located at () = (0.00.2,0.80.2) mas yr-1.
Like the negative density values, the small local maximum found in the cluster PDF around () = (0.0,6.0) mas yr-1 is also due to the fact that the empirical frequency function computed in the outer area of the plate does not represent the inner circle field frequency function with absolute accuracy. The stars with proper motions in this VPD area are spread over the plate and their photometry (when available from Paper III) does not suggest that they correspond to any physical group.
4 Results and discussion
The results from the non-parametric and parametric approaches are in agreement, which indicates the reliability of both methods in the case of this cluster. While in the parametric approach we need to impose a null internal dispersion (based on the known distance of the cluster) for a reliable segregation, in the non-parametric approach we are able to differentiate the cluster population without the need of any a priori knowledge.
Furthermore, the parametric approach is quite sensitive to the initial values used for the iterations, and special care has to be taken at every step to ensure that the final results make sense from a physical point of view. In the case of a doubtful number of independent clusters present in an area the parametric method can be misleading (as happened in Paper I) and additional information has to be introduced explicitly to get the PDFs. On the contrary, as shown by Gal98, if there is more than one cluster in a zone (and they show a distinctive kinematic behaviour), the non-parametric approach is capable of detecting and managing them in a direct and natural manner. In our case, we detected no sign of a distinct cluster NGC 1807.
On the other hand, the non-parametric approach does not take into account the errors of the individual proper motions, therefore it does not make any particular distinction between bright or faint stars, different epoch spread and so on. The FWHM of the empirical cluster PDF provides an estimation of the errors of the distribution. We obtained a FWHM of 4.00.2 mas yr-1. If the gaussian dispersion owing to the smoothing parameter 1.33 mas yr-1 is taken into account, this FWHM corresponds to a mean error in the proper motions of 1.5 mas yr-1, of the same order as the values given in Sect. 2.2.
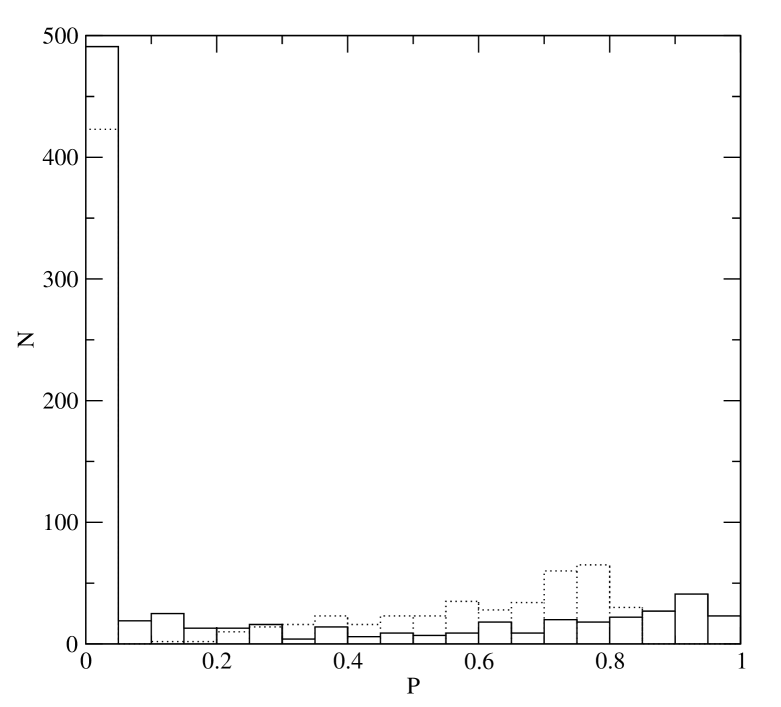
The cluster membership probability histogram (Fig. 7) shows a clear separation between cluster members and field stars in both approaches: the solid line is the traditional parametric method while the dotted line is the non-parametric approach. But the exact point of deciding which probability means that a star is a member has been traditionally left to a usually conservative, but subjective, arbitrary decision. In our case, the non-parametric approach gives an expected number of cluster members from the integrated volume of the cluster frequency function in the VPD areas of high cluster density (where ). This integration predicts that the sample contains 135 cluster members. Sorting the sample in order of decreasing non-parametric membership probability, , the first 135 stars are the most probable cluster members, according to the results of the non-parametric technique. The minimum value of the non-parametric probability (for the 135-th star) is .
There is no an equivalent rigurous way to decide where to set the limit among members and non-members in the list sorted in order of decreasing parametric membership probability, . But, if we accept the size of the cluster predicted by the non-parametric method, 135 stars, we can consider that the 135 stars of highest are the most probable members, according to the results of the parametric technique. The minimum value of the parametric probability (for the 135-th star) is .
With these limiting probabilities (; ), we get a 92 (743 stars) agreement in the segregation yield by the two methods. The 67 remaining stars (8) with contradicting segregation should be carefully studied. Discrepancies among the two approaches are actually expected due to the statistical nature of the methods themselves.
Thus, we find ourselves with two lists of member candidates that are not in complete agreement. To set up a final and unique list, and being conservative, we accept as probable members of this cluster those stars classified as members by at least one of the two methods. This is equivalent to merging both lists (each with 135 stars) and eliminating duplicated entries. This way we get a list of 169 probable member stars.
As in any other cluster membership study based on kinematic information, the resulting list of probable members has to be complemented with additional information for a cleaner segregation (see Paper III).
In Paper I, 416 stars were considered members of NGC 1817 ( 0.7), while 14 stars were considered members of NGC 1807 ( 0.7). Only one of those 14 stars is a member of NGC 1817 according to this study, and the rest belong to the field. A detailed comparison of Paper I with our results for NGC 1817 shows 113 members in common with the parametric segregation and 120 in common with the non-parametric one. Hence, Paper I was overestimating the cluster population by as much as approximately 300 stars that most probably belong to the field.
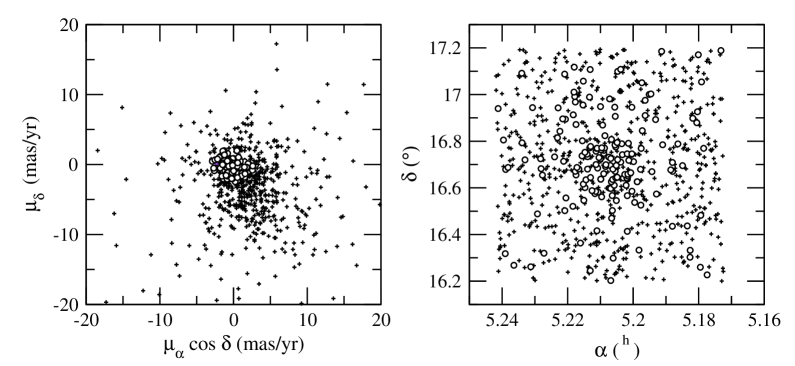
Figure 8 shows the proper motion VPD and the sky distribution for all the measured stars, where denotes a selected member of NGC 1817, and all other stars are considered field stars indicated by “”.
A comparison with the 76 stars included in the radial velocity study by Mer03 is given in Table LABEL:vr. The radial velocities have errors of 0.5 km s-1. To quantify the differences we set an agreement index to 1 if the parametric probability, , agrees with the radial velocity segregation, 2 if the non-parametric probability, , agrees, 3 if both probabilities agree and 0 if none does. We find 62 out of 76 stars with 0, that is 82 agreement with the radial velocities segregation. 18 of the disagreement consists of 10 stars out of 36 (28) being considered non-members on the basis of proper motions while only 4 out of 40 (10) were found to be astrometric members while considered non-members on the basis of radial velocities.
If we compare the two methods, the behaviour is rather similar. For the parametric method we find a total of 60 stars (79) whose membership assignation coincides with the radial velocity criterion, while for the non-parametric method this amounts to 54 stars (71).
The results show that the two approaches are similar when the parameters are well established in the parametric method and when a suitable area free from cluster stars is chosen in the non-parametric technique. But we need to be aware of the risks of the parametric model when there is more than one cluster or probable cluster. We consider the non-parametric approach a good alternative to avoid mathematical artefacts.
Table 5 lists the results for all 810 stars in the region of the open cluster: column 1 is the ordinal star number (as in Paper I, the numbering system comes from the PDS measuring machine); columns 2 and 3 give and ; columns 4 and 6 list the respective absolute proper motions (); columns 5 and 7 contain the standard errors of the proper motions; column 8 gives the number of plates used to derive proper motions; column 9 and 10 are the parametric and non-parametric membership probabilities of stars belonging to NGC 1817 and column 11 provides the identification number in the Tycho-2 Catalogue for the stars in common.
The present results for NGC 1817, based on astrometric data only, are complemented with the photometric study of Paper III.
5 Summary
Proper motions and their corresponding errors for 810 stars within a 15 15 area in the NGC 1817 region were determined from PDS measurements of 25 plates with a baseline of 81 years. A comparison with the Tycho-2 Catalogue shows good agreement and underlines the precision of the proper motions derived in this paper. These proper motions are then used to determine membership probabilities of the stars in the region. By combining parametric and non-parametric approaches, this new membership study leads to a much better segregation of the cluster stars. We obtained a list with 169 probable member stars.
Acknowledgements.
We would like to thank Floor van Leeuwen for his continuous help and valuable comments, as well as all the people at the IoA (Cambridge) for a very pleasant stay. L.B-N. gratefully acknowledges financial support from EARA Marie Curie Training Site (EASTARGAL) during her stay at IoA. This study was also partially supported by the contract No. AYA2003-07736 with MCYT. This research has made use of Aladin, developed by CDS, Strasbourg, France.References
- (1) Balaguer-Núñez L., Tian K.P., & Zhao J.L., 1998, A&AS 133, 387 (Paper I)
- (2) Balaguer-Núñez L., Jordi C., Galadí-Enríquez D., & Masana E., 2004, A&A in press (Paper III)
- (3) Cabrera-Caño J., & Alfaro E.J., 1985, A&A 150, 298
- (4) Dias W.S., Lépine J.R.D., & Alessi B.S., 2002, A&A 388, 168
- (5) Eichhorn H., 1988, ApJ 334, 465
- (6) Eichhorn H., & Williams C.A., 1963 AJ 68, 221
- (7) Friel E.D., 1995, ARA&A 33, 381
- (8) Galadí-Enríquez D., Jordi C., Trullols E., et al. 1998a, A&AS 131, 239 (Gal98)
- (9) Galadí-Enríquez D., Jordi C., & Trullols E., 1998b, A&A 337, 125
- (10) H\aog E., Fabricius C., Makarov V.V., et al. 2000, A& A 357, 367
- (11) Kozhurina-Platais V., Girard T.M., Platais I., et al. 1995, AJ 109, 672
- (12) Marschall L.A., & Van Altena W.F., 1987, AJ 94, 71
- (13) Mermilliod J.-C., Lathan D.W., Gluskova E.V., et al. 2003, A&A 399, 105 (Mer03)
- (14) Röser, S., & Bastian, U., 1991, PPM star catalogue, Astronomisches Rechen-Institut Heidelberg
- (15) Russel J.L., 1976, Ph.D. Thesis, University of Pittsburgh
- (16) Sanders W.L., 1971, A&A 14, 226
- (17) Silverman B.W., 1986, Density Estimation for Statistics and Data Analysis, J.W. Arrowshmith Ltd.
- (18) Soubiran C., 1992, A&A 259, 394
- (19) Stetson P.B., 1980, AJ 85, 387
- (20) Vasilevskis S., Klemola A., & Preston G., 1958, AJ 63, 387
- (21) Wang J.J., Zhu G.L., & Wang X.M., 1982, Ann. Shanghai Obs. 4, 92
- (22) Wang J.J., Chen L., Zhao J.H, & Jiang P.F., 1995, A&AS 113, 419
- (23) Wang J.J., Chen L., Zhao J.H, & Jiang P.F., 1996, CA&A 20, 364
- (24) Wang J.J., Chen L., Wu Z.Y, et al. 2000, A&AS 142, 373
- (25) Wu Z.Y., Tian K.P., Balaguer-Núñez, L., et al. 2002, A&A 381, 464
- (26) Zhao J.L., & He Y.P., 1990, A&A 237, 54
- (27) Zhao J.L., & Tian K.P., 1985, AcASn 26, 152
- (28) Zhao J.L., Tian K.P., Xu Z., & Yin M., 1982, ChA&A 6, 344
| Plate | Epoch | Exp.time | N. of |
|---|---|---|---|
| id. | (1900+) | min:sec | stars |
| CL415 | 16.01.31 | 30 | 159 |
| CL5293 | 30.02.16 | – | 660 |
| CL5291 | 43.02.09 | – | 537 |
| CL5292 | 43.02.22 | – | 634 |
| CL54002 | 54.01.31 | 80 | 684 |
| CL54003 | 54.02.08 | 90 | 656 |
| CL61010 | 61.02.02 | 40 | 848 |
| CL61003 | 61.02.12 | 20 | 602 |
| CL61002 | 61.02.17 | 30 | 714 |
| CL81009 | 81.12.24 | 20 | 464 |
| CL81010 | 81.12.24 | 20 | 508 |
| CL81011 | 81.12.25 | 15 | 588 |
| CL81012 | 81.12.25 | 15 | 512 |
| CL82001 | 82.02.24 | 15 | 701 |
| CL82002 | 82.02.24 | 15 | 678 |
| CL82003 | 82.02.24 | 12 | 655 |
| CL82004 | 82.02.27 | 8:15 | 606 |
| CL82005 | 82.02.27 | 5:45 | 373 |
| CL82006 | 82.02.27 | 15 | 651 |
| P9701 | 97.01.02 | 30 | 470 |
| P9702 | 97.01.11 | 30 | 426 |
| P9703 | 97.01.11 | 30 | 478 |
| P9704 | 97.01.11 | 30 | 168 |
| P9705 | 97.01.12 | 30 | 587 |
| P9706 | 97.01.12 | 30 | 540 |
| N. plates | ||||
|---|---|---|---|---|
| 4 | 10 | 1.359 | 1.235 | 1.932 |
| 5 | 7 | 1.593 | 1.455 | 2.279 |
| 6 | 7 | 1.624 | 1.338 | 2.249 |
| 7 | 14 | 1.790 | 1.520 | 2.403 |
| 8 | 10 | 1.996 | 1.390 | 2.464 |
| 9 | 12 | 1.720 | 1.765 | 2.529 |
| 10 | 13 | 1.684 | 1.429 | 2.249 |
| 11 | 13 | 2.012 | 1.658 | 2.655 |
| 12 | 20 | 1.782 | 1.420 | 2.351 |
| 13 | 14 | 1.611 | 1.290 | 2.136 |
| 14 | 24 | 1.635 | 1.299 | 2.134 |
| 15 | 28 | 1.515 | 1.486 | 2.166 |
| 16 | 37 | 1.531 | 1.095 | 1.933 |
| 17 | 21 | 1.514 | 1.206 | 1.982 |
| 18 | 44 | 1.172 | 1.023 | 1.591 |
| 19 | 38 | 1.228 | 0.950 | 1.592 |
| 20 | 48 | 1.242 | 1.056 | 1.667 |
| 21 | 63 | 1.076 | 0.829 | 1.400 |
| 22 | 75 | 0.842 | 0.720 | 1.131 |
| 23 | 69 | 0.940 | 0.677 | 1.179 |
| 24 | 56 | 0.630 | 0.559 | 0.853 |
| 25 | 62 | 0.471 | 0.429 | 0.646 |
| 685 | 1.162 | 0.958 | 1.545 |
| Mer03 | Table 5 | Mer03 | Table 5 | ||||||||
|---|---|---|---|---|---|---|---|---|---|---|---|
| 8 | 557 | 0.40 | 0.65 | 0 | M | 90 | 554 | 0.00 | 0.47 | 3 | NM |
| 12 | 562 | 0.88 | 0.77 | 3 | M | 103 | 580 | 0.01 | 0.28 | 3 | NM |
| 19 | 358 | 0.92 | 0.73 | 3 | M | 138 | 322 | 0.57 | 0.62 | 3 | NM |
| 22 | 351 | 0.70 | 0.66 | 0 | M | 155 | 519 | 0.08 | 0.78 | 1 | NM |
| 30 | 334 | 0.65 | 0.63 | 0 | M | 161 | 527 | 0.00 | 0.31 | 3 | NM |
| 40 | 541 | 0.85 | 0.80 | 3 | M | 187 | 394 | 0.00 | 0.00 | 3 | NM |
| 44 | 546 | 0.98 | 0.78 | 3 | M | 269 | 521 | 0.00 | 0.00 | 3 | NM |
| 56 | 379 | 0.96 | 0.79 | 3 | M | 531 | 432 | 0.00 | 0.35 | 3 | NM |
| 71 | 317 | 0.58 | 0.60 | 0 | M | 536 | 448 | 0.00 | 0.00 | 3 | NM |
| 72 | 318 | 0.73 | 0.81 | 2 | M | 571 | 610 | 0.81 | 0.81 | 0 | NM |
| 73 | 528 | 0.95 | 0.81 | 3 | M | 598 | 696 | 0.00 | 0.00 | 3 | NM |
| 79 | 543 | 0.94 | 0.77 | 3 | M | 621 | 768 | 0.00 | 0.00 | 3 | NM |
| 81 | 542 | 0.79 | 0.77 | 3 | M | 1081 | 885 | 0.00 | 0.00 | 3 | NM |
| 121 | 367 | 0.94 | 0.71 | 1 | M | 1082 | 886 | 0.00 | 0.78 | 1 | NM |
| 127 | 339 | 0.86 | 0.82 | 3 | M | 1083 | 896 | 0.00 | 0.00 | 3 | NM |
| 164 | 532 | 0.98 | 0.80 | 3 | M | 1095 | 870 | 0.88 | 0.77 | 0 | NM |
| 177 | 577 | 0.81 | 0.63 | 1 | M | 1096 | 863 | 0.00 | 0.34 | 3 | NM |
| 211 | 331 | 0.55 | 0.80 | 2 | M | 1112 | 733 | 0.72 | 0.62 | 3 | NM |
| 212 | 321 | 0.90 | 0.74 | 3 | M | 1153 | 815 | 0.00 | 0.23 | 3 | NM |
| 244 | 556 | 0.92 | 0.75 | 3 | M | 1161 | 811 | 0.00 | 0.00 | 3 | NM |
| 185 | 395 | 0.93 | 0.81 | 3 | M | 1194 | 674 | 0.00 | 0.00 | 3 | NM |
| 206 | 343 | 0.91 | 0.78 | 3 | M | 1197 | 672 | 0.00 | 0.30 | 3 | NM |
| 1114 | 735 | 0.79 | 0.70 | 1 | M | 1246 | 468 | 0.00 | 0.00 | 3 | NM |
| 1117 | 600 | 0.97 | 0.74 | 3 | M | 1248 | 467 | 0.15 | 0.54 | 3 | NM |
| 1135 | 714 | 0.90 | 0.82 | 3 | M | 1252 | 660 | 0.00 | 0.00 | 3 | NM |
| 1152 | 816 | 0.00 | 0.35 | 0 | M | 1254 | 648 | 0.00 | 0.44 | 3 | NM? |
| 1208 | 689 | 0.03 | 0.28 | 0 | M | 1267 | 237 | 0.00 | 0.00 | 3 | NM |
| 1265 | 463 | 0.19 | 0.51 | 0 | M? | 1273 | 112 | 0.00 | 0.00 | 3 | NM |
| 1292 | 605 | 0.87 | 0.65 | 1 | M | 1297 | 430 | 0.94 | 0.73 | 0 | NM? |
| 1408 | 301 | 0.97 | 0.76 | 3 | M | 1302 | 423 | 0.00 | 0.77 | 1 | NM |
| 1412 | 150 | 0.93 | 0.79 | 3 | M | 1314 | 206 | 0.00 | 0.00 | 3 | NM |
| 1420 | 160 | 0.75 | 0.75 | 3 | M | 1316 | 214 | 0.00 | 0.21 | 3 | NM |
| 1433 | 180 | 0.97 | 0.74 | 3 | M | 1406 | 304 | 0.93 | 0.78 | 0 | NM |
| 1456 | 292 | 0.69 | 0.68 | 0 | M | 1418 | 56 | 0.00 | 0.45 | 3 | NM |
| 1459 | 296 | 0.03 | 0.66 | 0 | M | 1424 | 3 | 0.00 | 0.27 | 3 | NM |
| 1574 | 65 | 0.05 | 0.52 | 0 | M | 1455 | 502 | 0.40 | 0.82 | 1 | NM |
| 1467 | 493 | 0.00 | 0.00 | 3 | NM | ||||||
| 1502 | 122 | 0.65 | 0.48 | 3 | NM? | ||||||
| 1557 | 91 | 0.00 | 0.00 | 3 | NM | ||||||
| 1718 | 162 | 0.00 | 0.00 | 3 | NM? |