Thick disks and halos of spiral galaxies M 81, NGC 55 and NGC 300. ††thanks: Based on observations with the NASA/ESA Hubble Space Telescope, obtained at the Space Telescope Science Institute, which is operated by the Association of Universities for Research in Astronomy, Inc., under NASA contract NAS 5-26555.
By using images from the HST/WFPC2/ACS archive, we have analyzed the spatial distribution of the AGB and RGB stars along the galactocentric radius of nearby spiral galaxies M 81, NGC 300 and NGC 55. Examining color-magnitude diagrams and stellar luminosity functions, we gauge the stellar contents of the surroundings of the three galaxies. The red giant population (RGB) identified at large galactocentric radii yields a distance of Mpc for M 81, Mpc for NGC 55, and Mpc for NGC 300, and a mean stellar metallicity of , , and respectively. We find that there are two number density gradients of RGB stars along the radius, which correspond to the thick disk and halo components of the galaxies. We confirm the presence of a metallicity gradient of evolved stars in these galaxies, based on the systematic changes of the color distribution of red giant stars. These results imply that the thick disk might be a general feature of spiral galaxies, and endorse a further investigation of the outer stellar edges of nearby spirals, which is critical in constraining the origin and evolution of galaxies.
Key Words.:
Galaxies: individual: M 81, NGC 55 and NGC 300 — galaxies: stellar content — galaxies: photometry — galaxies: structure1 Introduction
The fossil record of galaxy formation and evolution is imprinted on the spatial distribution, ages and metallicities of galactic stellar populations. The properties of the outer parts of galaxies are very sensitive to both galaxy star formation history and the nature of the intergalactic medium.
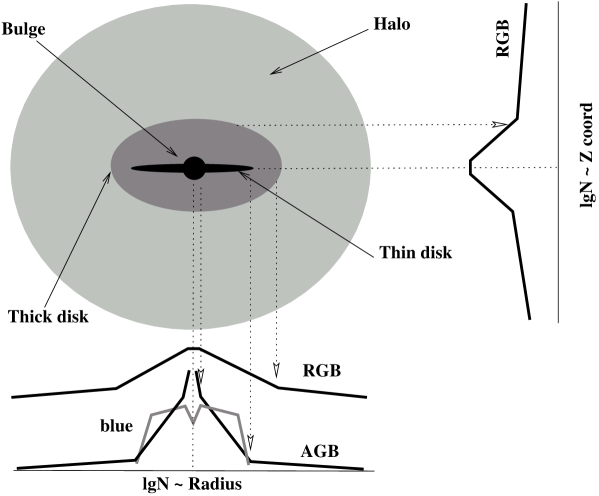
The various studies of the nearest spiral galaxies, such as the Milky Way, M31 and M33, have revealed their similar stellar structure: bulge, thin and thick disks and halo (van der Marel, 2001; Zocalli et al., 2002; Sarajedini & van Duyne, 2001; Pritchet & van der Bergh, 1988; Belazzini et al., 2003; Guillandre et al., 1998; Brown et al., 2003; Zucker et al., 2004). Aside from the spatial distribution law and kinematics, stars from each of these subsystems share a common star formation history retaining considerable age and chemical information (Vallenary et al., 2000; Prochaska et al., 2000; Chiba & Beers, 2000; Zoccali et al., 2002; Williams, 2002, Sarajedini et al., 2000, Brewer et al., 2003). The majority of the investigations concentrated predominantly on the central parts of these galaxies, biased towards high surface brightness star forming regions. In recent years, wide-field observations of the nearest spirals have shown that they are substantially more extended than previously thought. The information on the actual origin of these outer regions is scarce, and has been a matter of debate. Today, we know that most of these extended, elusive stellar components are predominantly evolved, but whether this is a true single burst ancient stellar population, with little or no intermediate-age component, has not yet been established. By ’population’, we mean here an ensemble of stars that share a coherent history.
Various tests of formation scenarios have centered on two extreme viewpoints — (1) the monolithic collapse model for the galaxy halo (Eggen et al., 1962) together with internal chemodynamical evolution for the thick disk (e.g. Burkert et al., 1992), and (2) the accretion model for both the halo (Searle & Zinh, 1978) and the thick disk (Carney et al., 1989; Gilmore, Wyse and Norris 2002). In view of the merging of the Sagittarius dwarf galaxy with Milky Way (Ibata, Gilmore & Irwin 1995), and the predictions of cold dark matter (CDM) cosmological models for hierarchical galaxy formation from large number of mergers, the accretion origin of the thick disk and halo is especially relevant. At the same time, the significant difference in the chemical abundance pattern of the Milky Way’s halo stars and its satellite galaxies likely implies a different evolution history (Brewer & Carner, 2004; Venn et al., 2004). An alternative disk thickening model by the evolution of massive star clusters in a thin disk has been suggested (Kroupa 2002). By studying the spatial distribution of evolved stars, we may hope to attain a basic understanding of the general morphology of a galaxy at the time when the dominant component of its old stellar population formed and constrain the proposed evolution models.
It is easier to separate the spherical bulge from the exponential thin disk components based on their distinctive surface brightness profiles (Kent, 1985; Byun & Freeman, 1995; Bagget et al., 1998; Prieto et al., 2001) than the thick disk from halo, due to the extremely low surface brightness of these galaxy components (typically below the mag). While some of the recent studies of the outer regions of spiral galaxies rely on multicolor surface photometry, successful detection is only possible in the nearest galaxies or in the edge-on galaxies with a bright and extended thick disk/halo (e.g. Harris & Harris, 2001; Dalcanton & Bernstein, 2002; Pohlen et al. 2004). For example, Dalcanton & Bernstein (2002) analyzed sample of 47 edge-on spiral galaxies and found the presence of a thick disk in 90% of them, based on the results of multicolor surface photometry. The other important result obtained in those studies is that both thin and thick disks are truncated, with mean scaleheight and scalelength of the thick disk several times larger than that of the thin disk (Pohlen et al. 2004). The question of whether these thick disk structures consist of evolved stellar populations is rather unclear, due to ambiguity of the surface brightness colors. For example, AGB and RGB stars with different ages can have almost the same color, making it difficult to reliably determine the age of the observed structures. The extended ionized gas emission can also contribute significantly into surface brightness profiles (Papaderos et al 2003). Star number counts are the preferable method for studying galactic outskirts due to the extremely low surface brightness of these elusive components. Single-star photometry also allows us to eliminate young stars (located mainly in the thin disk) and background objects (e.g., Tikhonov 2002; Drozdovsky, Tikhonov & Schulte-Ladbeck 2003; Aparicio 2003).
Our goal here is to extend the study of stellar thick disks and halos over a set of three spiral galaxies outside the Local group, M 81, NGC 55 and NGC 300. These galaxies provide contrasting environments, and an opportunity to examine the stellar populations on larger galactic scales. In particular we address the following two issues: the spatial distribution of different stellar populations in the outskirts of spiral galaxies and the metallicity gradient of these populations. Brief information about the galaxies is given in Table 1. Each of these objects has several fields imaged with HST, situated at various distances from the center. The high spatial resolution of HST allows us to perform single-star photometry even in crowded fields. The availability of images at various galactocentric distances allows us to reconstruct the behavior of stellar density along the galactocentric radius. Since thick disks and halos consist of old stars — red giants and, to a lesser degree, AGB stars — only these stars were included in our consideration. The young stellar populations, located within the thin disks of these galaxies, have been studied in detail (Zickgraf et al., 1990; Georgiev et al., 1992a,b; Pritchet et al., 1987; Kiszkurno-Koziej, 1988; Pierre & Azzopardi, 1988) and are not considered in the current work.
A brief description of the target galaxies and justification for their selection is given in Section 2, followed in Section 3 by a description of the HST data and reduction techniques. Our results are discussed in Section 4 and summarized in Section 5.
2 The galaxies
2.1 M 81
M 81 is the gravitationally dominant member of its group, consisting of about 30 types of galaxies (Börngen et al. 1982, 1984; Karachentseva et al., 1985). The galaxy is a suitable object for this study because of its close distance, Mpc (Freedman et al., 2001) and small inclination, which provide an opportunity to study the geometry of the stellar structures across the disk plane.
While the young stellar populations of M 81, populating mainly its spiral arms, have been previously studied in numerous investigations, little is known about the galaxy periphery. Its optical surface brightness profile has been traced out to limiting isophotes of (Tenjes et al., 1998), corresponding to major and minor axis diameters of about .
The radio observations of M 81 revealed hydrogen bridges from M 81 to the neighboring galaxies M 82, NGC 2976, and NGC 3077 (van der Hulst, 1978; Appleton et al., 1981; Yun et al., 1994; Westpfahl et al., 1999; Boyce et al., 2001). The long gaseous filaments, generated by galaxy interactions, are gravitationally unstable and might be fragmenting into isolated systems, forming young Tidal Dwarf Galaxies (TDG) (Barnes & Hernquist, 1992; Elmegreen et al., 1993; Duc et al., 1998; Weilbacher, 2002). TDG candidates have been discovered in many interacting pair of galaxies (Deeg et al., 1998; Hunsberger et al., 1996). It has been suggested that the dwarf galaxies observed within the hydrogen bridges of M 81 — Ho IX, Garland, and BK3N — may be TDG (Miller, 1995; Flynn et al., 1999; Boyce et al., 2001). By comparing the results of observations with theoretical isochrones, Sakai & Madore (2001) concluded that the age of young stars in Garland is less than 150 Myr. The star formation history of Ho IX, Garland and BK3N, estimated from the single-star photometry of the HST images (Makarova et al., 2002), confirms that the intensive star formation in these galaxies is on the time scale of 50-150 Myrs. In their study, however, the possible presence of outer stars from the neighboring M 81 and NGC 3077 has not been considered. The underlying stellar population with ages more than 1 Gyr, observed by Makarova et al. (2002), may be more closely related to the outskirts of M 81 and/or NGC 3077 than to the underlying stellar population of the studied galaxies.
2.2 NGC 55
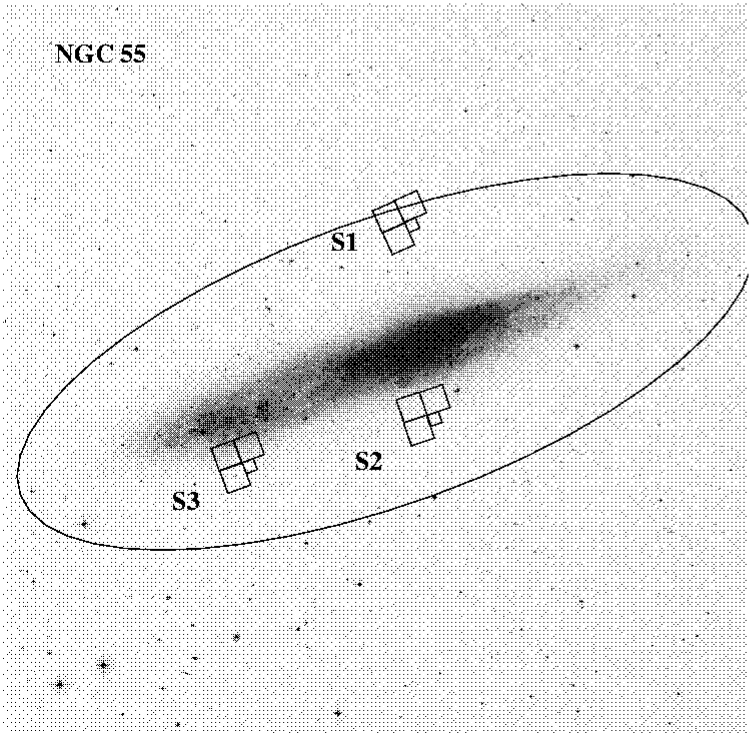
The spiral SB(s)m galaxy NGC 55 (Fig.2) is a member of the Sculptor group, consisting of approximately 30 galaxies (Cote et al., 1997; Jerjen et al., 2000). Since the galaxy is seen almost edge-on (see Table 1), it is a convenient object for studying the extent of the thick disk and halo perpendicularly to a disc plane.
We have measured the distance to NGC 55 as 2.1 Mpc, which differs from the previous estimations by Graham (1982) of Mpc, based on the tip of the red giant branch (TRGB) method, and Pritchet et al. (1987) of Mpc, using photometry of Carbon stars.
The galaxy’s neutral hydrogen disk has an angular size of about (Puche et al., 1991). It is plausible that part of this gas was driven out by the stellar winds during galaxy evolution. There is also a reported detection of a large diffuse structure which extends up to about 3 kpc above the disk of NGC 55 seen in Chandra X-ray, VLT H, and Spitzer FIR emission (Oshima et al., 2002; Otte & Dettman, 1999; Engelbracht et al., 2004).
2.3 NGC 300
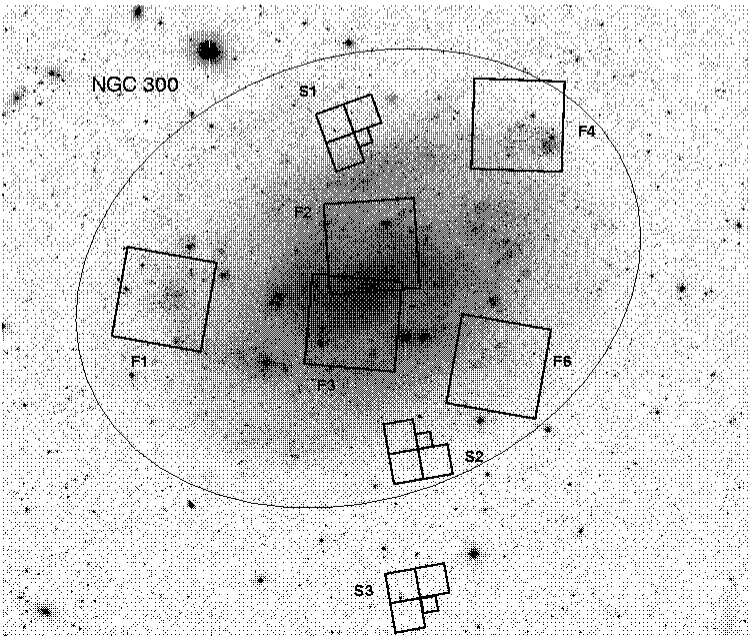
The spiral galaxy SA(s)d (NED) NGC 300 is another member of the Sculptor group (Fig. 3). Graham (1982) assumed that NGC 300 is located at the same distance as NGC 55, i.e. Mpc. Later, Graham (1984) estimated the distance Mpc using photometry of Cepheids. The present accepted distance is Mpc, based also on the Cepheid photometry (Freedman et al., 1992). Butler, Martinez-Delgado & Brandner (2004) determined that the distance modulus estimate based on the TRGB method was in good agreement with the Cepheid distance determined by Freedman et al. (1992). We confirm their results independently from the -band TRGB method, estimating a distance of based on a similar set of HST data.
The low inclination of NGC 300 (see Table 1) allows us to investigate both the central part of the galaxy and its periphery. NGC 300 has a large hydrogen disk, (Rogstad et al., 1979; Puche et al., 1990), which extends further than the visual part of the galaxy. The central part of NGC 300 has been studied in detail, but the information about its outer stellar populations is scarce. The brightest stars of NGC 300 have been studied spectroscopically for the identification of blue supergiants and determining a metallicity gradient along the galaxy disk (Bresolin et al., 2002). Using the RGB stars of the disk or the halo, we are able to track the surface number density and metallicity gradients for the fainter and elder (at least a Gyr) stellar populations.
3 Observations, data reduction and analysis.
3.1 HST WFPC2 and ACS/WFC observations
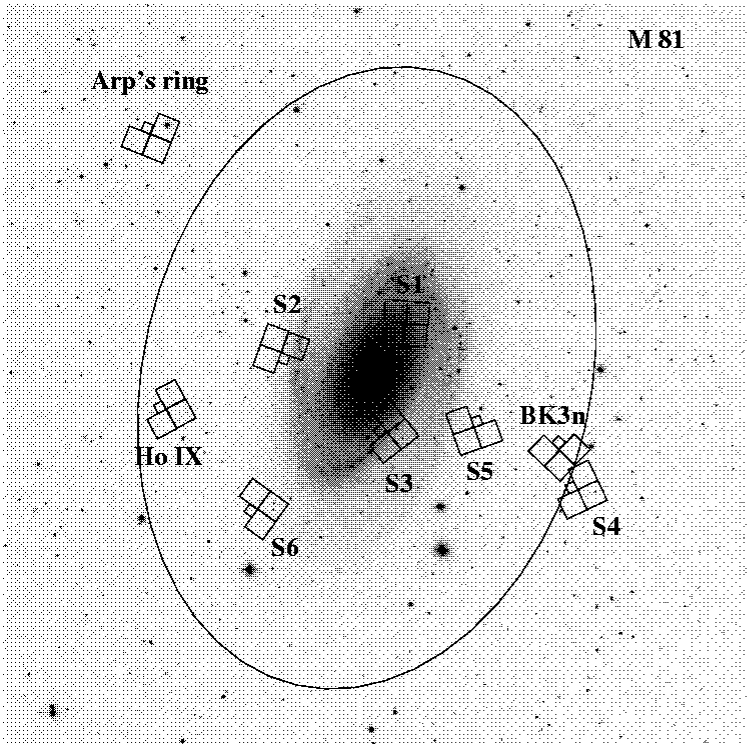
To study the resolved stellar population of galaxies, we obtained the available HST images of M 81 (9 WFPC2 fields), 3 WFPC2 and 6 ACS/WFC regions of NGC 300 and 3 WFPC2 fields around NGC 55. Digital Sky Survey images of these galaxies with WFPC2 & WFC footprints are shown in Fig. 1, 2 and 3. The observational data are listed in Table 2, where R is the angular galactocentric distance of the observed field in arcminutes, ID is the HST program number and Nstars is the number of detected stars. Images were reprocessed through the standard WFPC2 and ACS STScI pipeline, as described by Holtzman et al. (1995a). After removing cosmic rays, we performed single-star photometry with the packages DAOPHOT and ALLSTAR in MIDAS (Stetson, 1994). These programs use an automatic star-finding algorithm, followed by measurements of their magnitudes via point-spread-function (PSF) fitting that is constructed from the isolated ’PSF-stars’. For the WFPC2 data, we applied the aperture correction from the 1.5 pixel radius aperture to the standard radius aperture size for the WFPC2 photometric system using the PSF-stars. The F555W, F606W and F814W instrumental magnitudes have been transformed to standard magnitudes in the Kron-Cousins system using the prescriptions of Holtzman et al. (1995b). For the ACS/WFC data, we derived an aperture correction to the (10 pixels) standard aperture from the data. The final ACS photometry uses the latest available photometric zero-points in the HST Vegamag system as provided by the STScI ACS team (Instrument Science Report ACS 2004-08). The background galaxies, unresolved blends and stars contaminated by cosmetic CCD blemishes were eliminated from the final lists, using their characteristic ALLSTAR parameters, , (Stetson, 1994).
3.2 Method and star selection.
The primary goal of this study is to determine the basic morphological and chemical properties of the outer stellar surroundings of the target spiral galaxies. Using color-magnitude diagrams and stellar luminosity functions, we separated different stellar populations and analyzed their spatial distribution. We have compared stellar population characteristics of available fields differentially, avoiding some the complications of comparisons with stellar evolution models. Because the RGB loci for old stars are far more sensitive to metallicity than age, we use them to construct a first-order metallicity distribution functions, neglecting the known age-metallicity degeneracy. The spectroscopy of individual thick disk/halo stars will be needed to break the age-metallicity degeneracy inherent to broad-band RGB colors.
Since the purpose of our research is to define the change of the stellar number
density with increasing galactocentric distance, we should be sure that
various selection effects do not significantly affect the final results or at
least that their influence can be corrected. For this
the following considerations were taken into account:
(i) All the data for this investigation were retrieved from the HST
archive and were obtained as a part of different programs.
While this allowed us to collect far more data than would
be possible in a single primary program, it limited our research.
The observations differ in exposure time, affecting the total number of
resolved point sources.
To minimize the influence of different depth on number
of detected stars, we established a limiting luminosity
threshold from the field with shortest exposure time. The single threshold
was used to exclude fainter stars from all fields. This limit
was established to be a magnitude brighter than the photometric limiting
depth, corresponding to the detection completeness level of derived
from the artificial star trials. We also restricted our work to observations
in , , and . Being aware of different band-width
of and we intercompare the derived color (from
and ) of RGB stars
at close galactocentric distances.
(ii) By removing the cosmic ray traces, we decrease their influence on
the stellar counts. This step is important
in sparse fields of halo, where the number of residual cosmic rays is
comparable to the number of faint stars. The limiting depth selection
of stars at the level of a magnitude above the photometry limit
also allowed us to minimize the possible influence
of cosmic ray cleaning on the star counting.
As a result, the reduced number of stars
increases the statistical fluctuations, but the number
density of stars is less influenced by residual traces of cosmic rays.
(iii) The completeness of star detection, especially at faint levels, is
also effected by crowding of stars, which increases towards the galaxy center.
We excluded from our analysis the central galactic areas due to difficulties
with the separation of evolved bulge stellar populations from the thick disk
and halo ones. The artificial star trials have been used
to correct the number density for
the incompleteness.
(iv) Due to some inclination of the observed galaxies, it is important also
to correct the measured stellar counts for the azimuthal position of the
field. While changes in thickness of the disk might influence the results,
it should not significantly change the radial gradients.
(v) Another concern here is our ability to distinguish by multi-color
photometry alone a grouping of stars in the thick
disk/halo from the plethora of stars found in the galaxy’s enveloping
thin disk.
Can we separate the
AGB and RGB stars between these two disks?
For the high-inclination systems, such as NGC 55, this selection can
be made based on their extraplanar distances.
There are ways to consider thin/thick disk decomposition in
low-inclination galaxies, using their spatial distribution (2D thick/thin
disk numerical decomposition) and age-metallicity selection relying
on the color of RGB stars.
Several studies have shown that thick disk/halo stars
are uniformly older and more metal poor than thin disk ones (Gilmore &
Wyse 1985; Carney et al. 1989).
If the thick disk stars are uniformly old, then any star whose life
expectancy is brief will necessarily belong to the thin disk, regardless
of its kinematics or metallicity.
By sorting stars on the different groups according to their
life expectancies, we can assign probable membership of stars to the
thin disk or thick-disk populations.
The measurements of the stellar density along the galaxy radius and search for the truncation radius (edge) of the thin disk may also clarify this question. In one of our cases (see section 4.3), the density of RGB stars decreases monotonously ( they do not show a two-slope profile) and does not uncover the edge of the thin disk.
We do not consider the AGB stars as a good tracer of a thick disk. The relative density of the AGB stars in comparison with RGB stars is lower and their evolutionary status is less certain. However, they can be a good indicator of the edge of the thin disk.
4 Results
4.1 CM Diagrams of M 81, NGC 55 and NGC 300.
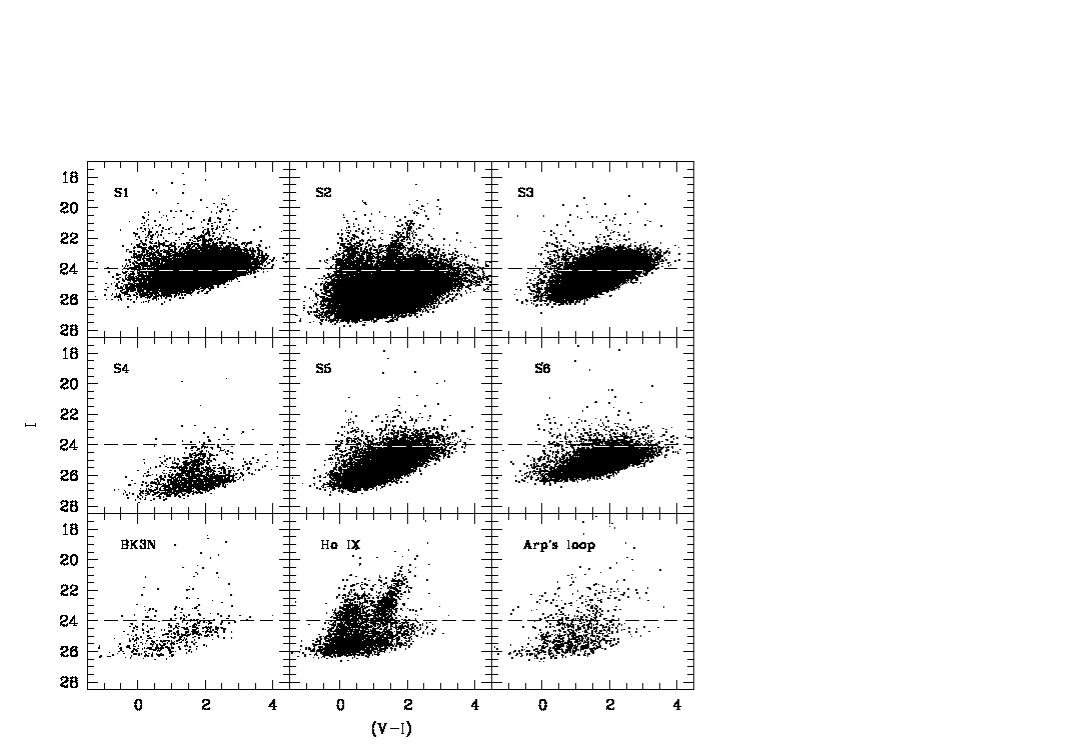
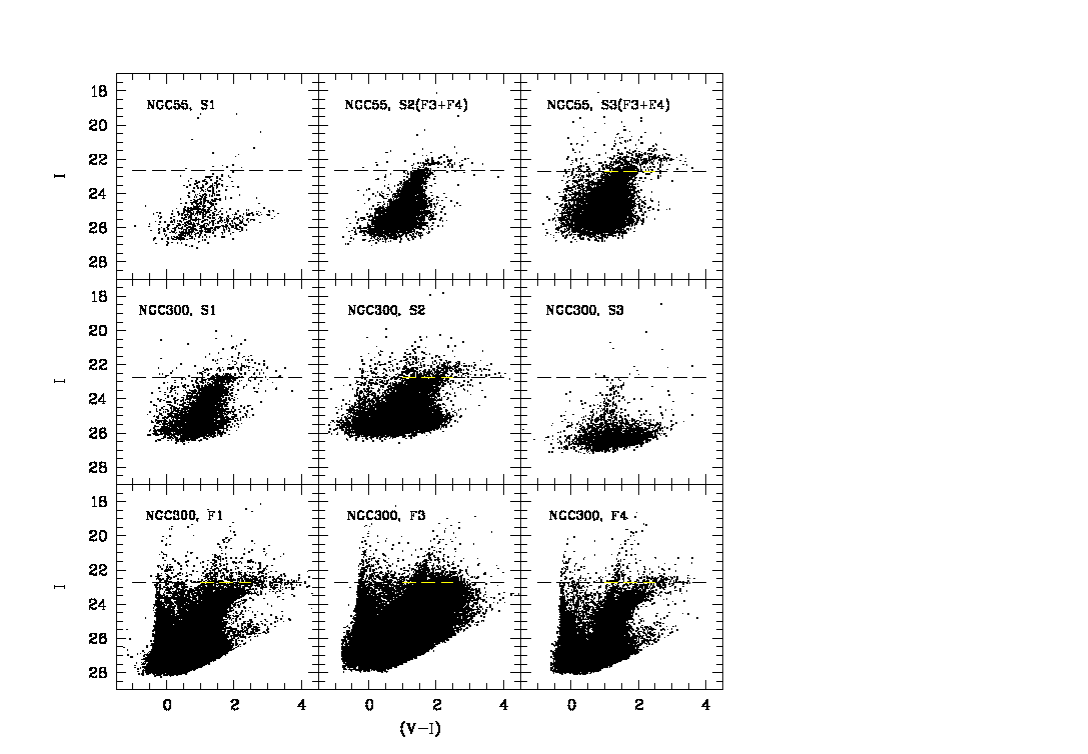
The median number of stars detected in both the and filters in the WFPC2 fields is about 5000, and in the ACS fields (see Table 2). The results of stellar photometry are presented on the CMDs (Fig. 4 and 5). The features of these diagrams resemble those of spiral galaxies. All the CMDs are characterized by a noticeable red plume, while the strength of the blue plume varies a lot. The spatial variations are apparent from the varying strengths of the blue and red plumes, and show systematic dependence on the galactocentric distance of the field. The CMDs of the circumnuclear fields show evidence of blue and red supergiants, main-sequence stars and blue-loop stars. The outer-field stellar populations are dominated by the “red tangle”, which contains the red giant branch. Above this tangle, some of the stars are asymptotic giant branch (AGB) and red supergiant (RSG) stars. The dashed line in all the presented CMDs indicates the position of the tip of the red giant branch (TRGB).
4.2 Distances
The errors in distances of investigated galaxies do not significantly affect our major goal to constrain the relative stellar density distribution. In the context of distance verification, however, it is a valuable opportunity to compare the tip of the red giant branch (TRGB) estimations with other methods. The absolute magnitude of the TRGB gives an estimate of distance with a precision and accuracy similar to that of the Cepheid method, % (Lee et al., 1993; Bellazzini et al. 2001). The -band TRGB method has been successfully applied to a wide range of dwarf galaxies, using both ground-based and HST photometry.
To the best of our knowledge, this is first measurement of M 81 and NGC 55 distances based on this method. As it was shown in several studies, the alternative distance estimation relying on the Cepheid method can significantly differ from the TRGB and other methods. For example, in the case of the well studied galaxy M 33 the disagreement between two methods is in distance modulus, which is a large value for a galaxy located in the Local Group (Lee et al. 2002; Kim et al. 2002).
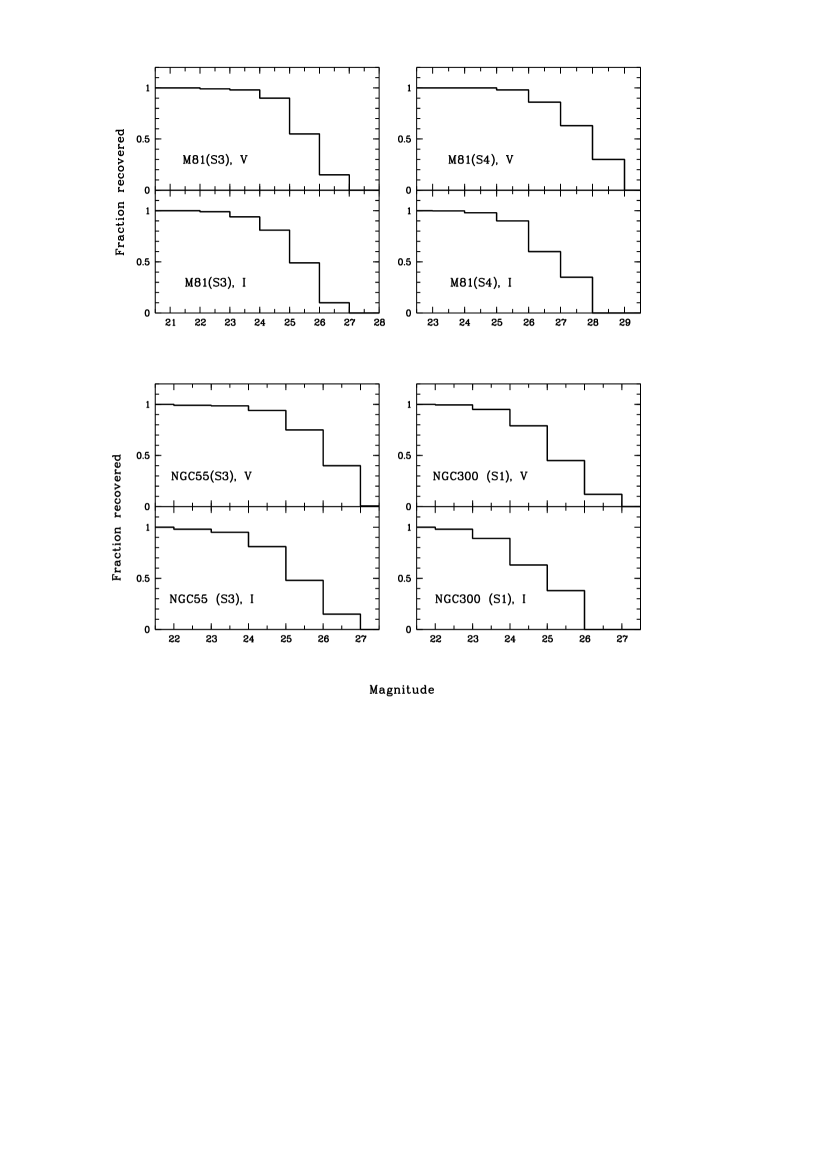
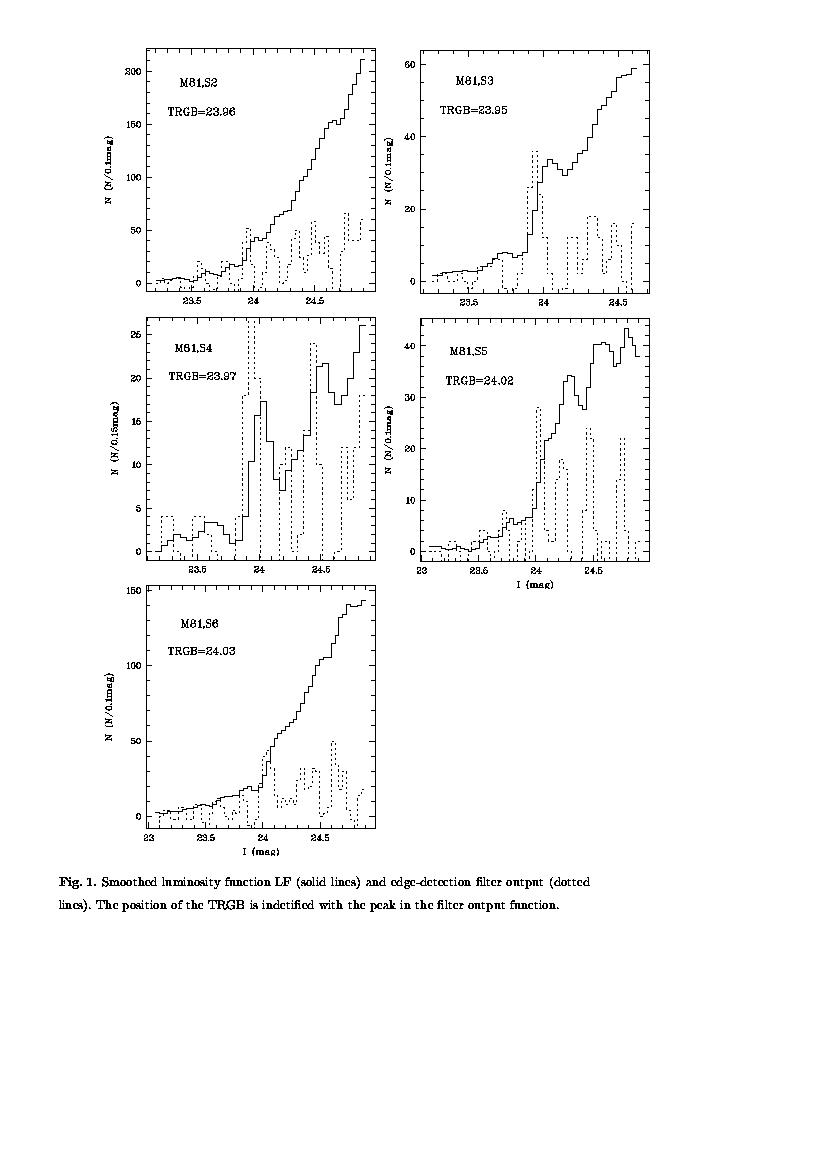
In order to estimate distances, we have used one or several fields for each galaxy, avoiding star formation regions with bright supergiants. We preferred fields with a large number of red giants to decrease the statistical error of the TRGB method. These fields are S2, S3, S4, S5, S6 for M 81 (Fig.1), S3 for NGC 55 (Fig.2) and S1 for NGC 300 (Fig.3). CM diagrams of these fields are shown in Fig. 4 and 5. Typical incompleteness fractions are shown in Fig. 6 and 7 for some of the fields. The stellar luminosity function of each field reveals a sudden discontinuity which corresponds to the TRGB (see Fig.8). Using the method of Lee et al. (1993), we estimate distances to the galaxies and mean metallicity of their red giants. The extinction coefficients of all galaxies are taken from the study of Schlegel et al. (1998).
We obtain the following results for the different fields around M 81: field S2 , field S3 – , field S4 – , field S5 – and field S6 – . The metallicity of the inner fields (S2, S3, S5, S6) varies from to , while the metallicity of the outer field S4 is . The mean distance modulus for M 81 is , corresponding to Mpc, which is very close to the mean distance of 16 other dwarf galaxies in the group, , determined with TRGB method (Caldwell et al. 1998, Karachentsev et al. 2002). This indicates that the gravitationally dominant galaxy M 81 is situated near the center of its group and there is no asymmetry in the spatial distribution of these galaxies.
The Cepheid distance of M 81, derived by Freedman et al. (2001), corresponds to the distance modulus of . This value differs from the TRGB distance, derived in this paper, on average , exceeding the estimated errors and showing no correlation with the metallicity gradient.
For NGC 55 (field S3) we estimate the following values: , Mpc and . Our distance estimation differs essentially from the value of Puche et al. (1991) Mpc, but it is in accordance with the suggestion of Graham (1982) that galaxies NGC 55 and NGC 300 are at the same distance.
For NGC 300 (field S1) we find the following results: , Mpc, and . The distance is very similar to the result of Freedman et al. (2001), ( Mpc), based on the Cepheid photometry.
4.3 Metallicity gradient of the RGB stars along galactocentric radius.
The existence of metallicity gradients along the galactocentric radius has been established in the Galaxy and other nearby spiral galaxies, on the basis of the spectroscopy of stellar clusters (e.g., Friel & Janes, 1993; Rolleston et al., 2000) and Hii regions (e.g., Shaver et al., 1983; Márquez et al., 2002). However, only a few galaxies are close enough to perform metallicity measurements from the spectrum of evolved stellar populations due to their low luminosity (Reitzel & Guhathakurta, 2002). The idea to use the color of the RGB stars comes from its much greater sensitivity to metallicity than it has to age, making the mean RGB color a good stellar metallicity indicator, although there is some degeneracy (Lee, Freedman & Madore 1993). The advantage of this method is that red giants can be situated at relatively large galactocentric distances, where surface brightness is very low and spectral methods are below the sensitivity limits.
Among the selected galaxies the most apparent metallicity-age gradient is observed in M 81, based on the comparison of the mean colors of the RGB locus for the different fields. The mean metallicity of red giants in the S2, S3, S5, and S6 fields is . For the field S4, which has a larger galactocentric distance (Fig. 1) the mean RGB metallicity is .
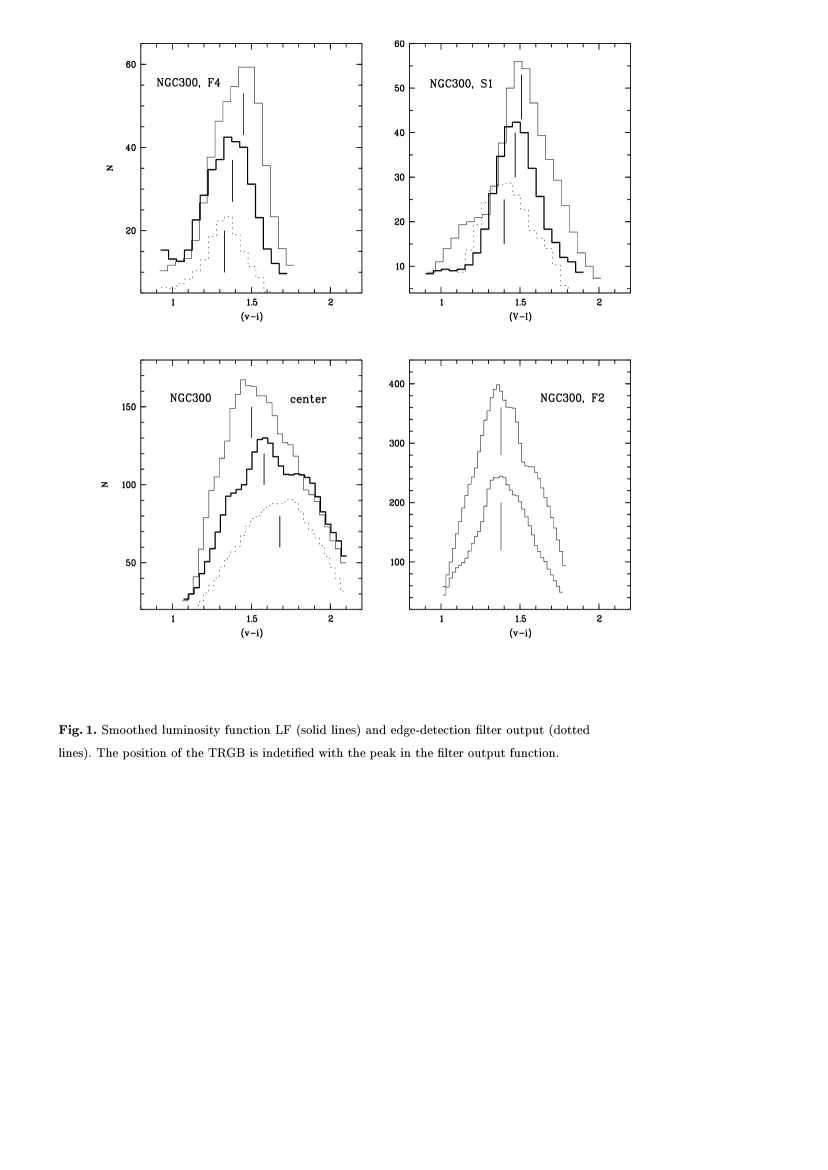
The metallicity gradient of the galaxy NGC 300 in the fields S1 and F4 can be seen in Fig. 8. The maximum of the stellar color distribution (mode of the distribution) traces the RGB position. This maximum changes from to along the galactocentric radius, conforming with a metallicity increase of the RGB stars assuming a uniform prevailing age. We investigated the color of RGB stars throughout the thin disk of NGC 300 using the ACS/WFC and WFPC2 images, and find a color gradient of RGB stars at the edge of the thin disk (fields S1 and F4) and near the center of the galaxy (Fig. 8). The decreasing of the color index towards the center of galaxy may be a combining effect of the age and metallicity of red giants. Thus increase in the number of the red giants near the center of galaxy can be explained by either lower metallicity or younger average age. At the edge of the galaxy, the color index decrease can be explained only by a decrease of the metallicity with radius, because the age of red giants cannot decrease at the periphery without signs of star formation processes. The color index and the metallicity of the red giants along the thin disk shows no significant changes.
The measurements of the edge-on galaxy NGC 55 revealed a very small metallicity gradient. This is probably due to the fact that measurements were performed along the small axis of the galaxy, but not along the radius.
4.4 Surface density of AGB and RGB stars in galaxies.
Extended structures lacking young stars are being routinely discovered in nearby galaxies of different morphological types (e.g Grebel 1999; Lee et al. 1999; Drozdovsky et al. 2002, Schulte-Ladbeck et al. 2002, Tikhonov & Galazutdinova 2002). Using the method of star counts many interesting results have been obtained, but many of the parameters of these stellar populations are still not clear, such as their true spatial distribution, age and chemical parameters. The well studied Milky Way outskirts contain mostly old ( Gyr) low-metallicity stars. The radial scale length for the Galactic thick disk is significantly larger than that for the old/thin disk (Ojha 2001; Larsen & Humphreys 2003). A sharp border between thick disk and the halo is detected in the galaxy M 33 (Guillandre et al., 1998). However, the authors did not measure the density gradients of red giants in the thick disk and the halo. The surface distribution of various stellar population in M 31 (Sarajedini & van Duyne 2001; Ferguson et al. 2002) revealed that the stellar density as well as the mean metallicity vary along the galaxy radius. In Tikhonov (2002) we summarized results for 16 dwarf irregular galaxies to show that red giants form a thick disk around each galaxy. The size of such disk is 2-3 times larger than those of visible part of the galaxy (Tikhonov, 2002). We did not detect stars that belong to the galaxy beyond these disks. At the same time, our study of a more luminous irregular galaxy IC10 demonstrated that it has an extended disk (Tikhonov, 1999) and a more extended halo behind the sharp edge of this disk (Tikhonov, 2002; Drozdovsky et al., 2002).
In this paper, we analyze a set of three nearby spiral galaxies using the classical approach for the identification of thick disks and halos: the need for an additional disk component when attempting to fit single disk models to the stellar surface number density (Burstein 1979; Gilmore & Reid 1983; Pohlen 2002,2004; Larsen & Humphreys 2003). Having only archival data limited our ability to analyze the true extent of the outer stellar structures. Unable to plan the mapping of the the galaxy outskirts, we made an assumption of axial symmetry for the disk and halo components, ignoring possible tidal deformation. Since galaxies have an inclination to the line of sight, we calculated the distance from the investigated area to the galactic center with the following equation:
| (1) |
where is a projection of the seen distance from the investigated area to the galaxy center on the large galaxy axis, is the same projection on the small axis of the galaxy, and is the galaxy inclination angle to the line of site. In this way, deprojected radii for all fields of M 81 were calculated and the stellar surface number density profile was constructed. The stellar number density for the different population of stars was also corrected for the incompleteness of the sample as described in section 3.2.
4.4.1 M 81.
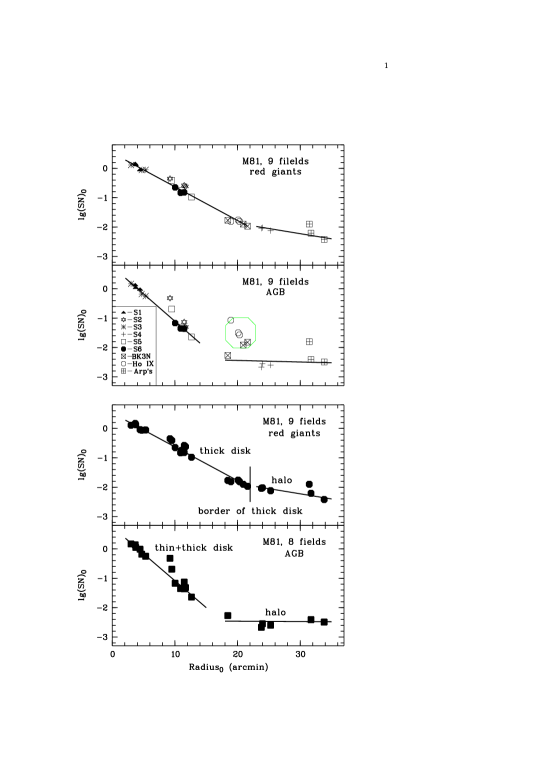
The HST/WFPC2 archive contains a plethora of data located at different areas around M 81, from the central spiral arms to the galaxy outskirts (see Figure 1). For the central fields, we avoided regions of intense star-formation by masking them out, since star counts become severely contaminated by young and intermediate-age stars, smearing the RGB “edges” in luminosity and color. On the basis of artificial star trials, we calculated the incompleteness fractions for all studied fields, and corrected the measured stellar number density for this effect. In Figure 6 (top), we present the results of completeness tests for the innermost and outermost fields, S3 and S4. For M 81 we used red giants in magnitude range as follows: and . For field S3, we found a sample completeness of 0.80 in I band and 0.35 in V band data. In the case of field S4, the completeness is 0.95 and 0.90, respectively. The AGB stars are brighter than RGB ones, making the incompleteness correction very small. To increase the statistical significance of the results, we estimated a mean number density of stars (AGB and RGB) for each of the three chips of WFPC2 (excluding the small FOV PC chip). The obtained results, presented in Figure 9, demonstrate an apparent drop of stellar number density along the galactocentric radius. This drop likely corresponds to the outer edge of the thick disk. There is also a difference in surface number density gradients between RGB and AGB stars: the relative fraction of RGB over AGB stars increases with galactocentric radius. The radius of the M 81 thick disk has been estimated as (see Fig. 9, bottom), which corresponds to 25 kpc. The available WFPC2 images do not reach the outer part of the M 81 stellar halo. The lower limit for the size of the halo radius is kpc. A similar extended stellar halo has been detected in M 31 (Ferguson et al., 2002) and NGC5128 (Harris et al., 1999). Some of the fields around M 81’s disk and halo are contaminated by the stellar populations of its dwarf satellite galaxies BK3N, Ho IX, and Arp’s ring. It causes an excess of surface number density above the average level at given galactocentric radius (Figure 9, top).
The CMDs of satellite dwarf galaxies BK3N and Ho IX (Figure 9) are rich in AGB stars, faint blue stars but the number density of more evolved stellar populations (RGB stars) is low, suggesting that BK3N and Ho IX might represent young tidal formations (Miller, 1995; Flynn et al., 1999; Boyce et al., 2001). The underdensity of the RGB stars make it impossible to determine distances on the basis of the TRGB method. The distance values obtained by Karachentsev et al. (2002) refer to halo and disk stars of M 81, but not to BK3N and Ho IX. In the field of the Arp’s ring both the AGB and RGB stars are apparent (Figure 9), providing a lower limit on its age, since RGB stars are at least a Gyr old. The detection of some blue stars in this field demonstrates the presence of low star formation in the ring.
4.4.2 NGC 300.
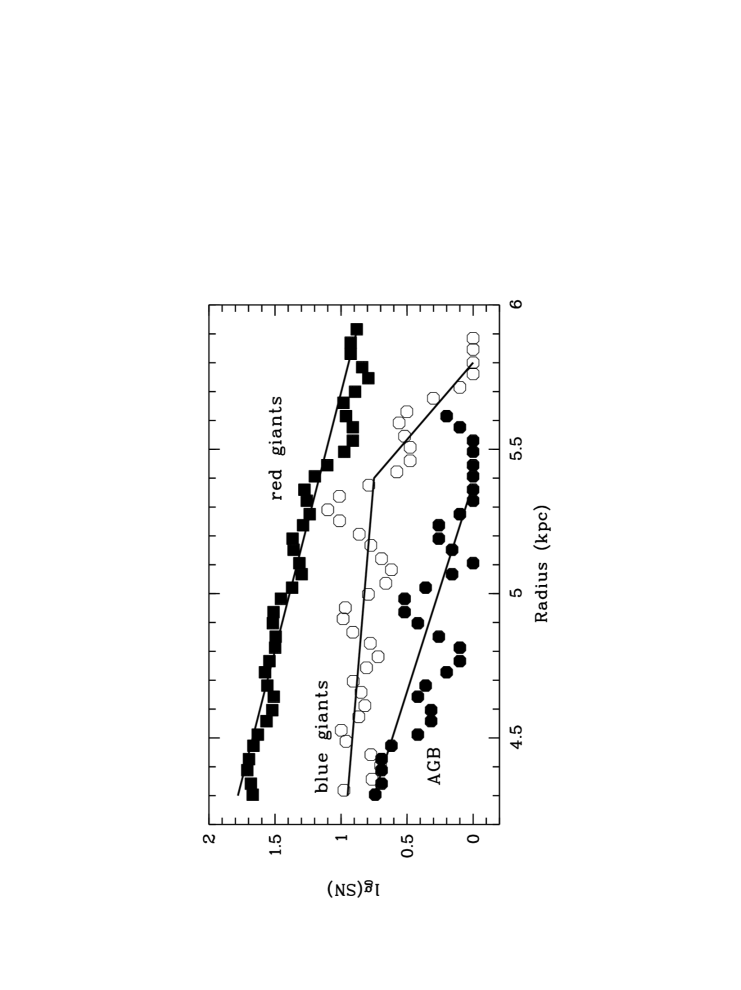
There are three WFPC2 fields in the HST archive, located nearly along the same galactocentric line, and six ACS/WFC fields (Figure 3). It is clear (Fig. 10) that the thick disk and the halo have different gradients of star surface density. As in the case of M81, the stellar surface density of the thick disk can be well fit by an exponential law. The thick disk of NGC 300 reveals a sharp edge, but it is impossible to determine the halo extent due to the lack of the HST data at larger galactocentric radius. As shown in Fig. 10, the NGC 300 stellar halo is at least twice the size of the thick disk. On the true-color picture of NGC 300 (MPG/ESO 2.2-m + WFI) a bluish disk with a sharp border on its outskirts can also be seen. All spiral arms are embedded in this disk. Usually the size of such disks is considered to be the visual size of the galaxy. Field S2 is situated on the edge of this bluish disk where all variations of stellar population can be studied. The number of blue stars (main sequence giants and supergiants) rapidly decreases at the edge of the thin disk to null (see Fig.11), as do AGB stars, but red giants (from the thick disk and halo) spread out further. The RGB stars soon show a significant drop in surface number, likely indicating the truncated edge of the thick disk, so the estimated ratio of the thick-to-thin disk diameters is just (Figure 11).
4.4.3 NGC 55.
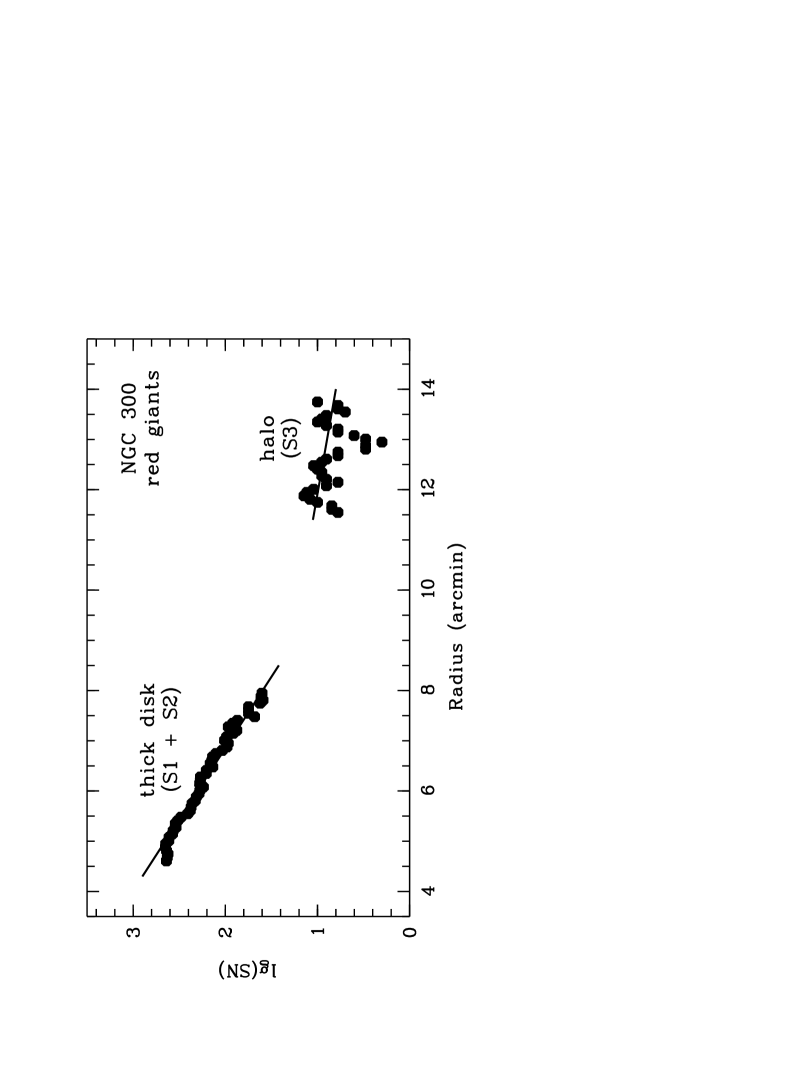
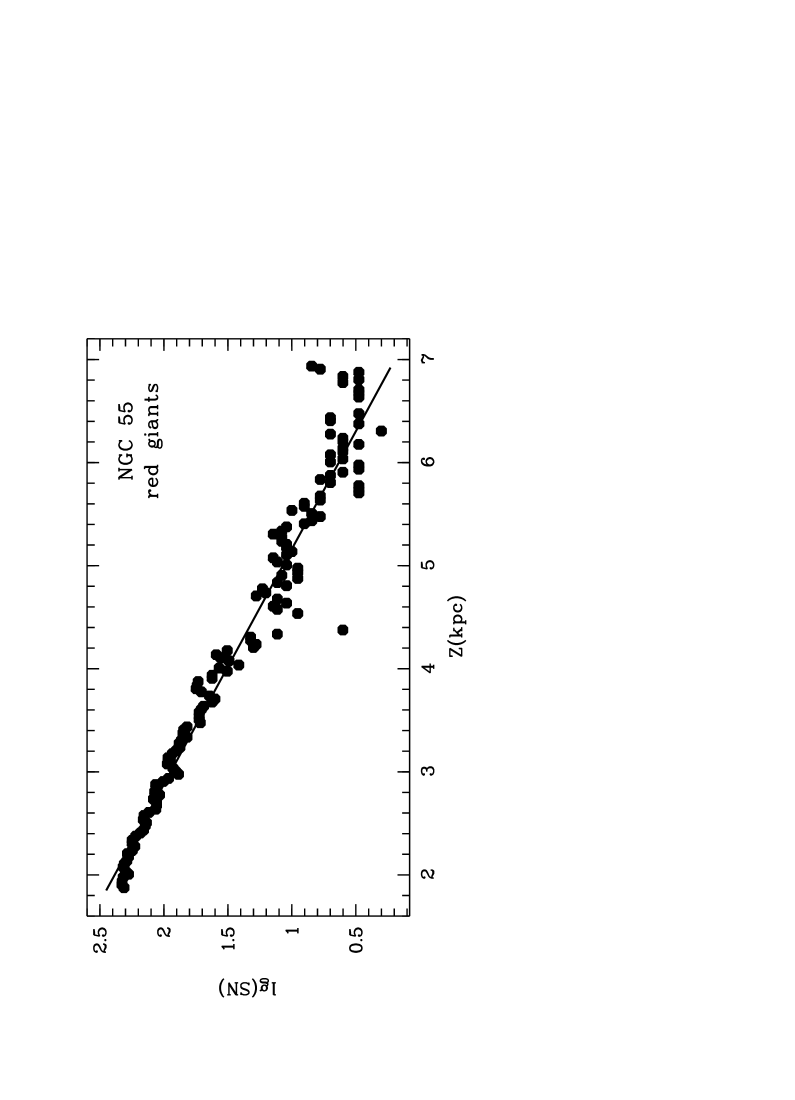
NGC 55 is an edge-on galaxy, allowing us to investigate its stellar density in the extraplanar Z-direction (perpendicularly to the plane of the disk). From the analysis of three fields, we determined the surface number density of the red giants in the range of extraplanar distances from 2 to 7 kpc (Figure 2). It was found that all three fields (S1, S2, S3), despite different galactocentric radii, show the same gradient in surface number density of RGB stars, suggesting that all the fields are located in the thick disk (Figure 2). At the same time, the surface number density distribution does not show a sharp thick disk edge at least untill kpc above the disk plane (Figure 12). Perhaps the deviation of density distribution from the straight line (fig.12) at 6.5 kpc corresponds to the transition from the disk to the halo. Thick disks of edge-on galaxies NGC 891, NGC 4244, IC 5052 have about the same thickness (Tikhonov et al. in preparation). To determine the true extent of the thick disk and to reveal the halo, additional observations are necessary. Using the average thick disk length-to-height ratio, , obtained from our study of Irregular galaxies (Tikhonov, 2002), and assigning a lower limit for the thick disk of kpc we estimate the length (planar extent) for the NGC 55 thick disk as kpc.
Similarly to M 81, the AGB stars of NGC 55 and NGC 300 show larger number density gradients relative to the RGB stars, and are almost absent in the galaxy outskirts. Due to the smaller statistics, the derived surface number density gradients of AGB stars are very uncertain for NGC 55 and NGC 300.
5 Discussion.
Relying on the star number counts in the spiral galaxies M 81, NGC 300 and NGC 55, we examine the spatial distribution of stars in their thick disks and halos. The emphasis in the current work is on the extended surroundings of the galaxies, out to typically a few kpc. The disks and halos of M 81 and NGC 300 have a similar structure, but differ in spatial sizes. While the thick disk in NGC 55 is apparent, we found only weak evidence for the presence of a stellar halo within 6 kpc of this galaxy.
Comparing the inferred parameters for the thin/thick disk and halo with other published results, we compose a scaled 3-D model of the stellar structures of a typical spiral galaxy (Figure 13). The extraplanar size (height or thickness) of the thin disk depends on the galaxy type (Ma, 2002). The height of the thin disk in M81, NGC 55 and NGC 300 spans a range of 0.7-1.5 kpc. The thick disk, as seen in NGC 55 (Fig.12), has thickness of 13 kpc, but the thick-to-thin disks diameter ratio is only . The same size ratio was observed in M 33 (Guillandre et al., 1998). By comparing the stellar structure of galaxies M 81 and NGC 300 with those of irregular galaxies (Tikhonov, 2002), we noticed that while spiral galaxies have a small thick-to-thin disks size ratio, irregular galaxies demonstrate much larger ratios, from 2.5 to 5. A very large RGB disk was found in the dwarf lenticular galaxy NGC 404 (Tikhonov et al., 2003). It is plausible that all spiral galaxies have not only a thick disk but also an extended halo, while dwarf irregular galaxies have only a thick disk. Knowing that bright irregular galaxy IC 10 has a thick disk and an extended halo (Drozdovsky et al. 2003), we suggest that in order to have a stellar halo a galaxy many need a mass above a certain limit. Combining this work with results obtained for the spiral edge-on galaxies NGC 891, NGC 4244 and IC 5052 (Tikhonov et al. in preparation), we also suggest that their halo might be well represented by an oblate ellipsoid (see Fig. 13). This elliptical shape may also explain the halo of spiral galaxy M 31 (Zucker et al., 2004). Relatively high values for the thick-to-thin disk thickness ratio, if confirmed with additional work, may imply an independent origin for the thick disk. In order to come to a statistically reliable conclusion, it will be necessary to study the stellar periphery of a larger set of galaxies with various masses. The addition of results from kinematic studies can be also used to refine the model of galactic stellar outskirts.
6 Summary.
The study of the outer stellar edges in galaxies remains difficult. However, the results presented here indicate that the pursuit of deep single-star photometry, followed by recovering the type of stars and their spatial distribution, might be successfully used to study galactic outskirts. The star count method allows us to trace the extended surroundings of the galaxies out to a few scale radii and to constrain their spatial geometry with high confidence, at sensitivities much below all other methods.
On the basis of this method, we have obtained the following major results:
a) The extended stellar thick disks and halos have been detected in M 81, NGC 300 and NGC 55.
b) There are clear differences between surface density gradients of the evolved stellar populations assigned to the thick disk and halo of these spiral galaxies, which allowed us to detect the edge of the thick disk.
c) Having a large dataset allowed us to estimate the distances to the galaxies with the TRGB method with high statistical confidence. We determine a distance of Mpc for M 81, Mpc for NGC 55 and Mpc for NGC 300, and a mean stellar metallicity of 0.65, 1.25, and 0.87.
d) There are clear differences in color distributions of the RGB stars, indicating plausible metallicity gradients in the thick disk and halo of the studied galaxies.
Large statistical studies of this kind are crucial to understand the morphology of nearby galaxies. It is necessary to have a homogeneous dataset, obtained with the same equipment and uniformly analyzed. The HST/WFPC2/ACS Archive contains deep homogeneous datasets with unparalleled resolution that provide a unique way to analyze the physical characteristics of the shapes of galaxies with a high degree of confidence.
Our study would provide essential new input for theoretical models (as currently, our understanding of the three-dimensional structure of spirals is limited by central high-surface brightness disks), and may be relevant for the origin of dark matter in these galaxies, as well as evolution of the galaxies. We view this archival study as part of a larger research project, involving followup ground based multi-object spectroscopy and wide-field imaging.
Acknowledgements.
The authors would like to thank to the Russian Foundation for Basic Research for financial support under the grant 03-02-16344. Data from the NASA/IPAC Extragalactic Database have been used.References
- Aparicio (2003) Aparicio, A. 2003, astro-ph/0310766
- (2) Appleton P.N., Davies R.D., Stephenson R.J., 1981, MNRAS 195, 327
- (3) Baggett W.E., Baggett S.M., Anderson K.S.J., 1998, AJ 116, 1626
- (4) Barnes J.E. & Hernquist L., 1992, Nature 360, 715
- (5) Bellazzini M., Cacciari C., Federici L., Fuci Pecci F., Rich M. , 2003, A&A 405, 867
- (6) Boyce P. J., Minchin R. F., Kilborn V. A., Disney M. J., Lang R. H., Jordan C. A., Grossi M., Lyne A. G., Cohen R. J., Morison I. M., Phillipps S., 2001, ApJ 560L, 127
- (7) Börngen F., Karachentseva V. E., Schmidt R., Richter G. M., Thaenert W., 1982, AN 303, 287
- (8) Börngen F., Karachentseva V. E., Karachentsev I. D., 1984, AN 305, 53
- (9) Bresolin F., Gieren W., Kudritzki R.-P., Pietrzynski G., Przybilla N., 2002, ApJ 567, 277
- (10) Brewer M.-M., Carney B.W., 2004, PASA, 21, 134
- (11) Brewer J., Richer H., Crabtree D., 1995, AJ 109, 2480
- (12) Brown T.M., Ferguson H.C., Smith Ed., Kimble R.A., Sweigart A.V., Renzini A., Rich R.M., VandenBerg D. A., 2003, ApJ 592, L1
- (13) Brown T.M., Ferguson H.C., Smith E., Kimble R. ., Sweigart A.V., Renzini A., Rich R.M., 2004, AJ 127, 2738
- (14) Bullock J.S., Kravtsov A.V., Weiberg D.H., 2001, ApJ 548 ,33
- (15) Burkert A., Truran J. W., Hensler G., 1992, ApJ 391, 651
- (16) Burstein, D., 1979, ApJ, 234, 829
- (17) Butler D. J., Martínez-Delgado, D. and Brandner, W., 2004, AJ 127, 1472
- (18) Byun Y.I. & Freeman K.C., 1995, ApJ 448, 563
- (19) Caldwell N., Armandroff T.E., Da Costa G.S., Seitzer P., 1998, AJ 115, 535
- (20) Carney B.W., Latham D.W., & Laird J.B., 1989, AJ 97, 423
- (21) Chiba M. & Beers T.C., 2000, AJ 119, 2843
- (22) Cote S., Freeman K., Carignan C., Quinn P., 1997, AJ 114, 1313
- (23) Dalcanton J.J. & Bernstein R.A., 2002, AJ 124, 1328
- (24) Deeg H.J., Munoz-Tunon C., Tenorio-Tagle G., Telles E., Vilchez J. M., Rodriguez-Espinosa J. M., Duc P. A., Mirabel I. F., 1998, A&AS 129, 455
- (25) Drozdovsky I., Tikhonov N., Schulte-Ladbeck R., ”The outer stellar edges of irregular galaxies: IC10 and LeoA”, 2003, STScI May 2003 Symposium
- (26) Drozdovsky I., Schulte-Ladbeck R., Tikhonov N., ”The outer edges of dwarf irregular galaxies: stars and gas”, 10-11 October, 2002, Lowel Workshop
- (27) Duc P.-A., Mirabel I.F., 1998, A&A 333, 813
- (28) Eggen O.J., Lynden-Bell D. & Sandage A.R., 1962, ApJ 136, 748
- (29) Elmegreen B.G., Kaufman M., Thomasson M., 1993, ApJ 412, 90
- (30) Engelbracht C. W., MIPS Science Team, SINGS Team, 2004, AAS 204, 3311
- (31) Ferguson A. M. N. & Johnson R.A., 2001, ApJ 559L, 13
- (32) Ferguson A. M. N., Irein M. J., Ibata R.A., Lewis G.F., Tanvir N. R., 2002, AJ 124, 1452
- (33) Friel E.D. & Janes A., 1993, A&A 267, 75
- (34) Flynn L., Walterlos R.A.M., Thilker D.A., Fierro V., 1999, 5-9 January, AAS Meeting 193 - Austin, Texas
- (35) Freedman W.L., Madore B.F., Hawley, S. L.; Horowitz I. K., Mould J., Navarrete M., Sallmen S., 1992, ApJ 396, 80
- (36) Freedman W.L., Hughes S.M., Madore B.F., 1994, ApJ 427, 628
- (37) Freedman W.L., Madore B. F., Gibson B. K., Ferrarese L., et al. 2001, ApJ 553, 47
- (38) Georgiev Ts. B., Bilkina B.I., Tikhonov N.A., 1992, A&AS 95, 581
- (39) Georgiev Ts. B., Bilkina B.I., Tikhonov N.A., 1992, A&AS 96, 569
- (40) Geisler D., 2000, AJ 119, 760
- (41) Gilmore G., & Wyse R.F.G., 1985, AJ 90, 2015
- (42) Gilmore G., Wyse R.F.G., & Norris J., 2002, ApJ 574, L39
- (43) Graham J.A., 1982, ApJ 252, 474
- (44) Graham J.A., 1984, AJ 89, 1332
- (45) Guillandre J., Lequeux J., Loinard L., 1998 in IAU Symp. 192, The Stellar content of Local Group Galaxies, ed. Whitelock P., Cannon R., 27
- (46) Harris W.E. & Harris G. L. H., 2001, AJ 122, 3065
- (47) Harris G., Harris W., Poole G., 1999, AJ 117, 855
- (48) Holtzmann J.A., Hester J.J., Casertano S., 1995a, PASP 107, 156
- (49) Holtzmann J.A., Burrows C.J., Casertano S., Hester J.J., Trauger J.T., Watson A.M., & Worthey G., 1995b, PASP 107, 1065
- (50) Hunsberger S.D., Chareton J.C., Zaritsky D., 1996, ApJ 462, 50
- (51) Harris W. E., Harris G.L.H., 2001, AJ 122, 3065
- (52) Jerjen H., Binggeli B., Freeman K., 2000, AJ 119, 593
- (53) Ibata R.A., Gilmore G., Irwin M.J., 1995, MNRAS 277, 781
- (54) Karachentsev I. D., Dolphin A. E., Geisler D., Grebel E. K., Guhathakurta P., Hodge P. W., Karachentseva V. E., Sarajedini A., Seitzer P., Sharina M. E., 2002, A&A 383, 125
- (55) Karachentseva V. E., Karachentsev I. D., Boerngen F., 1985, A&AS 60, 213
- (56) Kent S.M., 1985, ApJS 59, 115
- (57) Kim M., Kim E., Lee M. G., Sarajedini A., Geisler D., 2002, AJ 123, 244
- (58) Kiszkurno-Koziej E., 1988, A&A 196, 26
- (59) Kroupa P., 2002, MNRAS 330, 707
- (60) Larsen J.A. & Humphreys R.M., 2003, AJ, 125, 1958
- (61) Lee M.G., Freedman W.L., Madore B.F., 1993, AJ 417, 553
- (62) Lee M.G., Kim M., Sarajedini A., Geisler D., Gieren W., 2002, ApJ 565, 959
- (63) Ma J., 2002, A&A 388, 389
- (64) Mackey A.D., Gilmore G.F., 2004, MNRAS 352, 153
- (65) Makarova L. N., Grebel E. K., Karachentsev I. D., Dolphin A. E., Karachentseva V. E., Sharina M. E., Geisler D., Guhathakurta P., Hodge P. W., Sarajedini A., Seitzer P., 2002, A&A 396, 473
- (66) Márquez I., Masegosa J., Moles M., Varela J., Bettoni D., & Galletta, G., 2002, A&A, 393, 389
- (67) Miller B.W., 1995, BAAS 185, 1365
- (68) Ojha D. K., 2001, MNRAS, 322, 426O
- (69) Oshima T., Mitsuda K., Ota N., Yamasaki N., 2002, The 8th IAU Asian-Pacific Regional Meeting, July 2-5, 2002, Tokyo, Japan, 287
- (70) Otte B. & Dettmar R.-J., 1999, A&A 343, 705O
- (71) Papaderos P., Izotov Y. I., Noeske K. G., Cairós L. M., Guseva N. G., Thuan T. X., & Fricke K. J., 2003, Ap&SS, 284, 619
- (72) Pierre M. & Azzopardi M., 1988, A&A 189, 27
- (73) Pohlen M., Dettmar R.-J., Lütticke R., & Aronica, G., 2002, A&A, 392, 807
- (74) Pohlen M., Balcells M., Lütticke R., & Dettmar, R.-J., 2004, A&A, 422, 465
- (75) Prieto M., Aguerri J. A. L., Varela A. M., Munoz-Tunon C., 2001, A&A 367, 405
- (76) Pritchet C. J., Schade D., Richer H. B., Crabtree D., Yee H. K. C. 1987, ApJ 323, 79
- (77) Pritchet C.J. and van den Bergh S., 1988, ApJ 331, 135
- (78) Prochaska J.X., Naumov S. O., Carney B. W., McWilliam A., Wolfe A. M., 2000, AJ 120, 2513
- (79) Puche D., Carignan C., Bosma A., 1990, AJ 100, 1468
- (80) Puche D., Carignan C., Wainscoat R. J., 1991, AJ 101, 447
- (81) Reitzel D.B. & Guhathakurta P., 2002, AJ 124, 234
- (82) Rogstad D.H., Crutcher R.M. and Chu K., 1979, ApJ 229,509
- (83) Rolleston W.R.J., Smart S.J., Dufton P.L., Ryans R.S.I., 2000, A&A 363, 537
- (84) Sakai S. & Madore B., 2001, ApJ 555, 280
- (85) Sarajedini A., Geisler D., Schommer R., Harding P., 2000, AJ 120, 2437
- (86) Sarajedini A. & Van Duyne J., 2001, AJ 122, 2444
- (87) Searle L., Zinn R., 1978, ApJ 225,357
- (88) Shaver P.A., McGee R.X., Danks A.C., Pottasch S.R., 1983, MNRAS 204, 53
- (89) Schlegel D. J., Finkbeiner D.P.; Davis M., 1998, ApJ 500, 525
- (90) Stetson, P.B. 1994, Users Manual for DAOPHOT II
- (91) Tenjes P., Haud U., Einasto J., 1998, A&A 335, 449
- (92) Tikhonov N.A., 1999, IAUS, 192, 244
- (93) Tikhonov N.A., 2002, Dissertation, St-Petersburg State University, Russia
- (94) Tikhonov N.A., Galazutdinova O.A., Aparicio A., 2003, A&A 401, 863
- (95) Vallenari A., Bertelli G., Schmidtobreick L., 2000, A&A 361, 73
- (96) Venn K.A., Irwin M., Shetrone M.D., Tout C.A., Hill V., Tolstoy E., astro-ph/0406120
- (97) van der Hulst J.N., 1978, in Structure and Properties of Nearby Galaxies, IAU Symp., No.77, (Reidel, Dordrecht and Boston), 269
- (98) van der Marel R.P. 2001, astro-ph/0107248
- (99) Weilbacher P.M., 2002, PhD Dissertation, Notingen
- (100) Westpfahl D. J., Coleman P. H., Alexander J., Tongue T., 1999, AJ 117, 868
- (101) Williams B.F., 2002, MNRAS 331, 293
- (102) Yun M.S., Ho P.T.P., Lo K.Y., 1994, Nature 372, 530
- (103) Zickgraf F.-J., Humphreys R. M., Sitko M. L., Manley T., 1990, PASP 102, 925
- (104) Zoccali M., Renzini A., Ortolani S., Greggio L., Saviane I. , Cassisi S., Rejkuba M. , Barbuy B., Rich R.M., Bica E., 2002, astro-ph/0210660
- (105) Zucker D.B., Kniazev A.Y., Bell E.F., Martinez-Delgado D., Grebel E.K., Rix H.-W., Rockosi C.M., Holtzman J.A., Walterbos R.A.M., Ivezic Z., Brinkmann J., Brewington H., Harvanek M., Kleinman S.J., Krzesinski J., Long D., Newman P.R., Nitta A., Snedden S.A., 2004, astro-ph/0401098
| Galaxy | NGC 55 | NGC 300 | M 81 |
|---|---|---|---|
| RA (J2000) | |||
| DEC (J2000) | |||
| Morphological type | SB(s)m:sp | SA(s)d | SA(s)ab:LINER Sy1.8 |
| Helio radial velocity (km/s) | |||
| Diameter (arcmin) | |||
| Magnitude | 884 | 895 | 789 |
| 0044 | 0042 | 0266 | |
| 0026 | 0025 | 0155 | |
| Inclination |
The Galactic extinction correction is by Schlegel et al.(1998).
The inclination is taken from LEDA.
| Galaxy | Region | Date | Band | R | Exposure | ID | Nstars |
|---|---|---|---|---|---|---|---|
| M 81 | S1 | 17.04.1998 | F814w | 2.96 | 1000+1200 | 7909 | 18164 |
| F606w | 2.96 | 21000 | 7909 | ||||
| S2 | 26.01.1999 | F814w | 5.18 | 31500 | 8059 | 22933 | |
| F606w | 5.18 | 51500 | 8059 | ||||
| S3 | 4.06.2001 | F814w | 3.47 | 4500 | 9073 | 19143 | |
| F555w | 3.47 | 4500 | 9073 | ||||
| S4 | 30.06.2001 | F814w | 12.78 | 31400 | 9086 | 1611 | |
| F606w | 12.78 | 41300 | 9086 | ||||
| S5 | 1.09.2001 | F814w | 6.09 | 21100 | 8584 | 10150 | |
| F555w | 6.09 | 21100 | 8584 | ||||
| S6 | 28.05.2002 | F814w | 9.52 | 800 | 9634 | 7810 | |
| F606w | 9.52 | 2500 | 9634 | ||||
| BK3N | 29.08.2000 | F814w | 10.87 | 600 | 8061 | 519 | |
| F606w | 10.87 | 600 | 8061 | ||||
| Ho IX | 27.06.2001 | F814w | 11.39 | 600 | 8061 | 3655 | |
| F606w | 11.39 | 600 | 8061 | ||||
| Arp’s | 30.07.2000 | F814w | 17.61 | 600 | 8061 | 956 | |
| loop | F606w | 17.61 | 600 | 8061 | |||
| NGC 300 | S1 | 13.09.2001 | F814w | 7.12 | 2500 | 8584 | 4387 |
| F555w | 7.12 | 2500 | 8584 | ||||
| S2 | 02.07.2001 | F814w | 5.99 | 2300 | 9162 | 12004 | |
| F606w | 5.99 | 2300 | 9162 | ||||
| S3 | 20.06.2001 | F814w | 12.83 | 4500 | 9086 | 2520 | |
| F606w | 12.83 | 4500 | 9086 | ||||
| F1 | 17.07.2002 | F555w | 8.05 | 1080 | 9492 | 89615 | |
| F814w | 8.05 | 1080 | 9492 | ||||
| F2 | 19.07.2002 | F555w | 2.07 | 1080 | 9492 | 182106 | |
| F814w | 2.07 | 1080 | 9492 | ||||
| F3 | 28.09.2002 | F555w | 0.91 | 1080 | 9492 | 191107 | |
| F814w | 0.91 | 1080 | 9492 | ||||
| F4 | 21.07.2002 | F555w | 8.97 | 1080 | 9492 | 53494 | |
| F814w | 8.97 | 1080 | 9492 | ||||
| F5 | 25.12.2002 | F555w | 5.45 | 1080 | 9492 | 128370 | |
| F814w | 5.45 | 1080 | 9492 | ||||
| F6 | 26.09.2002 | F555w | 6.15 | 1080 | 9492 | 68730 | |
| F814w | 6.15 | 1080 | 9492 | ||||
| NGC 55 | S1 | 13.06.2001 | F814w | 8.00 | 4500 | 9086 | 832 |
| F606w | 8.00 | 4500 | 9086 | ||||
| S2 | 15.06.2000 | F814w | 3.59 | 2800+900 | 8697 | 5654 | |
| F555w | 3.59 | 3800 | 8697 | ||||
| S3 | 10.06.2000 | F814w | 8.97 | 2800+900 | 8697 | 10532 | |
| F555w | 8.97 | 3800 | 8697 |