NGC7538 IRS1 N:
modeling a circumstellar maser disk
Abstract
We present an edge-on Keplerian disk model to explain the main component of the 12.2 and 6.7 GHz methanol maser emission detected toward NGC7538-IRS1 N . The brightness distribution and spectrum of the line of bright masers are successfully modeled with high amplification of background radio continuum emission along velocity coherent paths through a maser disk. The bend seen in the position-velocity diagram is a characteristic signature of differentially rotating disks. For a central mass of 30, suggested by other observations, our model fixes the masing disk to have inner and outer radii of AU and AU.
keywords:
Masers – Star FormationAppl. Opt.
Kluwer Prepress Department
P.O. Box 990
3300 AZ Dordrecht
The Netherlands
1 Introduction: disks in high-mass star formation regions
Disks are expected to form during protostellar collapse, and low-mass stars seem to provide good observational evidence for the existence of disks (e.g. \openciteqi03; \opencitefue03). The situation is less clear for high-mass stars. While in several cases velocity gradients in massive star forming regions have been detected on large scales (AU, e.g. \opencitesan03), evidence for compact disks on scales AU remains sparse. One possible example is IRAS20126+4104, studied by \inlineciteces99.
Class II methanol maser emission, a signpost of high mass star formation [Minier et al. (2001)], offers a potential indicator of disks since it often shows linear structures both in space and position – velocity diagrams (\opencitenor98; \opencitemin00a). One of the most striking examples of a maser line in both space and velocity is found in NGC7538-IRS1 N (\opencitemin98). We present here the first quantitative Keplerian disk analysis of this maser without invoking the assumption of a single radius. We find compelling evidence for the disk interpretation in this case.
2 Basic theory of the model and fit to the data
Because of the remarkable agreement of the positions of the maser emissions at 6.7 and 12.2 GHz (2–3 mas), we draw the conclusion that the maser is the result of the amplification of a background continuum. Consider than an edge-on rotating disk at a distance from the Sun and a point at radius along a path with displacement . The rotation velocity and its line-of-sight component obey , the angular velocity. In Keplerian rotation with where is the outer radius and the central mass. Assume a Gaussian frequency profile for the maser absorption coefficient and denote the radial variation of its magnitude at line center by the normalized profile (). Then
| (1) |
where and is distance along the path. The width is taken as constant and we set it to be the spectral line width of the maser emission at 12.2 GHz at . In our case = 0.4 km s-1. This value could vary with because of temperature variation and maser saturation. Saturation typically requires 10–15 across the disk radius, and the broadening of the absorption profile is then proportional to length in excess of this threshold (\openciteeli92c). The saturation issue is not treated in this study.
By comparing the maser brightness temperature at with of the background continuum (10000 – 15000 K, \opencitecam84) we find that and 15.99 for the 6.7 and 12.2 GHz masers respectively. We parameterize the function as and set , being the value that gives the best fits. The adopted distance to the source is 2.7 kpc.
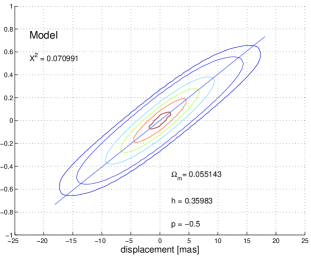
Fitting. The free parameters in the fit are the angular velocity and the ratio between inner and outer radii, . We define , i.e. the mean of angular velocities at the inner and outer radii, as the angular velocity measured in the data (see straight slope in Figure 3). Because of the natural scalefreeness of the model, we have to give an estimate for the scale of the disk, e.g. the outer radius. We choose a value which corresponds to a central mass of 30 , relying on previous estimates in NGC7538-IRS1 N (e.g. \opencitecam84). It is to notice however that the model can produce equivalently good fits when this estimate is not taken into account. The model shows a lower limit at disk sizes corresponding to central objects of subsolar masses. It still performs well when setting the central object to 100 , although then the outliers at 6.7 GHz cannot be part of the disk.
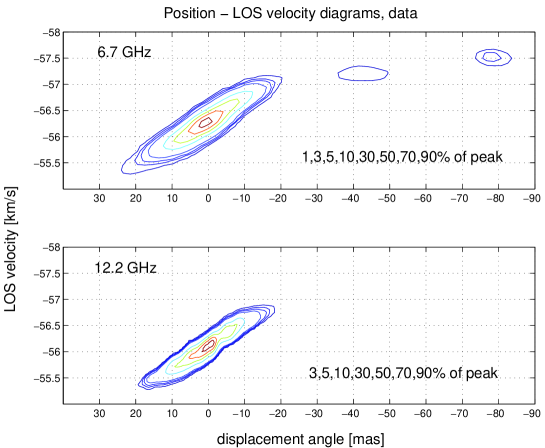
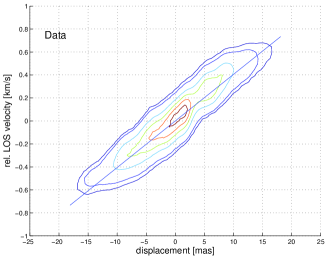
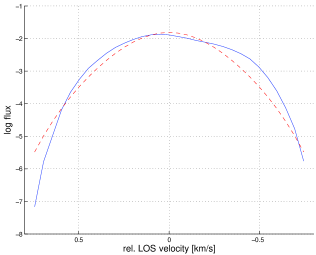
We fit the position – velocity diagram of the 12.2 and 6.7 GHz methanol maser data observed using VLBI (the latter without outliers, see Figure 1). The 12.2 GHz data fit is considered the reference fit because of the higher spatial resolution in the data.
The kink. The most important dynamical feature of the model is surely the bend in angular velocity appearing at mas, visible only in the position – velocity data at 12.2 GHz. This is naturally reproduced by our model and it can be explained in the following way. When the coherence path participating to the maser extends over the entire disk, leading to the highest and so the brightest maser emission. When increasing the displacement above , the longest coherence path will be centered at velocities closer to the outer edge of the disk, making the increase in angular velocity with displacement angle (or velocity gradient) less pronounced. This will produce a clear bend in the line tracing the maximum optical depth at every value of . The value for gets smaller and the bend stronger the smaller or the smaller . The presence of the bend is a unique signature for a differentially rotating disk (e.g. a Keplerian disk as the one we model here), since a solid-body rotation would show a linear velocity gradient. We consider the independent observation of the bend in data and model to be the most compelling evidence for a circumstellar rotating disk in NGC7538-IRS1 N .
Because of the high requirements in sensitivity and spatial resolution, as well as on the smooth distribution of the masing material in the disk, this bend was not seen when modeling the H2O maser disk in NGC4258 (\opencitewat94). It has been detected in thermal line observations and modeled with the help of multiple dynamical components (e.g. \opencitebel02). Our modeling confirms that there is no need for multiple dynamical components when trying to fit the bend.
3 Results
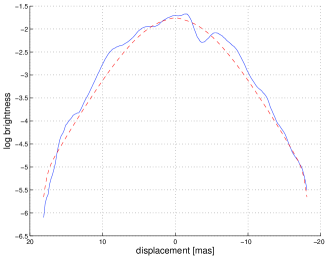
The results of the fitting of the 12.2 GHz maser data is shown in the figures 2 and 3, and . These values correspond to a disk where the masing methanol is confined between 270 and 750 AU from the central protostar, which has a mass of 30 . The model can reproduce with high accuracy both the brightness profile and the spectrum of the maser emission as well as the indications for a bend in the velocity gradient. The fitting of the 6.7 GHz data gave similar results, i.e. and . Following the line of maximum in the position – velocity diagram in the adopted model we can consider the outliers at 6.7 GHz to be part of the disk.
4 Final remarks
The present study has produced the up to date most accurate model of a circumstellar disk traced by maser emission at small scales ( AU) around a massive protostar. NGC7538-IRS1 N seems to be a special case, where the masing material appears to be distributed extremely smoothly in the disk and not to be particularly turbulent.
The existence of the outliers in the 6.7 GHz data however indicates that the disk might have a more clumpy structure when approaching the outer edge: the gravitational potential being weaker it is possible to imagine the disk to get disrupted giving rise to local random enhancements of the optical depth offering suitable conditions for maser amplification. In fact the outliers seem to be very close to the line of highest optical depth in an edge-on disk predicted by our model.
A further issue is to decide whether the background continuum amplified by the inverted methanol in the disk comes from the known UCHII region in NGC7538-IRS1 N and illuminates the entire disk or from the central object solely. The latter case seems to be in accordance with photoevaporation studies, where the radio continuum would be responsible for both the methanol injection into the gas phase and the detected radio continuum outflow (\opencitehol94). At the moment it is not possible to discriminate both scenarios.
Finally it is important to notice that the present study of maser emission does not differ very much from more frequent studies of (optically thin) thermal line emission. Once taken the logarithm of the maser brightness map the problem reduces to the study of the value of the optical depth , which is exactly the same as in the case of thermal emission. The advantage of maser emission is the possibility to achieve high spatial resolution and get information about the dynamics at very small scales (e.g. 1 AU at 1 kpc).
Acknowledgements.
M. Pestalozzi thanks R. Parra for the Matlab tricks. We acknowledge A. Jerkstrand for spotting a mistake in the original fitting program. The 12 GHz data cube was kindly made available by V. Minier.References
- Belloche et al. (2002) Belloche, A., P. André, D. Despois, and S. Blinder: 2002. A&A 393, 927.
- Campbell (1984) Campbell, B.: 1984. ApJ 282, L27.
- Cesaroni et al. (1999) Cesaroni, R., M. Felli, T. Jenness, L. Neri, L. Olmi, M. Robberto, L. Testi, and C. Walmsley: 1999. A&A 345, 949.
- Elitzur (1992) Elitzur, M.: 1992. ARA&A 30, 75.
- Fuente et al. (2003) Fuente, A., A. Rodriguez-Franco, L. Testi, A. Natta, R. Bachiller, and N. R.: 2003. ApJL 598, L153.
- Hollenbach et al. (1994) Hollenbach, D., D. Johnstone, S. Lizano, and F. Shu: 1994. ApJ 428, 654.
- Minier et al. (1998) Minier, V., R. Booth, and J. Conway: 1998. A&A 336, L5.
- Minier et al. (2000) Minier, V., R. Booth, and J. Conway: 2000. A&A 362, 1093.
- Minier et al. (2001) Minier, V., J. Conway, and R. Booth: 2001. A&A 369, 278.
- Norris et al. (1998) Norris, R., S. Byleveld, P. Diamond, and co authors: 1998. ApJ 508, 275.
- Qi et al. (2003) Qi, C., J. Kessler, D. Koerner, A. Sargent, and G. Blake: 2003. ApJ 597, 986.
- Sandel et al. (2003) Sandel, G., M. Wright, and J. Forster: 2003. ApJ 590, L45.
- Watson and Wallin (1994) Watson, W. and B. Wallin: 1994. ApJ 432, L35.