Molecules in bipolar proto-planetary nebulae ††thanks: Figures 9-11 are only available in electronic form via http://www.edpsciences.org
Two bipolar proto-planetary nebulae, IRAS16594-4656 and IRAS17150-3224, have been detected in various molecular lines, namely CO, 13CO, HCN and CN, and remain undetected in several other species. CO(=2-1) and CO(=3-2) line profiles are compared to new spectra of similar PPN candidates, previously undetected in CO(=2-1): CPD-53°5736, IRAS17106-3046, IRAS17245-3951 and IRAS17441-2411. CO(=2-1) maps of IRAS16594-4656 and IRAS17150-3224 show that both PPNe have little separation between blue, centre and red-shifted emission, and also that the CO(=2-1) emission is of a similar size to the telescope beam. Fractional abundances of all detected molecules (except CO) are calculated using the results of CO line modelling and a simple photodissociation model. For those species not detected, upper limits are derived. Comparisons between these fractional abundances and those of other PPNe show that IRAS16594-4656 and IRAS17150-3224 are quite under-abundant when compared to molecule-rich sources like CRL618, CRL2688 and OH231.8+4.2. As a reason for this deficit, the difference in circumstellar envelope/torus density between the molecule-rich sources and the molecule-poor sources is proposed, and supported by a chemical model which follows the transition of a circumstellar envelope through the AGB phase and into the PPN phase of evolution. The model includes the effects of UV radiation, cosmic rays and also X-rays. Finally, the post-AGB ages of these two objects ( yr) are estimated using CN/HCN and HCN/CO ratios and both ages are found to be in agreement with previous figures cited in the literature, IRAS17150-3224 being the younger of the two PPNe.
Key Words.:
Astrochemistry – Stars: AGB and post-AGB – Stars: carbon – circumstellar matter – Stars: individual: IRAS16594-4656 – Stars: individual: IRAS17150-32241 Introduction
The proto-planetary stage of evolution is one of the shortest in a star’s lifetime and this implies a scarcity of observable examples. Following the method of Olivier et al. (2001), the number surface density of proto-planetary nebulae can be estimated to be (0.41) kpc-2. In comparsion, the density of AGB stars is 15 kpc-2 and of Main Sequence stars is 2106 kpc-2 (Olivier et al. 2001). Hence knowledge about this phase is limited. Most of the current understanding of PPNe is derived from a handful of objects; mainly the carbon-rich sources CRL618 and CRL2688 and the oxygen-rich object OH231.8+4.2. All three show strong molecular lines, have axisymmetric structures and molecular tori or disks. However, several hundred PPNe candidates have been identified (see Kwok 1993, and references therein), some 34 are reasonably well identified as PPNe (Bujarrabal et al. 2001), and yet only a handful show such molecular “richness”. The reason for this difference is far from clear.
Many optical and infrared HST images have helped in the study of PPNe (e.g., see Su et al. 2001; Hrivnak et al. 2001, 1999; Kwok et al. 1998, for details on the two PPNe described here), although the depth to which many of the objects discovered have been studied is minimal. Both molecule-rich PPNe and molecule-poor PPNe appear similar in images – the three PPNe mentioned above and both IRAS16594-4656 and IRAS17150-3224 have some degree of bipolarity, and a narrow waist. The beginnings of this bipolarity are found in the late AGB phase, where the first signs of asphericity are seen (e.g., Kastner & Weintraub 1994). The shaping of the nebula continues under the influence of a fast superwind, according to the Generalized Interacting Stellar Wind (GISW) model (Balick 1987). Other effects then play a part in the developing morphology (see the review by Balick & Frank 2002), and one which may be important is the inertial confinement of the outflowing wind by a circumstellar torus or disk (Calvet & Peimbert 1983). The degree of collimation produced by this disk would depend on the mass of the disk, as well as the momentum involved in the high-speed outflow, and other, geometrical effects. This change in morphology, from something approximately spherical to something bipolar, or elliptical, occurs very rapidly at the end of the AGB phase of evolution (e.g., Kwok et al. 1996; Schmidt et al. 2002). The actual period of transition is hard to quantify, and there are inherent difficulties in estimates by dynamical means (Zijlstra et al. 2001).
In this paper, two objects which have been imaged by the HST and show strong CO emission are studied. Both objects, IRAS16594-4656 and IRAS17150-3224 are only detected in a handful of species, including HCN and CO. These are compared to other PPNe newly observed in HCN and CO - CPD-53°5736, IRAS17106-3046, IRAS17245-3951 and IRAS17441-2411 (Sect. 4). Furthermore, the molecular properties of these two PPNe are studied by calculating fractional abundances from SEST data, and comparing with similar objects (Sects. 6.2.1 & 7). The comparative under-abundance of molecules of IRAS16594-4656 and 17150-3224 is discussed in Sect. 7, and arising hypotheses are confirmed by means of a chemical model (Sect. 6.3). Finally, individual spectra are presented in Appendix A, which is only available in electronic form.
2 Observations
| IRAS No. | Other name | J2000 Co-ords. | vLSR | |
|---|---|---|---|---|
| [h:m:s] | [°:′:″] | [km s-1] | ||
| 14488-5405 | CPD-53°5736 | 14:52:28.7 | 54:17:43 | |
| 16594-4656 | — | 17:03:09.7 | 47:00:28 | |
| 17106-3046 | — | 17:13:51.7 | 30:49:40 | |
| 17150-3224 | AFGL6815S | 17:18:20.0 | 32:27:20 | |
| 17245-3951 | OH348.8-2.8 | 17:28:04.8 | 39:53:44 | |
| 17441-2411 | AFGL5385 | 17:47:10.3 | 24:12:54 | |
| Frequency | FWHM | |
|---|---|---|
| [GHz] | [] | |
| 86 | 57 | 0.75 |
| 100 | 51 | 0.73 |
| 115 | 45 | 0.70 |
| 147 | 34 | 0.66 |
| 230 | 23 | 0.50 |
| 265 | 21 | 0.42 |
| 345 | 15 | 0.25 |
The observations were carried out between 1998 and 2002 with the Swedish-ESO Submillimetre Telescope (SEST), situated on La Silla, Chile. SIS receivers were used at 0.8, 1.3, 2 and 3 mm. During this period the SEST operated three acousto-optical spectrometers: one high resolution spectrometer, with a bandwidth of 86 MHz and a channel separation of 43 kHz, and two wideband spectrometers with bandwidths of about 1 GHz and a channel separation of 0.7 MHz. Typical system temperatures above the atmosphere ranged between 150 and 800 K, depending on frequency and elevation.
Most observations were carried out with the dual beam switching method which gives very flat baselines by placing the source alternately in two beams. Beam separation was 115 in azimuth. CO maps of IRAS17150-3224 were taken using the position switching method, to minimise interference from interstellar CO emission lines. The OFF position was chosen to be (-10′, -11′) from the ON position. Map spacing in all cases was 11″, which is approximately half a beamwidth at 230 GHz. Calibration was performed with the standard chopper-wheel technique, and has an uncertainty of approximately 20% (see Schöier & Olofsson 2001, for details). J2000 positions of both sources are given in Table 1.
Intensity scales of spectra in this paper are given in main-beam brightness temperature, which is the corrected antenna temperature divided by the main-beam efficiency (). Beam efficiencies and FWHM beam widths are summarised in Table 2. Individual spectra are shown in Appendix A, and line frequencies and integrated intensities are shown in Table 3.
Integrated intensities of lines which were not clearly detected are calculated using the following expression,
| (1) |
where is the rms noise in the spectrum, the expansion velocity, the velocity resolution of the spectrum and the number of channels covering the line width. This gives a somewhat optimistic view of the integrated intensity of the line, and hence any fractional abundance calculation using this value will be strictly an upper limit. Values of calculated in this manner are given in Table 3 and indicated by a “less than” sign.
| IRAS16594-4656 | IRAS17150–3224 | |||||||
| Molecule | Transition | Frequency | ||||||
| GHz | K | K km s-1 | K | K km s-1 | ||||
| C3S | =15-14 | 86.708 | 0.01 | 0.03 | — | — | ||
| SiO | =2-1 | 86.847 | 0.01 | 0.03 | — | — | ||
| HN13C | =1-0 | 87.091 | 0.01 | 0.03 | — | — | ||
| C4H | , 19/2-17/2 | 87.372 | 0.01 | 0.03 | — | — | ||
| C2H | =1-0 | 87.329 | 0.01 | 0.03 | — | — | ||
| HCN | =1-0 | 88.632 | 0.02 | 0.47 | 0.02 | 0.54 | ||
| C3N | =9-8, =19/2-17/2 | 89.046 | 0.01 | 0.05 | — | — | ||
| C3N | =9-8, =17/2-15/2 | 89.064 | 0.01 | 0.05 | — | — | ||
| HCO+ | =1-0 | 89.189 | 0.01 | 0.05 | — | — | ||
| HC13CCN | =10-9 | 90.593 | 0.01 | 0.04 | — | — | ||
| HCC13CN | =10-9 | 90.602 | 0.01 | 0.04 | — | — | ||
| HNC | =1-0 | 90.664 | 0.01 | 0.04 | — | — | ||
| SiS | =5-4 | 90.772 | 0.01 | 0.04 | — | — | ||
| HC3N | =10-9 | 90.979 | 0.01 | 0.04 | — | — | ||
| CH3CN | 5(1)-4(1) | 91.985 | 0.01 | 0.05 | — | — | ||
| HC13CCN | =12-11 | 108.711 | 0.01 | 0.06 | — | — | ||
| HCC13CN | =12-11 | 108.721 | 0.01 | 0.06 | — | — | ||
| 13CN | =1-0 | 108.780 | 0.01 | 0.06 | — | — | ||
| C3N | =11-10, =23/2-21/2 | 108.834 | 0.01 | 0.06 | — | — | ||
| C3N | =11-10, =21/2-19/2 | 108.853 | 0.01 | 0.06 | — | — | ||
| SiS | =6-5 | 108.924 | 0.01 | 0.06 | — | — | ||
| HC3N | =12-11 | 109.174 | 0.01 | 0.06 | — | — | ||
| 13CO | =1-0 | 110.201 | 0.04 | 0.06 | 0.04 | 0.75 | ||
| CH3CN | 6(1)-5(1) | 110.381 | 0.01 | 0.11 | 0.01 | 0.09 | ||
| C4H | 23/2-21/2 | 113.266 | 0.01 | 0.09 | 0.01 | 0.06 | ||
| C2S | 8(7)-9(8) | 113.410 | 0.01 | 0.09 | 0.01 | 0.06 | ||
| CN | =1-0 | 113.491 | 0.05 | 3.63 | 0.01 | 0.06 | ||
| C4H | 21/2-19/2 | 115.217 | 0.07 | 0.76 | 0.04 | 0.45 | ||
| CO | =1-0 | 115.271 | 0.61 | 1.78 | 0.25 | 5.05 | ||
| SiC2 | - | 115.382 | 0.07 | 0.76 | 0.04 | 0.45 | ||
| SiO | =3-2 | 130.269 | 0.01 | 0.06 | — | — | ||
| H2CO | - | 140.840 | 0.01 | 0.07 | — | — | ||
| SiC2 | - | 140.920 | 0.01 | 0.07 | — | — | ||
| H13CCCN | =16-15 | 141.062 | 0.01 | 0.07 | — | — | ||
| CS | =3-2 | 146.969 | 0.01 | 0.04 | — | — | ||
| CH3CN | 8(0)-7(0) | 147.175 | 0.01 | 0.04 | — | — | ||
| 13CO | =2-1 | 220.399 | 0.10 | 1.34 | 0.13 | 2.91 | ||
| CH3CN | 12(0)-11(0) | 220.747 | 0.01 | 0.16 | 0.01 | 0.17 | ||
| CN | =2-1 | 226.875 | 0.11 | 9.91 | 0.01 | 0.10 | ||
| CO | =2-1 | 230.538 | 1.75 | 32.60 | 0.65 | 12.84 | ||
| CO+ | =2-1 | 235.790 | 0.01 | 0.12 | — | — | ||
| SiS | =13-12 | 235.961 | 0.01 | 0.12 | — | — | ||
| CH3CN | 13(0)-12(0) | 239.138 | 0.01 | 0.16 | — | — | ||
| CH3C2H | 14(0)-13(0) | 239.252 | 0.01 | 0.16 | — | — | ||
| C3H2 | - | 265.759 | 0.02 | 0.36 | — | — | ||
| HCN | =3-2 | 265.886 | 0.11 | 2.85 | — | — | ||
| H13CN | =4-3 | 345.340 | 0.04 | 0.80 | 0.06 | 1.28 | ||
| HC3N | =38-37 | 345.610 | 0.04 | 0.80 | 0.06 | 1.28 | ||
| CO | =3-2 | 345.796 | 2.05 | 41.20 | 0.78 | 18.19 | ||
3 Sources
The two PPNe presented in this paper are objects for which there are currently few millimetre-wavelength spectra and little or no molecular information. Both show bipolar morphology in HST images and also bright CO emission, with interesting features. These two sources were selected on the basis of previously published CO spectra (Loup et al. 1990; Hu et al. 1993).
3.1 IRAS16594-4656
IRAS16594-4656 is a proto-planetary nebula which lies almost in the plane of the Galaxy (3, van de Steene & van Hoof 2003) and has a mixed chemistry. In its infrared spectrum there are strong and rarely observed features at 12.6 and 13.4 m, thought to be due to polycyclic aromatic hydrocarbons (PAHs) with a high degree of hydrogenation, and further PAH features in the range 3-13 m (García-Lario et al. 1999). An emission feature between 19 and 23 m, associated with C-rich PPNe by Kwok & Hrivnak (1989), also suggests that this source is carbon rich. However, there are also indications of crystalline silicates (pyroxenes), with weak features around 34 m (García-Lario et al. 1999), and a 10 m silicate feature (Olnon et al. 1986). This suggests that until recently this object was oxygen-rich, becoming carbon-rich shortly before the transition to the post-AGB phase (García-Lario et al. 1999), which occurred some 370 years ago (van der Veen et al. 1989). This hypothesis was strengthened by the lack of a detection in OH (te Lintel Hekkert et al. 1991; Silva et al. 1993) and no SiO maser emission (Nyman et al. 1998). In evolved stars with a mixed chemistry such as this, the silicates are found in a torus and the PAHs in the polar flow (Matsuura et al. 2004).
Several authors describe HST images of this PPN (Hrivnak et al. 1999, 2000; García-Lario et al. 1999), which show the presence of a bright , B7-type (van de Steene et al. 2000) central star, surrounded by a multiple–axis bipolar nebulosity with a complex morphology. The nebula is seen at an intermediate inclination, rather than edge-on. The optical size of the nebula is given as 5″11″(García-Lario et al. 1999).
The only CO spectrum of this source previously published is a CO (=1-0) spectrum from Loup et al. (1990), who detected broad CO emission corresponding to that from a circumstellar shell expanding with a velocity of 16 km s-1.
3.2 IRAS17150-3224
IRAS17150-3224 (AFGL6815S) is a young PPN which left the AGB some 150 (Hu et al. 1993) to 210 years ago, and possibly came from a high-mass progenitor (Meixner et al. 2002). Note however, that van der Veen et al. (1989) give a dynamic timescale of 800 yr for this object. Structurally, it is a bipolar nebula, with a nearly edge-on (82°) dusty torus (Kwok et al. 1996), expanding at 11 km s-1 (Weintraub et al. 1998) around a G2-type central star. The optical size of the nebula is approximately 12″ 9″ (Hu et al. 1993; Kwok et al. 1996; García-Hernández et al. 2002). A newly-discovered equatorial loop seen in near-infrared, but not optical, images, is discussed by Su et al. (2003). A faint halo (AGB mass-loss remnant) can be seen in images from Kwok et al. (1998).
IRAS17150-3224 shows molecular hydrogen emission, but not hydrogen recombination, indicating that the degree of ionisation is small (García-Hernández et al. 2002). The emission is likely due to shock-excitation, as is often seen in strongly bipolar nebulae. This object is similar to CRL2688 (Sahai et al. 1998) in that it has H2 emission, and a spectral type later than A (CRL2688 has a spectral type of F2, Cohen & Kuhi 1977). IRAS17150-3224 shows OH maser emission (Hu et al. 1994), but not SiO maser emission (Nyman et al. 1998). It also has been detected in the 3.1 m water line (van der Veen et al. 1989), but not in H2O maser emission (Zuckerman & Lo 1987).
Previous CO observations are limited to the paper of Hu et al. (1993), who present both CO (=1-0) and (=2-1) spectra.
4 CO observations

b) Top. A position-switched high-resolution CO =2-1 spectrum toward IRAS17150-3224. Bottom. A beam-switched CO =3-2 spectrum toward IRAS17150-3224.
4.1 IRAS16594-4656

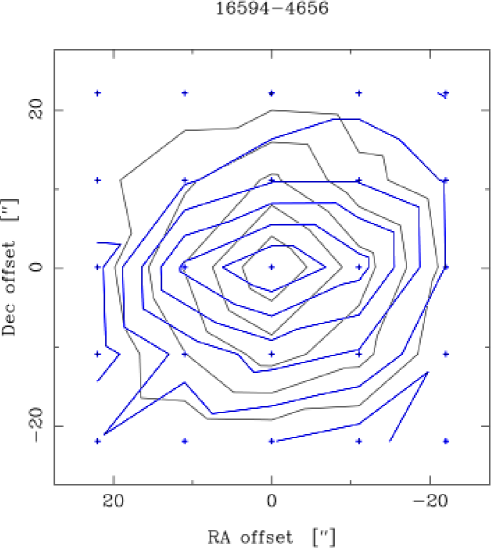
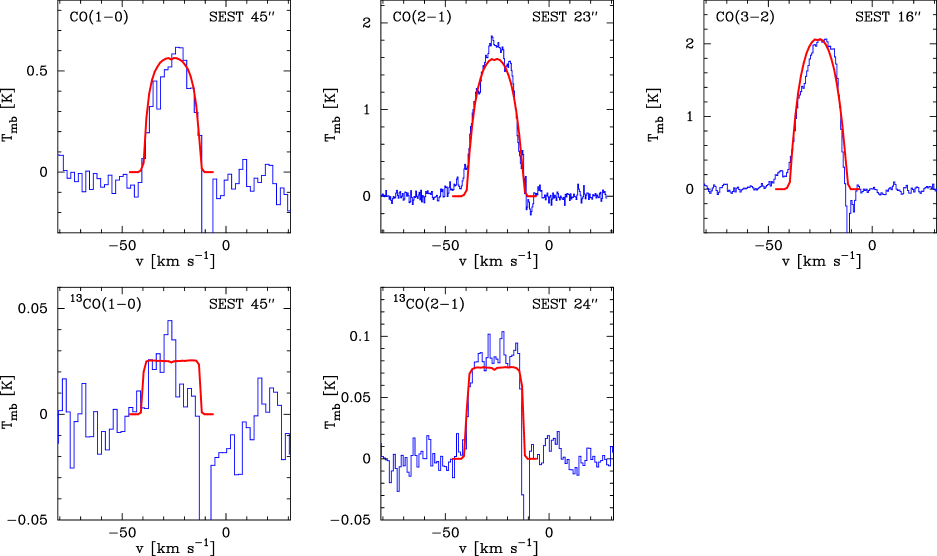
The CO (=2-1) and (=3-2) line profiles presented in Fig. 1a are affected by interstellar emission in the OFF position (between -12 and -5 km s-1 approximately). The CO (=3-2) profile is taken in dual beamswitch mode whereas the CO (=2-1) profile was taken in position switch mode with an OFF position -30″ away in R.A. in order to minimise the effect of the interstellar line. Despite this, a high signal-to-noise ratio affords some indication of structure in this source, shown by features in the line profile. A roughly parabolic profile and a source size comparable to the beam shows that the CO emission is probably optically thick. An outflowing wind of 14 km s-1 is indicated by the line profile, and there seems to be an appreciable line wing on the blue side, possibly indicating a second wind of up to 25 km s-1. The CO (=2-1) map of this source (Fig. 3) shows a reasonably symmetric pattern of emission. The red/blue-shifted emission contour plot (Fig.2) does not show the red-shifted emission, due to the interstellar interference. The blue-shifted emission, taken in the interval [-50,-35] km s-1, lies directly on top of the centre emission, taken in the interval [-35,-12] km s-1, indicating that there is little or no separation in emission regions. There is some emission at 20″ in R.A., and an elliptical Gaussian fit to the integrated intensity map shows that the FWHM ellipse has a major axis of 25″ and a minor axis of 22.5″ (position angle of 57°), very similar to the size of the SEST beam (23″) at 230 GHz. Hence the source is on the limit of being resolved.
4.2 IRAS17150-3224

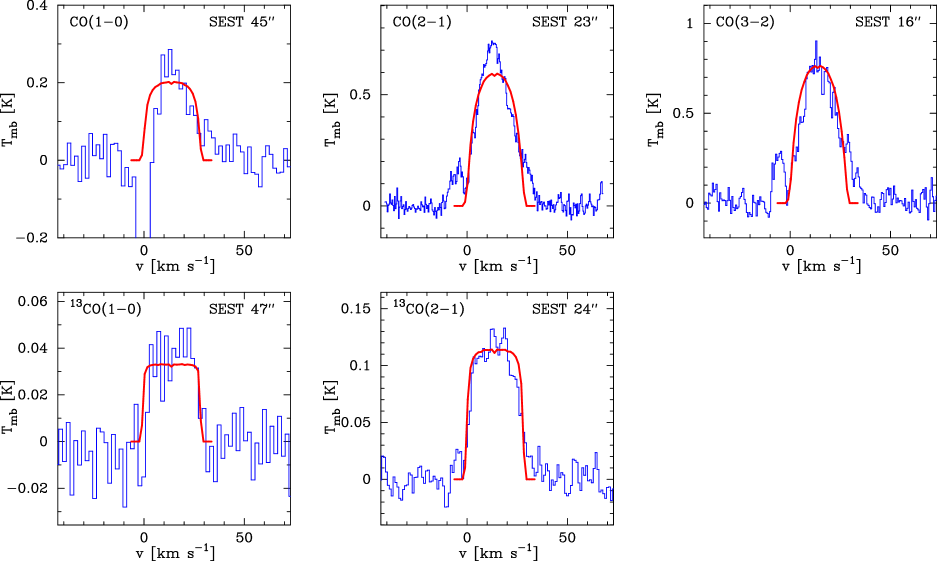
The CO (=2-1) spectrum (Fig. 1b) of IRAS17150-3224 was taken in position switch mode, with an OFF position of +45″ in R.A. The CO (=3-2) was taken in beamswitch mode. Both CO line profiles of IRAS17150-3224 shown in Fig. 1b are distinctly triangular in shape, similar to those shown by 89 Her, the Red Rectangle, and M2-9 (and also IRAS17441-2411, presented in this paper). Here the triangular shape is affected by an interstellar line in the blue-shifted wing (between 0 and 10 km s-1 approximately). The CO lines indicate a wind of some 30 km s-1 coming from the source, and yet a parabolic fit to the line indicates a wind of 14.5 km s-1. This latter wind is ostensibly the AGB wind of the star, with the higher velocity emission probably coming from an inner swept-up shell, moving at a velocity intermediate to the AGB wind and a post-AGB or super-wind. It must be noted, however, that a parabolic fit to a triangular lineshape will usually underestimate the expansion velocity of the outflowing wind.
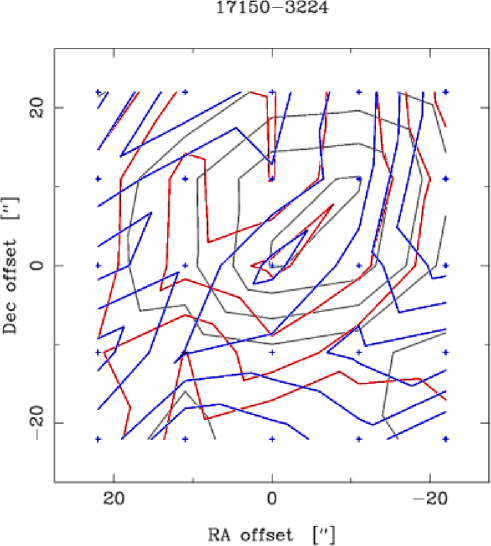
The CO (=2-1) emission map (Fig. 4) is taken in position switch mode to minimise the effects of the interstellar interference, and although hampered slightly by poor pointing, seems to show a reasonably symmetric distribution which does not appear to be resolved by the telescope beam. The contour map (Fig. 2) does not show any separation in the source. The red-shifted emission was taken from the interval [30,40] km s-1, the centre emission from [5,30] km s-1 and the blue-shifted emission from [-18,-6] km s-1. A two-dimensional elliptical Gaussian fit to the centre emission gives an extent of 20″26″ (position angle of -160°) for this source. Again, this is similar to the size of the SEST beam at 230 GHz.
4.3 Other sources observed in CO

Spectra of select sources which have been hitherto unobserved and/or unpublished in the CO (=2-1) line are presented in Fig. 5. HCN (=1-0) spectra have also been taken (not presented), and HCN/CO intensity ratios are derived (Table 4).
CPD-53°5736. Although not clear from the noisy spectrum, CPD-53°5736 seems to show the presence of a wind expanding at 15 km s-1.
IRAS17106-3046. This object shows a strange profile: some low-level emission, perhaps a wind of 15 km s-1, and a thin, narrow spike. This narrow spike (of width 2 km s-1) could correspond in some way to the circumstellar disk observed by Kwok et al. (2000). The narrow feature seems to be offset from the centre of the broad feature, although the signal-to-noise ratio is low.
IRAS17245-3951. Low signal-to-noise means that this profile is hard to qualify. The profile suggests an expansion velocity of 15 km s-1, but this value does have a considerable uncertainty.
IRAS17441-2411. This source has a triangular lineshape, similar to IRAS17150-3224. It is somewhat asymmetric, and quite narrow in velocity (20 km s-1 in width). There are no appreciable line wings.
| CPD-53°5736 | IRAS16594–4656 | IRAS17106–3046 | IRAS17150–3224 | IRAS17245–3951 | IRAS17441–2411 | |||||||
| Molecule | ||||||||||||
| K | K km s-1 | K | K km s-1 | K | K km s-1 | K | K km s-1 | K | K km s-1 | K | K km s-1 | |
| HCN(=1-0) | — | 0.07 | 0.02 | 0.47 | — | — | 0.02 | 0.54 | — | 0.09 | 0.05 | 0.32 |
| CO(=2-1) | 0.09 | 2.07 | 1.75 | 32.60 | 0.30 | 1.84 | 0.65 | 12.84 | 0.04 | 0.58 | 0.57 | 6.24 |
| IHCN/ICO | 0.04 | 0.01 | — | 0.04 | 0.15 | 0.05 | ||||||
4.3.1 IHCN/ICO ratios
The IHCN/ICO ratios shown in Table 4 () look to be reasonably consistent throughout the sample of PPN candidates. To put these figures into context, a sample of oxygen stars selected by Lindqvist et al. (1988) has an average IHCN/ICO ratio of 0.124, whereas the carbon star sample of Olofsson et al. (1990) has an average IHCN/ICO ratio of 0.623. Both these samples were made up of AGB stars; the values for PPNe seem to be smaller. IRAS07134+1005 and IRAS19500-1709, both C-rich PPNe, have IHCN/ICO ratios of 0.15 and 0.08, respectively (Bujarrabal et al. 1992). Evolved PNe generally have IHCN/ICO ratios of less than 0.1 (c.f., Bachiller et al. 1997a).
5 CO line modelling
A detailed, non-LTE, radiative transfer code based on the Monte Carlo method was used in order to model the observed molecular line emission. The code assumes the emitting envelope to be spherically symmetric and expanding at a constant velocity. The thermal balance equation, where CO is assumed to be the main molecular coolant, is solved together with the molecular excitation in order to obtain the kinetic temperature structure. The CO observations are used as constraints in the modelling to determine also the density and velocity fields through a -analysis. This approach was also adopted by Woods et al. (2003b) when modelling a sample of high mass-loss rate carbon stars. More details on the radiative transfer modelling can be found in Schöier & Olofsson (2001). The code has been benchmarked to a high accuracy (van Zadelhoff et al. 2002).
In order to derive the mass loss rate which, together with the expansion velocity, sets the density scale in the wind through the continuity equation, a CO abundance relative to H2 must be adopted. For IRAS16594-4656 a value of , which is typical of a C-rich AGB envelope, is used, whereas for the O-rich object IRAS17150-3224 a value of is adopted. The derived envelope properties such as the mass loss rate (), expansion velocity (vexp), extent of the CO envelope () and 12CO/13CO-ratio are reported in Table 5 together with the adopted distance (), luminosity () and initial CO fractional abundance (). Also shown is the -parameter that determines the amount of heating in the envelope due to momentum transfer due to dust-gas collisions (see Schöier & Olofsson 2001, for details).
In Fig. 6 the best fit model for IRAS16594-4656, using a mass loss rate of M⊙ yr-1 and a 12CO/13CO-ratio of 30, is overlayed on the observed spectra. The total integrated intensities in the lines are well reproduced as are the overall line profiles. There is confusion due to interstellar lines at the red-shifted edge of the line profiles. Also, on the blue-shifted edge there are signs of a second weak component, possibly a higher velocity wind due to the present-day mass loss.
A good fit to CO observations is also obtained for IRAS17150-3224 using a mass loss rate of M⊙ yr-1 (Fig. 7). The 12CO/13CO-ratio is 7, significantly lower than for IRAS16594-4656 but consistent with IRAS17150-3224 being O-rich (Abia et al. 2001). The 12CO spectra for this source show signs of excess emission at larger expansion velocities possibly indicating the presence of a faster moving wind. However, the blue side of the emission is confused by interstellar line contamination.
The -parameter of 10 derived for IRAS16594-4656 is significantly larger than that of IRAS17150-3224 and that which is typically derived for high mass-loss rate AGB-stars, , (Schöier & Olofsson 2001; Woods et al. 2003b). The kinetic temperature derived through the envelope of IRAS16594-4656 is about a factor of two, on average, larger than that obtained for the carbon star IRC+10216 (Schöier & Olofsson 2000, 2001). Such a large discrepancy is hard to explain due to, e.g., uncertainties in the adopted distance, and could instead indicate that the properties of the dust grains are different in IRAS16594-4656 or that there is an additional source of heating of the envelope. A further possibility is that the spectra are contaminated by a second, warmer component such as the bipolar present day mass-loss seen in optical images at smaller spatial scales.
The winds of these PPNe are assumed to resemble those of their progenitor AGB-stars, i.e., spherical symmetry and a constant expansion velocity are assumed. Given that both sources left the AGB yr ago (see Sect. 7.3) this assumption should be valid for distances cm, since the material outside this radius would once have made up the AGB wind. However, there is the possibility that a high velocity bipolar wind is penetrating this remnant AGB shell. The CO emission from the lower rotational transitions observed here are formed mostly at distances larger than cm and thus mainly probe the outer, AGB-type, wind. For other molecular species (e.g., HCN) contributions from the present-day wind might become significant.
However, a more detailed treatment of the wind characteristics will require high-resolution, multi-transition observations that will become a reality with the upcoming APEX/ALMA telescopes. Deviations from the AGB wind model will become more apparent in the high- CO lines, both in the form of the line profile (broader wings) and in the intensity. The AGB wind model predicts that the higher- CO lines (=4-3 to 13-12) should all have an integrated intensity of about 30 K km s-1 and 12 K km s-1 for IRAS16594-4656 and IRAS17150-3224, respectively, when observed with the APEX telescope. Also, the effect of dust emission in the excitation of the molecules, which is not taken into account in the present analysis, needs to be investigated.
6 Molecular evolution
6.1 Molecules
The molecules seen in PPNe give information on various processes which have occurred in the history of the particular PPN. HCN and CN can be used to give an idea of the evolutionary status of a PPN: in AGB stars, HCN is usually more abundant than CN. As HCN becomes increasingly photodissociated, its daughter, CN, becomes increasingly abundant; i.e., one would expect the CN/HCN ratio to increase with evolutionary age, in the early post-AGB phase (see Fig. 8). A similar effect is seen in the comparison of HCN and HNC: In CRL618, for example, the column densities of HCN and HNC are comparable (Herpin & Cernicharo 2000), whereas in IRC+10216 (a less evolved object) HCN is far more abundant that HNC. In both these objects HNC is formed via dissociative recombination of HCNH+.
The HCN/CO ratio should also give some indication of age, since photodissociation would cause this ratio to decrease with time. However, it may be difficult to compare a number of objects which includes a mixture of O-rich and C-rich stars, since they may have had a different HCN/CO ratio when they started to move off the AGB.
The presence of CS can be used in a similar way. CS is abundant in AGB envelopes, and although it can be enhanced by shocks in PPNe (Kasuga et al. 1997; Mitchell 1984) is generally of lower abundance, and unobserved in PNe until recently (Woods & Nyman 2004). HC3N, SiO and SiC2 demonstrate the same sort of behaviour, decreasing in abundance going into the PPNe phase.
HCO+ becomes greatly enhanced in the PPNe phase, and yet it is very difficult to explain why. Theoretical models of post-AGB objects all fail to produce enough HCO+ by at least an order of magnitude, if not more (e.g., Howe et al. 1994; Ali et al. 2001; Woods et al. 2003a). HCO+ is only efficiently formed by ionising radiation, and yet the levels of cosmic ray ionising radiation required to produce the desired levels of HCO+ result in the destruction of most other molecules. This is due to the fact that cosmic rays induce UV photons in their interaction with H2; these photons dissociate and ionise molecules. Woods et al. (2003a) considered whether X-rays might be the responsible for the high level of HCO+. Their treatment was quite general – a treatment where X-rays are solely responsible for ionisation (and not dissociation) might prove interesting. This approach was taken in the chemical model explained in Sect. 6.3. However, a more thorough treatment needs to be made.
HCO+ can also form in photon-dominated regions (PDRs), in warm gas (800 K), through reactions involving CO+, which itself is formed through reactions between C+ and OH (Hasegawa et al. 2000). Moreover, shocked gas can be identified by the presence of HCO+ (as well as SiO) (e.g., Mitchell & Watt 1985), and although high levels of HCO+ do not necessarily imply shocks, the presence of high levels of SiO does give a much better indication of the presence of shocked gas.
The 12CO/13CO is low () in several PPNe (e.g., Kahane et al. 1992) compared to 12CO/13CO in evolved PNe (Palla et al. 2000; Bachiller et al. 1997a), 12CO/13CO in compact PNe (Josselin & Bachiller 2003) and 12CO/13CO in AGB stars (e.g., Kahane et al. 1988; Greaves & Holland 1997; Schöier & Olofsson 2000). From our radiative transfer analysis we derive 12CO/13CO ratios of 30 and 7 for the PPNe IRAS16594-4656 and IRAS17150-3224, respectively. This ratio may be an indicator of evolution (since 13CO self-shields less than 12CO), but it is more likely to be an indicator of a star’s nucleosynthesis history which may be very different for otherwise apparently similar objects (e.g., Kahane et al. 1992, 1988).
6.2 Fractional abundances
6.2.1 Calculation of fractional abundances
In Sect. 5 the mass loss rates, and hence the radial distribution of the number density of H2, for the sample PPNe were determined from a detailed radiative transfer analysis of the observed CO line emission adopting a particular CO/H2 abundance ratio. Here, fractional abundances for the remaining molecular species observed were calculated assuming optically thin emission. The radiative transfer for these lines is treated in the same way as described in Woods et al. (2003b), and the results are shown in Table 6. A constant excitation temperature of 25 K is assumed throughout the emitting region. Upper limits to fractional abundances are given in Table 7, and are calculated using the integrated intensity from Eq. 1. The same molecular data as used in Woods et al. (2003b) are adopted here.
Inner and outer radii of molecular distributions are determined in much the same way as Woods et al. (2003b), using a photodissociation model. Here, however, there is not the benefit of good interferometric data. Hence simplifying assumptions have to be made about certain molecular distributions. The distribution of all parent species, with the exception of CO, is calculated from the photodissociation model (observed parent species are HCN, CS, SiO, SiS). The distribution of CO comes from the radiative transfer modelling, as described in Sect. 5. Self-shielding of CO is taken into account, in the manner of Mamon et al. (1988). All ionisation products or products of the circumstellar chemistry are assumed to take on the distribution of C2H, with the exception of CN, which has a slightly more expansive distribution. This should not have too great an effect on results since there is only a linear dependence on the difference between inner and outer radius. These are very straightforward assumptions, which ignore effects of circumstellar chemistry, and freeze-out onto grains, for example. Again, isotopomers are assumed to have the same distribution as their more abundant forms.
| IRAS16594–4656 | IRAS17150–3224 | |||||||||
|---|---|---|---|---|---|---|---|---|---|---|
| Molecule | Transition | |||||||||
| cm | cm | cm | cm | |||||||
| 13COa | — | — | 2.9 (17) | 3.3 (-5) | — | 2.4 (17) | 2.9 (-5) | |||
| HCN | =1-0 | — | 2.3 (16) | 1.0 (-6) | — | 4.4 (16) | 3.8 (-7) | |||
| HCN | =3-2 | — | 2.3 (16) | 1.9 (-7) | — | 4.4 (16) | — | |||
| CN | =1-0 | 1.7 (16) | 5.1 (16) | 9.6 (-6) | 3.9 (16) | 9.8 (16) | U.L.b | |||
| CN | =2-1 | 1.7 (16) | 5.1 (16) | 2.5 (-6) | 3.9 (16) | 9.8 (16) | U.L.b |
| IRAS16594–4656 | IRAS17150–3224 | |||
|---|---|---|---|---|
| Molecule | ||||
| CO+ | 1.1 (-8) | — | ||
| HCO+ | 1.2 (-7) | — | ||
| H2CO | 1.1 (-6) | — | ||
| CS | 6.5 (-8) | — | ||
| C2S | 3.4 (-7) | 9.5 (-8) | ||
| C3S | 4.1 (-7) | — | ||
| SiO | 5.1 (-8) | — | ||
| SiS | 3.2 (-7) | — | ||
| SiC2 | 4.7 (-7) | 2.1 (-6) | ||
| CN | Det.a | 1.1 (-8) | ||
| 13CN | 5.0 (-7) | — | ||
| H13CN | 2.4 (-8) | 1.3 (-8) | ||
| HNC | 1.8 (-7) | — | ||
| HN13C | 1.9 (-7) | — | ||
| HC3N | 2.7 (-7) | — | ||
| H(13)C3Nb | 2.7 (-7) | — | ||
| H13CCCN | 2.0 (-7) | — | ||
| C3N | 4.2 (-7) | — | ||
| CH3CN | 8.2 (-8) | 5.3 (-8) | ||
| C2H | 3.1 (-6) | — | ||
| CH3C2H | 3.5 (-6) | — | ||
| C3H2 | 2.5 (-7) | — | ||
| C4H | 4.5 (-6) | 1.4 (-6) |
-
(a)
signifies a detection has been made of that particular line in that particular source (see Table 6).
-
(b)
signifies a blend of HCC13CN and HC13CCN.
| C-rich PPNe: | IRAS16594-4656 | M1-16 | CRL618 | CRL2688 | IRAS19500-1709 | IRC+10216 | |||||
|---|---|---|---|---|---|---|---|---|---|---|---|
| 13CO | 3.3 (-5)a | 2.4 (-5)b | 5.2 (-5)b | 2.0 (-5)k | |||||||
| HCN | 6.1 (-7)a | 1.0 (-7)j | 4.4 (-6)b–5.0 (-7)d | 2.1 (-5)b–4.0 (-7)d | 1.5 (-7)k | 1.3 (-5)r | |||||
| CN | 6.0 (-6)a | 8.5 (-7)j | 2.1 (-6)c | 1.0 (-6)c | 2.2 (-6)r | ||||||
| H13CN | 2.4 (-8)a | 6.3 (-8)e | 4.0 (-6)g–5.1 (-7)e | 2.8 (-7)r | |||||||
| HNC | 1.8 (-7)a | 1.9 (-6)b–1.9 (-7)e | 1.8 (-7)h–5.0 (-8)g | 5.5 (-8)r | |||||||
| HC3N | 2.7 (-7)a | 4.4 (-7)e–1.9 (-7)b | 1.5 (-7)e,g | 1.0 (-6)r | |||||||
| HCO+ | 1.2 (-7)a | 9.3 (-8)j | 2.0 (-7)d | ||||||||
| CS | 6.5 (-8)a | 8.8 (-8)j | 4.1 (-7)b–6.0 (-8)d | 2.1 (-6)b | 8.8 (-7)r | ||||||
| C2H | 3.1 (-6)a | 2.0 (-6)d | 9.3 (-6)f | 2.6 (-6)r | |||||||
| C4H | 4.5 (-5)a | 2.9 (-6)b–8.0 (-8)d | 3.2 (-6)r | ||||||||
| SiO | 5.1 (-8)a | 2.4 (-8)j | 5.5 (-7)b | 1.1 (-7)r | |||||||
| SiS | 3.2 (-7)a | 4.2 (-8)j | 4.0 (-8)g | 9.5 (-7)r | |||||||
| O-rich PPNe: | IRAS17150-3224 | M1-92 | HD101584 | IRAS19114+0002 | OH17.7-2.0 | OH231.8+4.2 | |||||
| 13CO | 2.9 (-5)a | 5.0 (-4)q | 3.8 (-4)b | 4.2 (-6)b | 1.0 (-4)l–2.2 (-5)b | ||||||
| HCN | 3.8 (-7)a | 2.0 (-7)o,p | 1.7 (-6)q | 4.5 (-6)b | 1.6 (-7)b | 4.4 (-6)b–5.2 (-8)m | |||||
| CN | 1.1 (-8)a | 2.0 (-7)c,l | |||||||||
| H13CN | 1.3 (-8)a | 4.8 (-8)l | |||||||||
| C4H | 1.4 (-6)a | 3.6 (-7)q | 1.4 (-6)b | 4.7 (-8)b |
-
(a) This work. (b) Bujarrabal et al. (1994) (c) Bachiller et al. (1997b) (d) Bujarrabal et al. (1988) (e) Sopka et al. (1989) (f) Fuente et al. (1998) (g) Nguyen-Q-Rieu & Bieging (1990) (h) Kasuga et al. (1997) (j) Sahai et al. (1994) (k) Using the results of Bujarrabal et al. (1992, 2001). (l) Morris et al. (1987) (m) Sanchez Contreras et al. (1997) (n) Omont et al. (1993) (o) Lindqvist et al. (1992) (p) Nercessian et al. (1989) (q) Using the results of Olofsson & Nyman (1999). (r) Woods et al. (2003b)
6.2.2 Uncertainties
As discussed in Woods et al. (2003b), there are inherent uncertainties in the approach taken here. Typical distance estimates can vary by up to a factor 2, and this influences the mass-loss rate derived from the radiative transfer modelling (see Sect. 5). When combined with the uncertainties in the choice of inner and outer radii for the molecular distributions, the overall error in fractional abundance varies with , where is the distance. Given also that there are likely to be errors introduced by the choice of excitation temperature, an overall error of a factor 5 or so is to be expected in fractional abundance estimates. Moreover, some species other than CO are expected to be optically thick, most notably HCN, and the optically thin approximation would give systematically too low fractional abundances in those cases. As mentioned in Sect. 5, contribution to the line intensities from the present-day, non-spherically symmetric, high-velocity, mass loss might become significant for some molecules. A full treatment of this problem, including the effects of radiative excitation due to dust emission, will require high spatial resolution observations of a large number of molecules. With these caveats, molecular fractional abundances are believed to be order of magnitude estimates.
6.3 The chemical model
To investigate the changes in fractional abundance of species during the late AGB and PPN phases, a chemical model of the circumstellar envelope was used. Results of this model are shown in Fig. 8. The chemical model of IRC+10216 constructed by Millar et al. (2000, MHB) has been adapted to investigate the chemistry, particularly the photochemistry, as an AGB star finishes its phase of mass loss, and moves into the PPN phase. Several simplifying assumptions are made, and the MHB model has been changed to include X-rays, and a minimal X-ray chemistry.
6.3.1 Model parameters and simplifying assumptions
Several parcels of gas and dust in the circumstellar envelope (CSE) of an AGB star are assumed to flow outward at a uniform velocity of 14 km s-1, from initial radial distances of 1, 4 and 71015, 1, 4 and 71016 and 1 and 4 1017 cm from the central star. A mass-loss rate of 110-5 M yr-1 is chosen, in accordance with the molecular line modelling in Table 5. A spherical geometry implies that the density of the homogeneous outflow drops as . Mass-loss is assumed to end with the start of the model.
Envelope heating. During the expansion, the “kinetic temperature” of the parcels varies according to =()0.79, where increases from 100 K to 1 000 K over the first 1 000 yr of the model (chosen to represent the PPN phase). This heating is due to the increasing temperature of the central star, as it evolves towards a white dwarf.
Stellar UV field. Following the increase in stellar temperature, the intensity of the stellar UV field also increases. An ionisation rate similar to that of the interstellar UV field is assumed at the start of the model. At the end of the first 1 000 yr this value has increased by a factor of 2105 (c.f., Herpin & Cernicharo 2000).
X-rays. X-rays from the central star or companion (Woods et al. 2002) are treated in a very simple way in this model. The X-ray extinction law of Deguchi et al. (1990) is used (see their Eq. B3), and an X-ray energy of 1.2 keV is assumed (1 nm). X-rays only play an ionising role in the chemical reaction network, and these reactions are given the same rate coefficients as the equivalent cosmic-ray reactions. A very low ionisation rate of 10-17 s-1 is chosen initially; this has risen to a rate of 10-13 s-1 by the end of the model run.
6.3.2 Chemical reaction network
The reaction network is the same as that used in Woods et al. (2003a), with the addition of a small number of X-ray ionisation reactions. At present the network includes 3897 reactions among 407 species in 6 elements. Initial fractional abundances are determined via the use of an AGB steady-state model, with a mass-loss rate of 110-5 M⊙ yr-1 and expansion velocity of 14 km s-1. For example, a parcel starting at a radius of 11016 cm in the model presented here will have initial abundances which are the same as a parcel of “AGB” material at the same radial distance. The initial abundances of parent molecules for the AGB model are chosen to represent a carbon-rich environment, and values are taken from MHB.
7 Discussion
7.1 Comparison of observations with chemical model
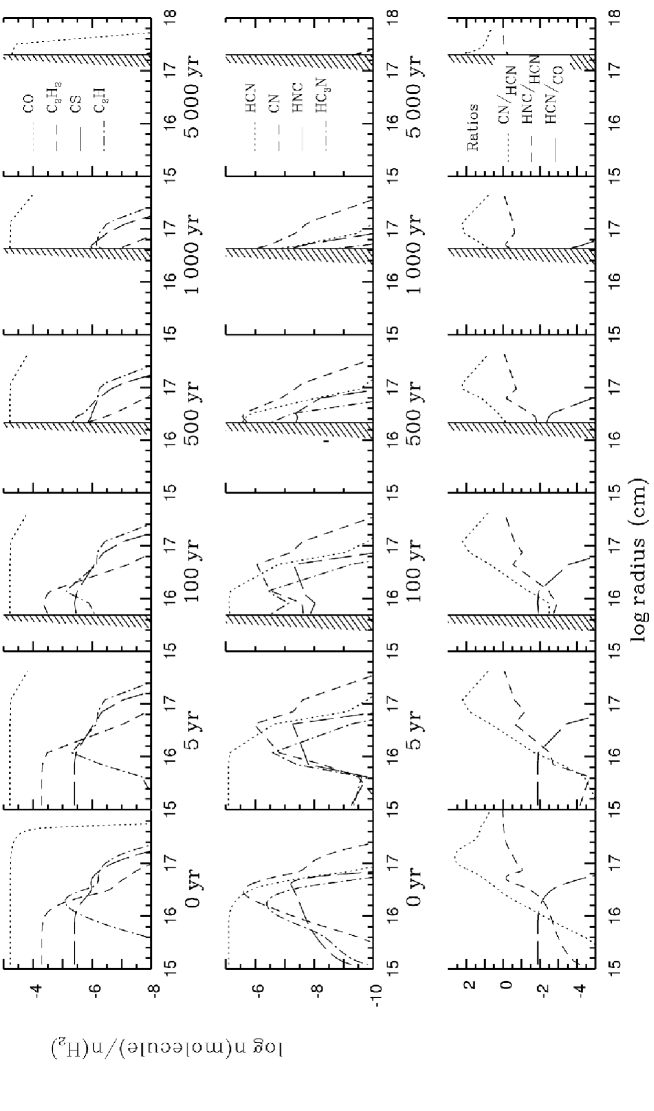
The chemical model generally shows good agreement with the fractional abundances derived here. Given the order of magnitude error margins (Sect. 6.2.2), both HCN and CN reach the calculated fractional abundances for IRAS16594-4656 during the first 1 000 yr of the model (i.e., the PPN phase). Upper limits for other observed species (e.g., HNC, HC3N, C2H and C4H) are also in agreement with the model in this region. CS is predicted to be more abundant than observed. The model also shows that a few species (e.g., CO, C2H and CN) survive at observable levels after, say, 1 000 yr of post-AGB evolution (Fig. 8).
Perhaps the most interesting result of the model is the variation of the CN/HCN, HNC/HCN and HCN/CO ratios. As expected, the CN/HCN ratio is seen to rise during the early post-AGB evolution (taking a mean through the envelope, Fig. 8). Similarly, the HNC/HCN ratio also increases. The HCN/CO ratio declines significantly with post-AGB age. When these three behaviours are combined, a reasonably accurate age can be given. This approach is taken later, in Sect. 7.3.
7.2 Comparison of observations with other observations
IRAS16594-4656 is very under-abundant in molecules in comparison to C-rich AGB stars. Generally, fractional abundances derived here, and presented in Table 6 (and the upper limits shown in Table 7), are an order of magnitude deficient when compared to C-rich AGB stars, such as those surveyed in Bujarrabal et al. (1994) and Woods et al. (2003b). Two exceptions to this are CN and 13CO, which show good agreement with the fractional abundances derived for IRC+10216.
The lack of detection of SiO would seem to confirm that IRAS16954-4656 is C-rich, and that any silicate grains present (see García-Lario et al. 1999) are not being destroyed by shocks because either shocks might not be present, or the shocks which are present are not strong enough (c.f., van de Steene & van Hoof 2003). Another explanation may be that the shocked regions are very small, in which case high abundances of SiO would be localised, and SiO emission diluted by the beam.
Conversely, IRAS17150-3224 seems (chemically) very much like an O-rich AGB star, such as those observed by Bujarrabal et al. (1994), or Lindqvist et al. (1988), for example. Although the fractional abundances of only two molecules, 13CO and HCN, in IRAS17150-3224 are suitable for comparison, they are very similar to the O-rich AGB stars in both AGB-star samples.
So, IRAS16594-4656 and IRAS17150-3224 seem to have different chemical properties from each other, and both seem far from the well-known molecule-rich PPNe, like CRL618, CRL2688 and OH231.8+4.2. IRAS16594-4656, supposedly a C-rich object, is poor in molecules and, as can be seen from Table 8, is at least an order of magnitude less abundant than CRL618 and CRL2688 in many molecules. However, IRAS16594-4656 has generally higher fractional abundances than M1-16, which is widely accepted to be a standard PN. An exception to this is CN - a fractional abundance of CN similar to those in CRL618 and CRL2688 may indicate that IRAS16594-4656 is a somewhat evolved PPN, but not quite part of the PN regime yet. The theoretical work of Woods et al. (2003a) shows that fractional abundances of CN can remain high for a period of 100 years in the PPNe phase, whilst other molecules are destroyed, if molecular material is to be found in the shielded environment of a circumstellar torus.
Bachiller et al. (1997a) present a homogeneous sample of molecular abundances in post-AGB objects; however, both IRAS16594-4656 and IRAS17150-3224 are too low in molecular abundance to present much of a comparison. These two PPNe are closest in fractional abundances to the younger objects in the Bachiller et al. (1997a) sample.
Using the fractional abundance of HCN derived from the =1-0 line, since this line is least likely of the two observed to be optically thick, a CN/HCN ratio of is derived for IRAS16594-4656. This value is quite uncertain, and dependent very much on the factors discussed in Sect. 6.2.2. A full radiative transfer treatment of the HCN(=1-0) line does in fact predict a fractional abundance times larger than that derived via the optically thin assumption (Sect. 6.2.2), implying that IRAS16594-4656 could have a CN/HCN ratio as low as . In this case the CN/HCN ratio seems to indicate that IRAS16594-4656 is just starting the post-AGB phase. Other PPNe have a CN/HCN ratio up to an order of magnitude smaller, e.g., for CRL618, CN/HCN0.5 and for CRL2688, CN/HCN0.2. IRC+10216 has a smaller CN/HCN ratio yet, and the more evolved object NGC7027 has a CN/HCN ratio of about 10.
Both IRAS16594-4656 and IRAS17150-3224 have very low HCN/CO ratios compared to CRL618, CRL2688 and OH231.8+4.2. IRAS16594-4656 has an HCN/CO ratio of 610-4, whereas CRL618 and CRL2688 have ratios of 610-3 and 310-2 respectively (Bujarrabal et al. 1994). IRAS17150-3224 has an HCN/CO ratio of 210-3, which is again smaller than the 210-2 of OH231.8+4.2 (Bujarrabal et al. 1994).
From what can be implied by Table 8, IRAS17150-3224 is similar to OH231.8+4.2 in 13CO, and HCN (despite the spread in observed values). The relatively high fractional abundance of HCN (half that of the C-rich object IRAS16594-4656) would imply that IRAS17150-3224 is at a stage before heavy ionisation of the molecular matter occurs (and the CN fractional abundance rises), i.e., IRAS17150-3224 is at a less evolved stage than IRAS16594-4656.
7.3 Chemical evolution from the AGB
One has to ask why there seem to be two differing evolutionary paths for PPNe: why are some PPNe molecule-rich, like CRL618, and why are some molecule-poor, like the two objects discussed here? Visually, IRAS16594-4656 and IRAS17150-3224 are not very different from CRL618. All three have a similar bipolar structure, with a pinched waist indicating an equatorial density enhancement and possibly a collimating mechanism. In the case of CRL618, this mechanism could very well be a circumstellar torus, the presence of which has been implied from observations (see Herpin & Cernicharo 2000, and references therein). Hence it does not seem too exotic to consider similar structures for IRAS16594-4656 and IRAS17150-3224. Many of the PPNe identified do have such structures, which have been directly observed (e.g., IRAS17106-3046 – Kwok et al. (2000), IRAS17245-3951 – Hrivnak et al. (1999), IRAS04296+3429 – Sahai (1999), Hen 401 – Sahai et al. (1999), IRAS17441-2411 – Su et al. (1998); Kwok et al. (1996)) and there is strong evidence from polarimetry (Su et al. 2000) that a circumstellar disk or torus does exist around IRAS16594-4656.
CRL618 owes its molecular richness, in a large part, to the shielding effects of its torus. This can clearly be seen in the chemical model of Woods et al. (2003a) - the high levels of radiation are only abated by high initial densities and a slow torus expansion velocity, and when the density, or essentially the extinction, becomes too low, complex molecules are destroyed. One obvious implication that this has for PPNe such as IRAS16594-4656 and IRAS17150-3224 is that their collimating torus must not be dense enough to synthesise and protect complex molecules. This brings in an interesting interplay between the column density of material required to produce the degree of collimation seen and the column density of material required to shield complex molecules from the often very intense UV fields, cosmic rays and possibly also X-rays. One of the prevalent results from Woods et al. (2003a) was that incident UV radiation would start to destroy molecules when the optical depth reached approximately 10 magnitudes of extinction. This equates to a column density of 1.6 1022 cm-2. For the particular model of CRL618, the density at the innermost part of the torus is 109 cm-3. Numerical models (e.g., Ignace et al. 1996) show that only an equatorial density enhancement of 2 or more over the polar direction is enough to produce asphericity (bipolarity) in a wind-compressed disk situation. Typically an average AGB star (e.g., M⊙ yr-1 and v km s-1) would have a density of around 107 cm-3 at a similar radial distance (1015 cm).
To support the hypothesis that these two PPNe are low in fractional abundances due to low envelope density, a chemical model was constructed to follow the evolution of a star along the AGB phase and into the PPNe phase. Details of the model can be found in Sect. 6.3. The model shows that within 500 yr of the cessation of mass-loss UV photons from the star start to ionise the molecular material at a very high rate, and molecular matter is destroyed rapidly. Evidence of the increasing UV field can be seen particularly in the profiles of CN (Fig. 8), which show an increase in fractional abundance at the 500 yr mark, where the UV field starts to become significant. The profiles shown in Fig. 8 are also subtly different from those of steady-state AGB models (compare with the leftmost set of axes, labelled “0 yr”), indicating that the mildly increasing UV field does have a marked effect, even in the early stages of post-AGB evolution. X-ray photons have little effect in this environment, with the chosen assumptions. CO, which self-shields in the model, would survive at least 12 000 yr after the end of mass-loss at detectable levels. This differs from the case of a molecular torus (Woods et al. 2003a) in that in the CSE case there is a reasonably slow decline of parent species, like HCN, whereas in the torus model, parent molecules are destroyed within a hundred years once the extinction provided by the circumstellar matter drops to around 10 magnitudes. It is also quite marked how rapidly species form in the torus before the “radiation catastrophe”, in comparison with the slow build-up in the CSE model. As a consequence of this, there are not the high fractional abundances of photodissociation products (e.g., CN, C2H) in the CSE case that are found in the torus model, and in molecule-rich PPNe, like CRL618.
Using the fractional abundances calculated from observations and the chemical model an approximate post-AGB age for IRAS16594-4656 can be estimated. IRAS16594-4656 seems to be older than IRAS17150-3224, with quite a high CN fractional abundance and also a higher CN/HCN ratio. Through comparison with Fig. 8 in particular, the figure of 370 yr, named by van der Veen et al. (1989), seems a good estimate, since a CN/HCN ratio of 3–5 (or even 10) is only possible at times less than 500 yr. IRAS17150-3224 is slightly more difficult to qualify, since there is no detection of CN. However, this does suggest that the CN/HCN ratio is low. The HCN/CO is high (higher than IRAS16594-4656) and hence a post-AGB age of 150–210 yr for IRAS17150-3224 (Hu et al. 1993; Meixner et al. 2002) seems likely, with the estimate of van der Veen et al. (1989), 800 yr, appearing to be much too long to be an accurate post-AGB age for this object.
It is not clear whether IRAS16594-4656 and IRAS17150-3224 are older or younger than CRL618 and CRL2688. The lack of signs of ionisation suggest that they are younger; the reasonably high CN/HCN ratios and low HCN/CO ratios suggest that they are older. Certainly, IRAS16594-4656 fits into the “ evolutionary sequence” (of post-AGB objects) of Bachiller et al. (1997a) between CRL618 and the young PN, NGC7027. The age estimates of van der Veen et al. (1989), Hu et al. (1993) and Meixner et al. (2002), above, in comparison with the results of Bujarrabal et al. (2001) also tend to favour IRAS16594-4656 and IRAS17150-3224 being older, since Bujarrabal et al. (2001) give post-AGB ages for CRL618 and CRL2688 as 110 and 200 yr, respectively.
8 Conclusions
Two proto-planetary nebulae, IRAS16594-4656 and IRAS17150-3224, were observed in a wide range of molecular lines, but only detected in a few. Calculating fractional abundances and upper limits from these lines shows that these two sources are molecule-poor in relation to other PPNe, such as CRL618, CRL2688 and OH231.8+4.2. As a reason for this apparent difference the degree of density of the circumstellar torus (or disk) is suggested, with molecule-rich PPNe having dense, protective and nurturing tori, and molecule-poor PPNe having tenuous, or no, tori. To substantiate this, a model of the chemistry in a late–AGB/early–PPN circumstellar envelope, with no particular density enhancements (such as a torus), is used. As expected, it shows that very few molecules reach high fractional abundances in the post-AGB phase, and agrees well with fractional abundances calculated from observations. This is in stark contrast to the model of Woods et al. (2003a), who model a dense circumstellar torus in the PPN phase. The usefulness of HCN/CO, HNC/HCN and particularly CN/HCN ratios in determining evolutionary age is discussed, and using these tools, post-AGB ages for IRAS16594-4656 and IRAS17150-3224 are given.
Acknowledgements.
Astrophysics at UMIST is supported by a grant from PPARC. The Swedish–ESO Submillimetre Telescope, SEST, is operated jointly by ESO and the Swedish National Facility for Radioastronomy, Onsala Space Observatory at Chalmers University of Technology. FLS and HO acknowledge financial support from the Swedish research council.References
- Abia et al. (2001) Abia, C., Busso, M., Gallino, R., et al. 2001, ApJ, 559, 1117
- Ali et al. (2001) Ali, A., Shalabiea, O. M., El-Nawawy, M. S., & Millar, T. J. 2001, MNRAS, 325, 881
- Bachiller et al. (1997a) Bachiller, R., Forveille, T., Huggins, P. J., & Cox, P. 1997a, A&A, 324, 1123
- Bachiller et al. (1997b) Bachiller, R., Fuente, A., Bujarrabal, V., et al. 1997b, A&A, 319, 235
- Balick (1987) Balick, B. 1987, AJ, 94, 671
- Balick & Frank (2002) Balick, B. & Frank, A. 2002, ARA&A, 40, 439
- Bujarrabal et al. (1992) Bujarrabal, V., Alcolea, J., & Planesas, P. 1992, A&A, 257, 701
- Bujarrabal et al. (2001) Bujarrabal, V., Castro-Carrizo, A., Alcolea, J., & Sánchez Contreras, C. 2001, A&A, 377, 868
- Bujarrabal et al. (1994) Bujarrabal, V., Fuente, A., & Omont, A. 1994, A&A, 285, 247
- Bujarrabal et al. (1988) Bujarrabal, V., Gomez-Gonzalez, J., Bachiller, R., & Martin-Pintado, J. 1988, A&A, 204, 242
- Calvet & Peimbert (1983) Calvet, N. & Peimbert, M. 1983, Revista Mexicana de Astronomia y Astrofisica, 5, 319
- Cohen & Kuhi (1977) Cohen, M. & Kuhi, L. V. 1977, ApJ, 213, 79
- Deguchi et al. (1990) Deguchi, S., Izumiura, H., Kaifu, N., et al. 1990, ApJ, 351, 522
- Fuente et al. (1998) Fuente, A., Cernicharo, J., & Omont, A. 1998, A&A, 330, 232
- García-Hernández et al. (2002) García-Hernández, D. A., Manchado, A., García-Lario, P., et al. 2002, A&A, 387, 955
- García-Lario et al. (1999) García-Lario, P., Manchado, A., Ulla, A., & Manteiga, M. 1999, ApJ, 513, 941
- Greaves & Holland (1997) Greaves, J. S. & Holland, W. S. 1997, A&A, 327, 342
- Hasegawa et al. (2000) Hasegawa, T., Volk, K., & Kwok, S. 2000, ApJ, 532, 994
- Herpin & Cernicharo (2000) Herpin, F. & Cernicharo, J. 2000, ApJ, 530, L129
- Howe et al. (1994) Howe, D. A., Hartquist, T. W., & Williams, D. A. 1994, MNRAS, 271, 811
- Hrivnak et al. (1999) Hrivnak, B. J., Kwok, S., & Su, K. Y. L. 1999, ApJ, 524, 849
- Hrivnak et al. (2001) —. 2001, AJ, 121, 2775
- Hrivnak et al. (2000) Hrivnak, B. J., Volk, K., & Kwok, S. 2000, ApJ, 535, 275
- Hu et al. (1993) Hu, J. Y., Slijkhuis, S., Nguyen-Q-Rieu, & de Jong, T. 1993, A&A, 273, 185
- Hu et al. (1994) Hu, J. Y., te Lintel Hekkert, P., Slijkhuis, F., et al. 1994, A&AS, 103, 301
- Ignace et al. (1996) Ignace, R., Cassinelli, J. P., & Bjorkman, J. E. 1996, ApJ, 459, 671
- Josselin & Bachiller (2003) Josselin, E. & Bachiller, R. 2003, A&A, 397, 659
- Kahane et al. (1992) Kahane, C., Cernicharo, J., Gomez-Gonzalez, J., & Guelin, M. 1992, A&A, 256, 235
- Kahane et al. (1988) Kahane, C., Gomez-Gonzalez, J., Cernicharo, J., & Guelin, M. 1988, A&A, 190, 167
- Kastner & Weintraub (1994) Kastner, J. H. & Weintraub, D. A. 1994, ApJ, 434, 719
- Kasuga et al. (1997) Kasuga, T., Yamamura, I., & Deguchi, S. 1997, A&A, 320, 575
- Kwok (1993) Kwok, S. 1993, ARA&A, 31, 63
- Kwok & Hrivnak (1989) Kwok, S. & Hrivnak, B. J. 1989, in Infrared Spectroscopy in Astronomy, 363–366
- Kwok et al. (2000) Kwok, S., Hrivnak, B. J., & Su, K. Y. L. 2000, ApJ, 544, L149
- Kwok et al. (1996) Kwok, S., Hrivnak, B. J., Zhang, C. Y., & Langill, P. L. 1996, ApJ, 472, 287
- Kwok et al. (1998) Kwok, S., Su, K. Y. L., & Hrivnak, B. J. 1998, ApJ, 501, L117+
- Lindqvist et al. (1988) Lindqvist, M., Nyman, L.-A., Olofsson, H., & Winnberg, A. 1988, A&A, 205, L15
- Lindqvist et al. (1992) Lindqvist, M., Olofsson, H., Winnberg, A., & Nyman, L.-A. 1992, A&A, 263, 183
- Loup et al. (1990) Loup, C., Forveille, T., Omont, A., & Nyman, L.-A. 1990, A&A, 227, L29
- Mamon et al. (1988) Mamon, G. A., Glassgold, A. E., & Huggins, P. J. 1988, ApJ, 328, 797
- Matsuura et al. (2004) Matsuura, M., Zijlstra, A. A., Molster, F. J., et al. 2004, ApJ, 604, 791
- Meixner et al. (2002) Meixner, M., Ueta, T., Bobrowsky, M., & Speck, A. 2002, ApJ, 571, 936
- Millar et al. (2000) Millar, T. J., Herbst, E., & Bettens, R. P. A. 2000, MNRAS, 316, 195
- Mitchell (1984) Mitchell, G. F. 1984, ApJ, 287, 665
- Mitchell & Watt (1985) Mitchell, G. F. & Watt, G. D. 1985, A&A, 151, 121
- Morris et al. (1987) Morris, M., Guilloteau, S., Lucas, R., & Omont, A. 1987, ApJ, 321, 888
- Nercessian et al. (1989) Nercessian, E., Omont, A., Benayoun, J. J., & Guilloteau, S. 1989, A&A, 210, 225
- Nguyen-Q-Rieu & Bieging (1990) Nguyen-Q-Rieu & Bieging, J. H. 1990, ApJ, 359, 131
- Nyman et al. (1998) Nyman, L.-A., Hall, P. J., & Olofsson, H. 1998, A&AS, 127, 185
- Olivier et al. (2001) Olivier, E. A., Whitelock, P., & Marang, F. 2001, MNRAS, 326, 490
- Olnon et al. (1986) Olnon, F. M., Raimond, E., Neugebauer, G., et al. 1986, A&AS, 65, 607
- Olofsson et al. (1990) Olofsson, H., Eriksson, K., & Gustafsson, B. 1990, A&A, 230, 405
- Olofsson & Nyman (1999) Olofsson, H. & Nyman, L.-Å. 1999, A&A, 347, 194
- Omont et al. (1993) Omont, A., Lucas, R., Morris, M., & Guilloteau, S. 1993, A&A, 267, 490
- Palla et al. (2000) Palla, F., Bachiller, R., Stanghellini, L., Tosi, M., & Galli, D. 2000, A&A, 355, 69
- Sahai (1999) Sahai, R. 1999, ApJ, 524, L125
- Sahai et al. (1999) Sahai, R., Bujarrabal, V., & Zijlstra, A. 1999, ApJ, 518, L115
- Sahai et al. (1998) Sahai, R., Hines, D. C., Kastner, J. H., et al. 1998, ApJ, 492, L163+
- Sahai et al. (1994) Sahai, R., Wootten, A., Schwarz, H. E., & Wild, W. 1994, ApJ, 428, 237
- Sanchez Contreras et al. (1997) Sanchez Contreras, C., Bujarrabal, V., & Alcolea, J. 1997, A&A, 327, 689
- Schöier & Olofsson (2000) Schöier, F. L. & Olofsson, H. 2000, A&A, 359, 586
- Schöier & Olofsson (2001) —. 2001, A&A, 368, 969
- Schmidt et al. (2002) Schmidt, G. D., Hines, D. C., & Swift, S. 2002, ApJ, 576, 429
- Silva et al. (1993) Silva, A. M., Azcarate, I. N., Poppel, W. G. L., & Likkel, L. 1993, A&A, 275, 510
- Sopka et al. (1989) Sopka, R. J., Olofsson, H., Johansson, L. E. B., Nguyen, Q.-R., & Zuckerman, B. 1989, A&A, 210, 78
- Su et al. (2001) Su, K. Y. L., Hrivnak, B. J., & Kwok, S. 2001, AJ, 122, 1525
- Su et al. (2003) Su, K. Y. L., Hrivnak, B. J., Kwok, S., & Sahai, R. 2003, AJ, 126, 848
- Su et al. (2000) Su, K. Y. L., Kwok, S., & Hrivnak, B. J. 2000, American Astronomical Society Meeting, 197, 0
- Su et al. (1998) Su, K. Y. L., Volk, K., Kwok, S., & Hrivnak, B. J. 1998, ApJ, 508, 744
- te Lintel Hekkert et al. (1991) te Lintel Hekkert, P., Caswell, J. L., Habing, H. J., et al. 1991, A&AS, 90, 327
- van de Steene & van Hoof (2003) van de Steene, G. C. & van Hoof, P. A. M. 2003, A&A, 406, 773
- van de Steene et al. (2000) van de Steene, G. C., Wood, P. R., & van Hoof, P. A. M. 2000, in ASP Conf. Ser. 199: Asymmetrical Planetary Nebulae II: From Origins to Microstructures, 191–+
- van der Veen et al. (1989) van der Veen, W. E. C. J., Habing, H. J., & Geballe, T. R. 1989, A&A, 226, 108
- van Zadelhoff et al. (2002) van Zadelhoff, G.-J., Dullemond, C. P., van der Tak, F. F. S., et al. 2002, A&A, 395, 373
- Weintraub et al. (1998) Weintraub, D. A., Huard, T., Kastner, J. H., & Gatley, I. 1998, ApJ, 509, 728
- Woods et al. (2003a) Woods, P. M., Millar, T. J., Herbst, E., & Zijlstra, A. A. 2003a, A&A, 402, 189
- Woods et al. (2002) Woods, P. M., Millar, T. J., Zijlstra, A. A., & Herbst, E. 2002, ApJ, 574, L167
- Woods & Nyman (2004) Woods, P. M. & Nyman, L.-A. 2004, A&A, in prep.
- Woods et al. (2003b) Woods, P. M., Schöier, F. L., Nyman, L.-A., & Olofsson, H. 2003b, A&A, 402, 617
- Zijlstra et al. (2001) Zijlstra, A. A., Chapman, J. M., te Lintel Hekkert, P., et al. 2001, MNRAS, 322, 280
- Zuckerman & Lo (1987) Zuckerman, B. & Lo, K. Y. 1987, A&A, 173, 263
Appendix A Molecular line spectra


