Abstract
An analysis of the NICMOS Deep Field shows that there is no evidence of a decline in the bar fraction beyond z0.7, as previously claimed; both bandshifting and spatial resolution must be taken into account when evaluating the evolution of the bar fraction. Two main caveats of this study were a lack of a proper comparison sample at low redshifts and a larger number of galaxies at high redshifts. We address these caveats using two new studies. For a proper local sample, we have analyzed 134 spirals in the near-infrared using 2MASS (main results presented by Menendez-Delmestre in this volume) which serves as an ideal anchor for the low-redshift Universe. In addition to measuring the mean bar properties, we find that bar size is correlated with galaxy size and brightness, but the bar ellipticity is not correlated with these galaxy properties. The bar length is not correlated with the bar ellipticity. For larger high redshift samples we analyze the bar fraction from the 2-square degree COSMOS ACS survey. We find that the bar fraction at z0.7 is 50%, consistent with our earlier finding of no decline in bar fraction at high redshifts.
[Barred Galaxies] Using Bars As Signposts of Galaxy Evolution at High and Low Redshifts
1 Bars: Signposts of Galaxy Evolution
Bars are ubiquitous in local disk galaxies (e.g., RC3, Eskridge et al. 2000, Menendez-Delmestre et al. 2004). They play an important role in evolving galaxies by transporting vast amounts of gas to the center (Sakamoto et al. 1997; Sheth et al. 2004), igniting circumnuclear starburst activity (Ho et al. 1997 and references therein), reducing the chemical abundance gradient (Martin & Roy 1997), and perhaps feeding black holes (Shlosman et al. 1988, see Knapen and Laurikainen in this volume). Bars also form bulges, and perhaps evolve galaxies along the Hubble sequence (e.g., Norman, Sellwood & Hasan 1996; see also Kormendy, Bournaud, and Combes in these proceedings). At high redshifts bars were expected to be fairly common because of dynamically colder disks and increased merging activity. So it was a surprise when the first studies of high redshift galaxy morphology found an apparent paucity of barred spirals beyond z0.5–0.7 (van den Bergh et al. 1996; Abraham et al. 1999; van den Bergh et al. 2000). If true these results set strict constraints on cosmological simulations of galaxy formation by requiring that disks were not sufficiently massive, or were dynamically too hot until only 6 Gyr ago. These constraints would be in stark contrast to conclusions from studies of the cosmic star formation history (e.g., Steidel et al. 1999 and references therein) and thinness of local disks (e.g., Toth & Ostriker 1992) which argue that massive disks were already in place by z1.
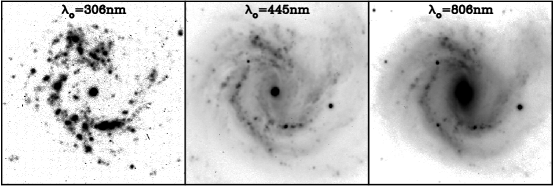
Bunker (1999) used a near-infrared 1.6m NICMOS GTO image to show that in at least one galaxy, a bar was missed by the early studies because they observed the high redshift galaxies in the rest-frame blue / ultraviolet light where bars are difficult to identify. The increasingly better visibility of bars at longer wavelengths is a well-known effect (see for example Figure 1, and Menendez-Delmestre et al and references therein in these proceedings). We decided to investigate whether the apparent decline in the bar fraction at high redshifts could be due to such a selection effect? This question was the focal point of Sheth et al. (2003) and whose results we briefly summarize here.
2 The Bar Fraction in the NICMOS Deep Field
We analyzed the bar fraction and bar properties in the WFPC2 (V, and I-band) and NICMOS (H-band data) for the northern Hubble Deep Field (Williams et al. 1996; Dickinson et al. 2000). The NICMOS data are ideal for studying galaxies in the redshift range 0.7,z1 because these data observe the galaxies in rest-frame V through I-band light.
The Bar Identification Technique
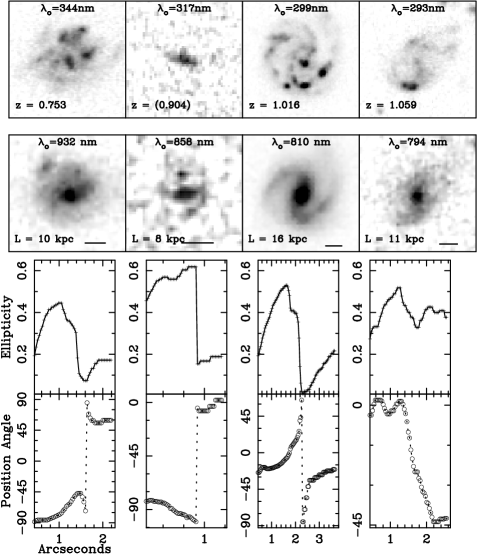
In contrast to previous studies which identified bars by eye, by ellipticity breaks, or a change in isophote position angles between an inner and outermost isophote (e.g., van den Bergh 1996; Abraham et al. 1999;), we applied a more stringent two signature criteria to identify bars. We demanded that a) the ellipticity increase monotonically and then drop with a sharp change of at least ¿ 0.1, and b) the position angle remain constant over the bar region and change by PA ¿ 10∘ after the bar region. We require that the bar be symmetric by fixing the center for the galaxy fitting algorithm. Our algorithm misses bars if the galaxy is highly inclined, if the bar position angle is the same as the galactic disk, if the underlying galactic disk is too faint to be adequately imaged, or if the data have inadequate resolution to resolve bars. Our method, though perhaps overly strict, has the advantage of ensuring a firm lower limit to the bar fraction.
As discussed in Sheth et al. (2003), at z 0.7, we identify five barred spirals, and two candidate barred spirals, consistent with the prior analysis of the HDFN by Abraham et al. (1999). At z 0.7 we identify four barred spirals and five candidate barred spirals, including two possible candidates at z=1.66 and z=2.37. The four barred spirals are shown in Figure 2. For comparison, in the previous WFPC2 HDFN studies, van den Bergh et al. (1996) found no barred spirals, and Abraham et al. (1999) found two barred galaxies beyond z0.5. If we use the Abraham et al. (1999) magnitude cutoff of I(AB)=23.7, the total number of disk-like galaxies drops to 31; amongst these we identify three barred spirals. Though we detect a few more bars, the total number of barred spirals is still small. Does this reflect a true decline in the bar fraction at z 0.7? We argue that when the spatial resolution of the observations are considered in the context of bar visibility, there is no evidence of a decline in bars at z0.7.
Spatial Resolution & the Visibility of Bars
In Figure 3, we show the apparent angular size of various galactic structures as a function of redshift. Overlaid are detection limits for various telescopes adopting a five PSF detection threshold; five PSFs is an appropriate choice (Menendez-Delmestre et al. 2004, also in this volume). The figure shows that at 0.8m WFPC2 data is only marginally capable of detecting a 5 kpc structure beyond z0.7. The NICMOS data have even coarser resolution (longer and larger pixels), and even though these data are not affected by bandshifting until z 2–3, they only detect structures with sizes 10 kpc. The average size of the four bars identified at z 0.7 is 12 kpc.

The most important point of note from Figure 3 is that a measurement of the bar fraction must take into account the size of bars and the available spatial resolution of the data. Although we only detect three or four bars in the NICMOS data one must note that these data are biased towards detecting only the largest bars. Therefore, when we compare the bar fraction at different redshifts, we must compare the fraction for bars of equal sizes. For a representative sample of local galaxies (SONG, Regan et al. 2001, Sheth et al. 2004), we find that bars with sizes 12 kpc are rare; only one out of 44 galaxies in SONG has a bar larger than 12 kpc. Thus the fraction of bars we detected in the NICMOS Deep Field (4/95 galaxies for the entire sample, or 3/31 galaxies using an I-magnitude cutoff) is similar, and perhaps even, larger than the bar fraction seen in SONG. Thus we concluded that there was no evidence for a decline in the bar fraction at z 0.7, as previously claimed.
Our results are hampered by small number statistics (we discovered only a handful of bars at z ¿ 0.7 and our local comparison sample contained forty four galaxies), and difficulty in defining comparable samples at high and low redshifts (see Sheth et al. 2003). From the existing analysis, it is difficult to conclusively state how the bar fraction varies as a function of redshift, and how the bar properties vary. In the next two sections we outline new results from two separate on-going studies aimed at overcoming these two main caveats of our NICMOS study.
3 Defining a Proper Local Sample: The 2MASS Local Galaxy Atlas
How well do we know the fraction of nearby bars? What are their properties (size, strength)? How do these properties depend on the host galaxy properties? Answers to these questions are of fundamental importance before any comparison is made to the high redshift Universe.
Since bars are best studied in the infrared, we decided to address all of these questions using the 2MASS Large Galaxy Sample. Results of this study were presented in a poster at this conference by Menendez-Delmestre. We chose all spirals of type Sa-Sd, with 650 for a sample of 134 galaxies in J+H+K. We ran the same ellipse fitting algorithm on these galaxies as we did previously on the high redshift sample and identified bars using the two signature criteria described above.
As shown in Figure 2 of Menendez-Delmestre et al. (this volume), the fraction of barred spirals in the 2MASS sample is 58% (see Figure 1 in Menendez-Delmestre et al.). Another 21% of the galaxies are identified as candidate bars where usually there is an ellipticity signature but no corresponding position angle change. We examined each of the candidate bars by eye and found that about two-thirds of the candidates were in fact barred. So the total fraction of barred spirals in the infrared 72%, similar to the fraction found by Eskridge et al. (2000). The bar fraction changes slightly with the T-type with the highest fraction (80%) in T=3 but there is no significant trend in the fraction with the Hubble type. Unfortunately the 2MASS sample has low signal to noise and we were unable to quantify the bar fraction in galaxies of type later than Sd. Note that the overall bar fraction in RC3 is lower, but not significantly different than the 2MASS fraction. This suggests that overall the change in the bar fraction between B-band (RC3) and the near-infrared is not large but also note that the effect may become severe at wavelengths shorter than the B-band, as shown by Figure 1.

For the 78 barred spirals in 2MASS, we derive a median deprojected bar semi-major axis of 5.1 kpc. This result is different from the SONG sample we considered in Sheth et al. (2003). The reason for the difference is that 2MASS surveys a larger volume but is shallower. As a result we observe larger and brighter galaxies which tend to have longer bars (see below). We measure a mean ellipticity of 0.45 but the most notable result from the distribution of ellipticities is the scarcity of thin bars (). Previously similar results have been interpreted as evidence for a second or later generation of bars (e.g., Block et al. 2002, see also Bournaud, Combes in this volume) because in numerical simulations the first generation of bars is expected to be strong (thin) whereas subsequent generations are expected to be weaker (fatter). However note that the measurement of ellipticity can be affected by bulge light. Ellipse fitting does not automatically account for bulge light and as a consequence gives a higher ellipticity than the actual value. When we compare the bar ellipticity and bar length we find no correlation indicating that larger bars are preferentially fatter or thinner. We find that bars come in all shapes and sizes.
How do the bar properties depend on the host galaxy? From the 2MASS data, we find a trend of larger bars in larger and brighter galaxies (Figures 4). This is expected given that the bar instability is correlated with the mass of the disk.
Correlations of the bar strength (we use ellipticity as a proxy for strength) and the host galaxy parameters are very weak (Figures 5). Unlike the bar length, there is no correlation between the bar ellipticity and galaxy size or brightness.

Note that these correlations are not immune to biases in the analysis. For instance the ellipse fitting technique always underestimates the bar ellipticity (Sheth et al. 2000, 2004) because the bulge light affects the galaxy isophotes to make the fitted ellipses fatter/thicker than the real underlying bar. Hence the lack of “strong” bars in early-Hubble type galaxies is not necessarily a real effect. Another bias is related to resolution. Small bars are difficult to identify especially in galaxies with bright bulges and nuclei. So any trend of larger bars in earlier type galaxies should also be viewed with caution. Nevertheless the trends of larger bars in larger galaxies and brighter galaxies are relatively robust.
4 COSMOS: Overcoming Small Number Statistics
The 2MASS analysis by Menendez-Delmestre et al. (2004) offers an excellent analysis of the local sample of bars and their host galaxies. We can now extend these results to higher redshifts to understand how the bar fraction and bars evolved over time.
Until recently, the Hubble Deep Fields were the standard windows into the high redshift Universe. These data already indicated that defining a comparative sample at high redshifts is difficult. For example the fraction of irregular objects increases to nearly 30% to z1 (e.g., Griffiths et al. 1994, Abraham et al. 1996). Lilly et al. (1996) concluded that disks evolve passively in luminosity whereas Shude et al. (1998) argue in favor of significant evolution. Certainly some of these discrepancies are a result of cosmic variance and scarcity of high quality data. These gaps, however, are now being filled with surveys like GOODS, UDF, DEEP2, and GEMS.
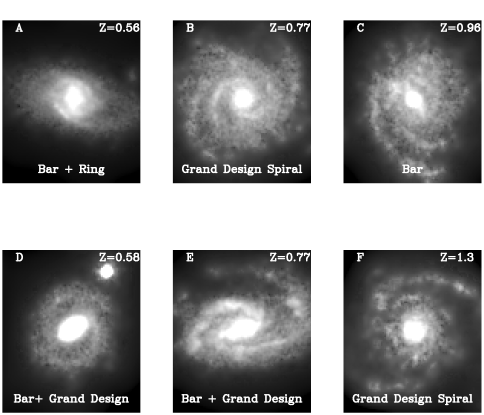
The most ambitious and revolutionary new survey is COSMOS (http://www.astro.caltech.edu/cosmos) which is observing a contiguous 2-square degree equatorial field using the Advanced Camera for Survey on the Hubble Space Telescope, and multi-wavelength data from X-rays to radio. The size of the field is important because it overcomes cosmic variance and provides a truly representative view of the high redshift Universe. COSMOS is an ideal treasury program with a vast range of applications. In particular, for the study of galaxy morphology COSMOS is a gold mine (or more appropriately for this conference, a diamond mine) of opportunity. It will provide spectroscopic redshifts for over 100,000 galaxies with 10,000 galaxies in each of five bins of from z=0.5 to z=2. The spatial resolution of ACS data is exquisite. As shown in Figure 3, one can easily identify structures with sizes as small as 3 kpc in diameter. If Figure 6 we show some typical examples of disk galaxies at three photometrically determined redshifts.
The Bar Fraction in COSMOS
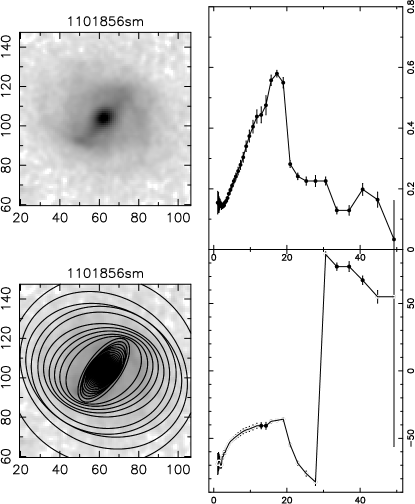
In order to image such a large field with adequate sensitivity (COSMOS is within half a magnitude of the GOODS data) we chose to use the broader I-band filter over the z-band filter for COSMOS. Hence the analysis of the bar fraction can be done with full confidence to z0.7–0.8 and perhaps to even higher redshifts. To date approximately 200 fields out of 600 have been observed. For these fields we first identified a sample of spiral galaxies from a photometric catalog derived from BVRIz data from observations on the Subaru teelscope for the entire COSMOS field. We only chose those galaxies that had photometric redshifts derived with the highest confidence (95%). We ran the same ellipse fitting algorithm on these galaxies. An example of such a fit is shown in Figure 7. We have done a preliminary analysis for the redshift bin 0.6 z 0.8 for 700 galaxies. We find that the fraction of barred spirals is 50%, consistent with the local fraction. Although further analysis is necessary with better redshifts and the complete sample, the results already indicate that the bar fraction is not declining significantly, at least out to z0.8.
1
References
- [Abraham et al.(1996)] Abraham, R. G., Tanvir, N. R., Santiag o, B. X., Ellis, R. S., Glazebrook, K., van den Bergh, S. 1996, MNRAS, 279, L47
- [Abraham et al.(1999)] Abraham, R. G., Merrifield, M. R., Ell is, R. S., Tanvir, N. R., & Brinchmann, J. 1999, MNRAS, 308, 569
- [Block et al.(2002)] Block, D.L., Bournard, F., Combes, F., Puerari, I., & Buta, R. 2002, A&A, 394, 35
- [Bunker(1999)] Bunker, A,J. 1999, in “Photometric Redshifts and the Detection of High Redshift t Galaxies”, ASP Conference Series, Vol. 191, Eds. Weymann, R., Storrie-Lombard i, L., Sawicki, M., & Brunner, R.
- [Dickinson et al.(2000)] Dickinson, et al. 2000, ApJ, 531, 624
- [Eskridge et al.(2000)] Eskridge, P., et al. 2000, AJ, 119, 536
- [Griffiths et al.(1994)] Griffiths, R. E. et. al. 1994, ApJL, 435, 19
- [Ho, Filippenko, & Sargent(1997)] Ho, L. C., Filippenko, A. V., & Sargent, W. L. W. 1997, ApJ, 487, 591
- [Lilly et al.(1996)] Lilly, S., Lefevre, O., Hammer, F., Cramp ton, D., Schade, D. J., Hudon, J. D., Tresse, L. 1996, IAUS, 171, 209
- [Martin & Roy(1994)] Martin, P., & Roy, J. 1994, ApJ, 424, 599
- [Norman, Sellwood & Hasan(1996)] Norman, C. A., Sellwood, J. A., & Hasan, H. 1996, ApJ, 462, 114
- [Regan et al.(2001)] Regan, M. W., Helfer, T. T., Thornley, M. D., Sheth, K., Wong, T., Vogel, S. N., Blitz, L., & Bock, D. C.-J. 2001, ApJ, 561, 218
- [Sakamoto et al.(1999)] Sakamoto, K., Okumura, S. K., Ishizuki, S., Scoville, N. Z. 1999, ApJ, 525, 691
- [Sheth et al.(2000)] Sheth, K., Regan, M.W., Vogel, S.N., & Teuben, P.J. 2000, ApJ, 532, 221
- [Sheth et al.(2003)] Sheth, K., Regan, M.W., Scoville, N.Z., & Strubbe, L.E. 2003, ApJL, 592, 13
- [Sheth et al.(2004)] Sheth, K., Vogel, S. N., Regan, M. W., Teuben, P.J., Harris, A. I., Thornley, M. D., & Helfer, T.T. 2004, ApJ, submitted
- [Shude, Mo, & White(1998)] Shude, M., Mao, H. J. & White, S. D. M. 1998, MNRAS, 297, L71
- [Steidel(1999)] Steidel, C.C. 1999, PNAS, 96, 4232
- [Toth & Ostriker(1992)] Toth, G., & Ostriker, J.P. 1992, ApJ, 389, 5
- [van den Bergh et al.(1996)] van den Bergh, S., Abraham, R. G ., Ellis, R.S., Tanvir, N. R., Santiago, B., & Glazebrook, K. G. 1996, AJ, 112, 359
- [van den Bergh et al.(2000)] van den Bergh, S., Cohen, J., Ho gg, D. W., & Blandford, R. 2000, AJ, 120, 2190
- [van den Bergh et al.(2002)] van den Bergh, S., Abraham, R.G ., Whyte, L.F., S. K., Ishizuki, S., Scoville, N. Z. 1999, ApJ, 525, 691