Abstract
We determine a firm lower limit to the bar fraction of 0.58 in the nearby universe using J+H+K-band images for 134 spirals from 2MASS. With a mean deprojected semi-major axis of 5.1 kpc, and a mean deprojected ellipticity of 0.45 this local bar sample lays the ground work for studies on bar formation and evolution at high redshift.
[Barred Galaxies] How Barred is the NIR Nearby Universe? An analysis using 2MASS
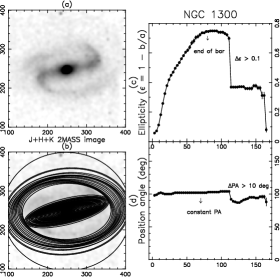
The Two Micron All Sky Survey (2MASS) offers a rich source of images for nearby galaxies in K-band, the optimal band for detecting bars. We selected all spiral galaxies (S0/a–Sd) with , which resulted in a final sample size of 134 spirals. We analysed each galaxy using ellipse-fitting to detect the presence of bars (Fig. 1) and characterise their properties. Our method consists of two signature criteria (, ) that can be applied to any sample. We find a firm lower limit to the bar fraction of 0.58, which is not significantly different from the fraction inferred from B-band observations (de Vaucouleurs, RC3). This indicates that bar morphology is still recognizable in B-band. However, bar properties are better traced in K-band, where star formation and dust obscuration are less severe. We found that bars occupy in average 35% of the galaxy disk, with a mean bar axial ratio very close to 2:1 (Fig. 2). A marked dearth of strong bars is in agreement with previous studies (Buta & Block, 2001) and has been interpreted as an indication that bars at the current epoch are a second, third, or later generation (Bournaud & Combes 2002). A slight trend between the bar size and the galaxy size/brightness is also found: larger bars appear to live in larger and more massive galaxies. However, no similar trend with the bar strength was found. For more details on the method and analysis, refer to Sheth et al in this volume.
Our study of bar length and ellipticity sets the stage for the evolution of these properties as a function of redshift. Results from high redshift studies (e.g., Sheth et al. 2003) may then be compared to this nearby sample in order to put more stringent constraints on bar evolution and, ultimately, galaxy evolution.
1
References
- [Buta & Block(2001)] Buta, R., & Block, D.L. 2001, ApJ, 550, 243
- [Bournaud & Combes(2002)] Bournaud, F., & Combes, F. 2002, A&A, 392, 83
- [Sheth et al.(2003)] Sheth, K., Regan, M.W., Scoville, N.Z., & Strubbe, L.E. 2003, ApJL, 592, 13