SCALING LAWS FOR DARK MATTER HALOS IN LATE-TYPE AND DWARF SPHEROIDAL GALAXIES
Abstract
Published mass models fitted to galaxy rotation curves are used to study the systematic properties of dark matter (DM) halos in late-type and dwarf spheroidal (dSph) galaxies. Halo parameters are derived by fitting non-singular isothermals to , where is the observed rotation curve and is the rotation curve of the visible matter. The latter is calculated from the surface brightness assuming that the mass-to-light ratio is constant with radius. “Maximum disk” values of are adjusted to fit as much of the inner rotation curve as possible without making the halo have a hollow core. Rotation curve decomposition becomes impossible fainter than absolute magnitude , where becomes comparable to the velocity dispersion of the gas. To increase the luminosity range further, we include dSph galaxies, which are physically related to spiral and irregular galaxies. Combining the data, we find that DM halos satisfy well defined scaling laws analogous to the “fundamental plane” relations for elliptical galaxies. Halos in less luminous galaxies have smaller core radii , higher central densities , and smaller central velocity dispersions . Scaling laws provide new and detailed constraints on the nature of DM and on galaxy formation and evolution. Some simple implications include:
1 – A single, continuous physical sequence of increasing mass extends from dSph galaxies with to Sc I galaxies with .
2 – The high DM densities in dSph galaxies are normal for such tiny galaxies. Since virialized density depends on collapse redshift , , the smallest dwarfs formed at least earlier than the biggest spirals.
3 – The high DM densities of dSphs implies that they are real galaxies formed from primordial density fluctuations. They are not tidal fragments. Tidal dwarfs cannot retain even the low DM densities of their giant-galaxy progenitors. In contrast, dSphs have higher DM densities than do giant-galaxy progenitors.
4 – The fact that, as luminosity decreases, dwarf galaxies become much more numerous and also more nearly dominated by DM raises the possibility that there exists a large population of objects that are completely dark. Such objects are a canonical prediction of cold DM theory. If they exist, “empty halos” are likely to be small and dense – that is, darker versions of Draco and UMi.
5 – The slopes of the DM parameter correlations provide a measure on galactic mass scales of the slope of the power spectrum of primordial density fluctuations. Our preliminary results not yet corrected for baryonic compression of DM give . This is consistent with cold DM theory.
Department of Astronomy, The University of Texas at Austin, 1 University Station C1400, Austin, TX 78712-0259, USA
Research School of Astronomy and Astrophysics, Mount Stromlo Observatory, The Australian National University, Cotter Road, Weston Creek, Canberra, ACT 72611, Australia
1. Introduction
This paper updates our derivation (Kormendy 1988, 1990; Kormendy & Freeman 1996) of scaling laws for DM halos of Sc – Im and dwarf spheroidal (dSph) galaxies. We show that DM halos in less luminous galaxies have smaller core radii , higher central densities , and smaller central velocity dispersions . These scaling laws are analogous to the fundamental plane relations for elliptical galaxies (Djorgovski & Davis 1986, 1987; Faber et al. 1987; Dressler et al. 1987; Djorgovski, de Carvalho, & Han 1988; see Kormendy & Djorgovski 1989 for a review), and they are interesting for the same reason: they provide new constraints on galaxy formation and evolution. Simple conclusions are discussed in § 4. A detailed discussion will be published in Kormendy & Freeman (2003).
Halo parameters for giant galaxies are derived by decomposing rotation curves into visible matter and DM contributions (van Albada et al. 1985). At galaxy absolute magnitudes , rotation curve decomposition becomes impossible as decreases (Tully & Fisher 1977) and becomes similar to the velocity dispersion of the gas. Pressure-supported galaxies are not flat. DM central densities can still be derived, e. g., by fitting King (1966) models to the density and velocity dispersion profiles of dSph galaxies. But DM and can no longer be measured. In this paper, we combine these data to investigate the systematic properties of DM halos over a large range of galaxy luminosities.
Only Sc – Im and dwarf spheroidal (dSph) galaxies are included. Galaxies of type E – Sbc are omitted for two reasons that result from their bulge components. (1) Rotation curve decomposition must deal with two visible-matter components that have different unknown mass-to-light ratios. Therefore it is less reliable. (2) Gravitational compression of the DM by the baryons has substantially modified the halo when the visible mass density is high. Many Sa – Sbc galaxies satisfy the DM correlations, but others deviate in the direction of small and large (Kormendy 1988, 1990). This is consistent with baryonic compression. Further evidence for baryonic compression is presented in Athanassoula, Bosma, & Papaioannou (1987, hereafter ABP). Baryonic compression corrections are omitted here but will be included in Kormendy & Freeman (2003).
2. Core Parameters of DM Halos
2.1. Rotation Curve Decomposition. I. Technique
Consider first the rotation curve of an isothermal sphere in the ideal case where we can measure a massless disk embedded in it. Then at ,
| (1) |
and at ,
| (2) |
where is the gravitational constant. If we observe only the part of the rotation curve, we can measure but not or . Because of this, is often the only halo parameter that we can measure in low-luminosity galaxies. In contrast, if the measurements reach far enough into the constant part of the rotation curve, then all three parameters can be measured. Dwarf Sc – Im galaxies come closest to the above ideal, because visible matter contributes only a small fraction of the total mass.
More generally, visible matter dominates the central part of the rotation curve, and a multicomponent mass model is required. The rotation curve of the visible matter is calculated from the brightness distribution assuming that the mass-to-light ratio of each component is constant with radius. Values of are adjusted to fit as much of the inner rotation curve as desired. H I gas is taken into account separately. Molecular gas is assumed to follow the light distribution, so it is included in . Then, given the total rotation curve of the visible matter, the halo rotation curve is . A model such as an isothermal is then fitted to to derive the halo asymptotic velocity , , and . Rotation curve decompositions have now been published for galaxies. Of these, 55 survive our selection cuts (§ 2.3).
2.2. Rotation Curve Decomposition. II. Our Assumptions
Many authors emphasize that mass modeling is uncertain (van Albada et al. 1985; Skillman et al. 1987; Lake & Feinswog 1989). Lake and Feinswog point out that if measurement errors are interpreted strictly, few observations of rotation curves reach large enough radii to determine halo parameters uniquely. Therefore the present results depend on the following assumptions:
1 – Rotation curves that flatten out to constant are assumed to stay flat outside the radius range measured.
2 – We use maximum disk decompositions. This requires discussion. The unknown mass-to-light ratio of the disk is a problem – the ratio of visible to dark mass can be varied greatly while preserving a good fit to . As the amount of visible mass is reduced, the central DM density must be increased and its core radius must be decreased. The extreme models (van Albada et al. 1985, Fig. 4 and 8) are usually the maximum disk mass that does not require the halo to have a hollow core and a solution with . In giant galaxies, these solutions are very different. If we had no additional constraints, we could say little about halo properties. Fortunately, we have other constraints. We cannot let get arbitrarily small. We observe structures such as bars and spiral density waves that require disks to be self-gravitating. ABP turned this qualitative remark into a practical constraint on by applying Toomre’s (1981) swing amplifier instability criterion and requiring that the disk have the proper density to give the observed spiral structure (i. e., two arms but not one). The results converged on essentially the maximum disk solutions for 18 of 21 Sc – Im galaxies studied. The resulting mass-to-light ratios imply plausible young stellar populations. In general, some evidence favors maximum disks (e. g., Taga & Iye 1994; Sackett 1997; Debattista & Sellwood 1998; Bosma 1999; Sellwood & Moore 1999; Weiner, Sellwood, & Williams 2001; Gerhard 2004; Athanassoula 2004; Weiner 2004), and other evidence suggests that some disks are submaximal (e. g., Bottema 1993, 1997; Courteau & Rix 1999). Our choice of maximum disk solutions affects only giant galaxies; dwarfs are so DM dominated that uncertainties have little effect. If we used “Bottema disks” instead of maximum disks, parameter correlations with galaxy luminosity would be shallower.
3 – Halo are assumed to have non-singular isothermal mass distributions. IAU Symposium 220 focuses in part on the well known collision (Moore 1994) between the prediction that cold DM (CDM) has cuspy central density profiles (e. g., Navarro, Frenk, & White 1996, 1997 [NFW], who find that ) and observational evidence that at least dwarf galaxies have flat cores. For the purposes of this paper, the difference between isothermals and NFW profiles is nontrivial but relatively benign. An analogous problem arose with elliptical galaxies: Early studies of cores, including the discovery of fundamental plane correlations (Kormendy 1984; Lauer 1985; Kormendy 1987b, c), were published before Hubble Space Telescope (HST) showed that high-luminosity ellipticals have cuspy cores with projected densities , to 0.25 at small radii (e. g., Lauer et al. 1995). But pre-HST observations of core radii and central densities probe the same physics as (and, in fact, are roughly proportional to) HST measurements of profile break radii and densities (Kormendy et al. 1994). Most results deduced from ground-based photometry remain valid. We expect that the present DM parameters will prove to measure the relevant physics when the form of the halo density profile is better known. That is, we consider as an approximate profile break radius and as a measure of the density at or averaged inside ; this should be valid whether halos are isothermal or not.
2.3. Rotation Curve Decomposition. III. Galaxy Selection Criteria
We take DM parameters from published decompositions with as few changes as possible consistent with the assumption that halos are isothermal, with a uniform distance scale, and with the following selection criteria:
1 – Morphological types are restricted to Sc – Im and dSph, as noted above. Late-type and spheroidal galaxies are physically related (Kormendy 1985, 1987c; Binggeli & Cameron 1991; Ferguson & Binggeli 1994). Most dSph companions of our Galaxy have had episodes of star formation in the past 1 – 8 Gyr (Da Costa 1994 and Mateo 1998 provide reviews); they presumably turned from irregulars into spheroidals since that time (Kormendy & Bender 1994). In fact, the distinction between galaxy types has blurred as H I gas has been found in or near a few spheroidals (e. g., Sculptor: Knapp et al. 1978; Carignan et al. 1998; see Mateo 1998 for a review). It seems physically reasonable to include Sc – Im and dSph galaxies in the same parameter correlation diagrams.
2 – We discard most galaxies with inclinations . Broeils (1992) remarks that H I rotation curve derivations are less accurate when the galaxy is too face-on. Also, there is some danger that oval distortions (Bosma 1978; Kormendy 1982) result in incorrect estimates of inclinations. Because they provide much-needed leverage at high luminosities, we kept four galaxies from ABP: M 101, NGC 5236, NGC 6946, and IC 342. Inclination is not a critical selection criterion; most nearly face-on galaxies satisfy the DM correlations.
3 – The most important selection cut is to ensure that rotation curves reach large enough radii to constrain the DM parameters. After some experimentation, we decided to require that the rotation curve measurements reach out to at least 4.5 exponential scale lengths of the disk. The peak in for an exponential occurs at 2.2 scale lengths (Freeman 1970), so the above choice ensures that the outer disk rotation curve drops significantly over the radius range in which we have velocity data. Observing a flat rotation curve then provides good constraints on DM parameters. The fussy choice of the ratio 4.5 resulted from a desire to keep a few galaxies that provide leverage at the high-luminosity end of the correlations. The radius cut is not applied slavishly; we keep a few galaxies that slightly violate the above criterion (ratio 3.5 – 4.4) but that are sufficiently halo dominated that the DM parameters are well determined. These galaxies are DDO 127, DDO 154, DDO 168, NGC 247, and IC 2574. In general, the radius cut is important; if we do not use it, we get a substantially larger galaxy sample, and it mostly is consistent with the DM correlations, but it shows considerably larger scatter than Figures 2 – 4.
Besides the selection cuts, we adopt the following procedures to make parameters from different sources be as consistent with each other as possible.
Following Broeils (1992), we base distances on the Virgocentric flow model of Kraan-Korteweg (1986). However, the zeropoint is based on distances from Cepheids and from surface brightness fluctuations (Ferrarese et al. 2000; Tonry et al. 2001). The distance to the Virgo Cluster is taken to be = 16.5 Mpc, corresponding to a Hubble constant of km s-1 Mpc-1. The center of the Virgo Cluster is assumed to be at (, ) = (281∘, 75∘) (Binggeli, Tammann, & Sandage 1987). The Virgocentric infall velocity of the Local Group is assumed to be 220 km s-1. When accurate distances of our galaxies are known, e. g., from Cepheids, they are adopted. Most sources used essentially the above distance scale; when an author did not, we assumed that and that . This is not strictly correct, because gas and dynamical masses scale differently with distance. But the errors are small on the scales of Figures 2 – 4.
Galactic absorption corrections are from Burstein & Heiles (1984) or equivalently from the RC3 (de Vaucouleurs et al. 1991). Absolute magnitudes are corrected for internal absorption as in Tully & Fouqué (1985).
2.4. Matching Pseudo-Isothermal Models to the Isothermal Sphere
In carrying out rotation curve decompositions, some authors model the DM with a nonsingular isothermal sphere; then we adopt the parameters , , and without modification. Other authors use the “pseudo-isothermal sphere” (hereafter the PITS), i. e., the approximation that the volume density is
| (3) |
They then derive parameters , , and the asymptotic circular velocity as . No compelling physical argument favors one model over the other. However, if we want to combine data from different sources, we need to correct parameters determined using the PITS to the ones that would have have been measured using the isothermal. An exact correction is not possible, because equation (3) is a poor approximation to the isothermal sphere except as . Figure 1 shows three possible scalings of the rotation and velocity dispersion curves of the PITS to the isothermal. All three scalings are shown to emphasize the physical difference between the two models. The scalings are not equally plausible, but each has a simple underlying motivation. We will find that the best scaling is intermediate between the middle and right panels of Figure 1.

In all three scalings, the central densities of the two models are the same. The panels differ in how radii and velocities are scaled.
At left, the PITS is scaled in and so that the central densities and asymptotic circular velocities are the same. Then the core radius of the isothermal is . The dispersion scale in the top panel is the velocity dispersion of the isothermal sphere, but this is equal to the local dispersion of the PITS only as . For most galaxies, the H I distribution does not extend beyond . Here the local dispersion of the PITS is less than that of the isothermal (Fig. 1, top left). The reason is that an isotropic system with the density distribution of equation (3) is not isothermal; its velocity dispersion is
| (4) |
where . Since the analytic model matches the isothermal badly in both and , we discard this scaling.
Given the limited extent of H I data, it seems more realistic to scale the PITS so that its rotation curve is similar to that of the isothermal at . We get such a scaling (Fig. 1, right) if we solve our problem with the halo dispersion by making the velocity dispersion of the corresponding isothermal be equal to the central dispersion of the PITS. Then and . The resulting parameters are related in the normal way for an isothermal sphere, .
The virtue of this scaling is that the two halo rotation curves are similar over the radius range in which they are actually fitted to the data (Fig. 1, bottom right). However, there is a problem (Fig. 1, top right). This scaling forces to be much larger than the velocity of the flat part of the rotation curve. An examination of published decompositions shows that authors almost never extrapolate implicitly to such a large maximum rotation velocity – one that is never observed. The exceptions are some rotation curve decompositions in which over the whole radius range of the data, i. e., cases in which is completely unconstrained. Examples are the decompositions of NGC 7331 and NGC 6674 in Broeils (1992). We discard these decompositions anyway.
This suggests a compromise scaling like the one in the middle panel. Here is scaled to the maximum, not the asymptotic, rotation velocity of the isothermal. Then, when authors use equation (3) to derive , , and via rotation curve decomposition, we would adopt , the authors’ quoted value of , and a halo velocity dispersion . Again, these parameters are related as normal for an isothermal sphere.
In practice, there is no guarantee that any of the above scalings represents what happens when one author uses the PITS and another uses the isothermal in rotation curve decomposition. We note again that Figure 1 is included to emphasize that the PITS is not very isothermal. However, we will find in § 3 that enough decompositions have been published using each of the above models so that we can derive the DM parameter correlations separately for each model. We will then derive the best scaling of one model to the other by matching their respective DM correlations. This scaling is used to construct Figure 4, which combines data from all sources. It is intermediate between the middle and right-hand panels of Figure 1, i. e., ; , and .
2.5. Central Densities of Dwarf Spheroidal and Irregular Galaxies
The smallest dSph galaxies allow us to greatly increase our leverage on correlations of DM parameters with galaxy luminosity. Note that only the halo central density can be measured. Pioneering observations by Aaronson (1983) and by Aaronson & Olszewski (1987) showed that the stellar velocity dispersions in Draco and UMi are km s-1, much larger than expected if the galaxies are in equilibrium and if they consist only of old, metal-poor stars ( 2.5). High dispersions imply mass-to-light ratios . Moreover, the central DM densities to 1 pc-3 are “shockingly high. … Indeed, these are the highest central DM densities seen in any galaxy so far” (Kormendy 1987a). The latter result was an early sign of the correlations in Figures 2 – 4.
DM in dSph galaxies has important implications, so considerable effort has gone into trying to find some escape. Early worries included small-number statistics, measurement errors, atmospheric velocity jitter in the most luminous AGB stars, and especially unrecognized binary stars. These have largely been laid to rest as more and fainter stars have been measured, as the time baseline on measurements of individual stars has increased beyond a decade, and as different authors have proved to agree (e. g., Armandroff, Olswezski, & Pryor 1995; Olszewski, Pryor, & Armandroff 1996, see Tremaine 1987; Pryor 1992; Mateo 1994, 1997, 1998 for reviews). As the number of dSph galaxies with dispersion measurements has increased (above reviews and Mateo et al. 1998; Cook et al. 1999; Côté et al. 1999; and Gallart et al. 2001), escape routes that depend on rare events have become implausible. These include the suggestion (Kuhn & Miller 1989; Kuhn 1993) that the stars formerly in dSph galaxies are unbound because of Galactic tides, so we overestimate the masses of systems that are far from equilibrium. The required orbital resonance works best if the dispersion is only marginally larger than the escape velocity and if not too many systems need special engineering. But ratios of 10 – 100 (not 2.5!) imply velocities that are inflated by factors of . Piatek & Pryor (1995), Oh, Lin, & Aarseth (1995), Sellwood & Pryor (1998), Klessen, Grebel, & Harbeck (2003), and Wilkinson (2004) argue convincingly that tides do not inflate velocity dispersions this much, especially not without producing velocity gradients across the galaxies that would have been seen. This remains true even though apparently extratidal stars have been seen in some dSphs (e. g., Irwin & Hatzidimitriou 1995; Piatek et al. 2001, 2002; Palma et al. 2003). In addition, some dSph galaxies are too far from our Galaxy to be affected by tides (Mateo 1998). All nine dSph galaxies with dynamical analyses appear DM dominated. It has become difficult to argue that we get fooled by special circumstances.
One DM alternative is not addressed by the above arguments: Modified Newtonian Dynamics (Milgrom 1983a, b, c; Milgrom & Bekenstein 1987). MOND has been much debated in recent years and will be revisited during this conference. Thirty years of failure to identify all constituents of DM persuade us to treat even exotic alternatives with respect. However, while the jury is out, we assume conventional gravity and treat measurements of high velocity dispersions in dSph galaxies as detections of DM.
Accordingly, Figures 2 and 4 include DM central densities for all galaxies with tabulated in Mateo (1998) plus And II (Côté et al. 1999). This includes four dI galaxies with virial measurements of ; three of these are based on H I and one (LGS3) is based on stellar dynamics (Cook et al. 1999). The central mass density has been corrected for visible matter by subtracting 2.5 times the central, -band volume brightness. For all galaxies except Fornax, the correction is small. In Fornax (), visible matter accounts for approximately half of the central density. For this galaxy, is very uncertain.
The “error bars” on require discussion. The plotted densities are derived by assuming that is the same for the visible and dark matter. If as in the other galaxies in the figures, then is smaller by a factor of 0.46 (Pryor & Kormendy 1990; Lake 1990). Anisotropic velocity dispersions reduce estimates by as much as an order of magnitude over the isotropic case (Pryor & Kormendy 1990; Mateo et al. 1993), although the extreme models are not good fits to the data. Finally, model-independent lower limits to the DM density (Merritt 1987) are typically pc-3. These limits are mostly too weak to be interesting. However, for Leo II, UMi, and Draco, they are , , and , respectively. Even these low values are reasonably consistent with the extrapolation of the DM correlations to low luminosities.
3. DM Halo Scaling Laws
The correlations between halo , , and and galaxy absolute magnitude are illustrated in Figures 2 – 4. Figure 2 shows results derived using isothermal halos. Figure 3 shows results derived using pseudo-isothermal halos. Figure 4 combines all of the data, as discussed below.
The main result of this paper is that DM satisfies well defined scaling laws. Halos in less luminous galaxies have smaller core radii, higher central densities, and smaller central velocity dispersions.
The scatter about the correlations is slightly smaller in Figure 2 than in Figure 3. It is not surprising that decompositions based on the isothermal sphere are better behaved, given the slow rise of the PITS rotation curve to its asymptotic value (Fig. 1). However, rotation curve decompositions based on isothermal and PITS models separately give essentially the same correlations.
There are 31 galaxies with isothermal DM decompositions and 37 with PITS decompositions. Only 13 galaxies are common to both samples. So the results in Figures 2 and 3 are largely independent. Clearly, we want to combine the two samples. We do this by scaling the correlations in Figure 3 to those in Figure 2.
Least-squares fits to the correlations in Figure 2 (omitting NGC 4605) give:
| (5) | |||||
| (6) | |||||
| (7) | |||||
| (8) | |||||
| (9) | |||||
| (10) |
Least-squares fits to the correlations in Figure 3 give:
| (11) | |||||
| (12) | |||||
| (13) | |||||
| (14) | |||||
| (15) | |||||
| (16) |
The two samples have essentially the same average absolute magnitude: for objects analyzed with isothermals and for those analyzed with pseudo-isothermals. The average of the above values is . Requiring that the correlations agree at provides the scaling of the PITS results to those measured with the isothermal sphere (ITS):
| (17) | |||||
| (18) | |||||
| (19) |
Here we explicitly identify the parameters derived with the different DM models. This scaling is intermediate between the middle and right panels of Figure 1.
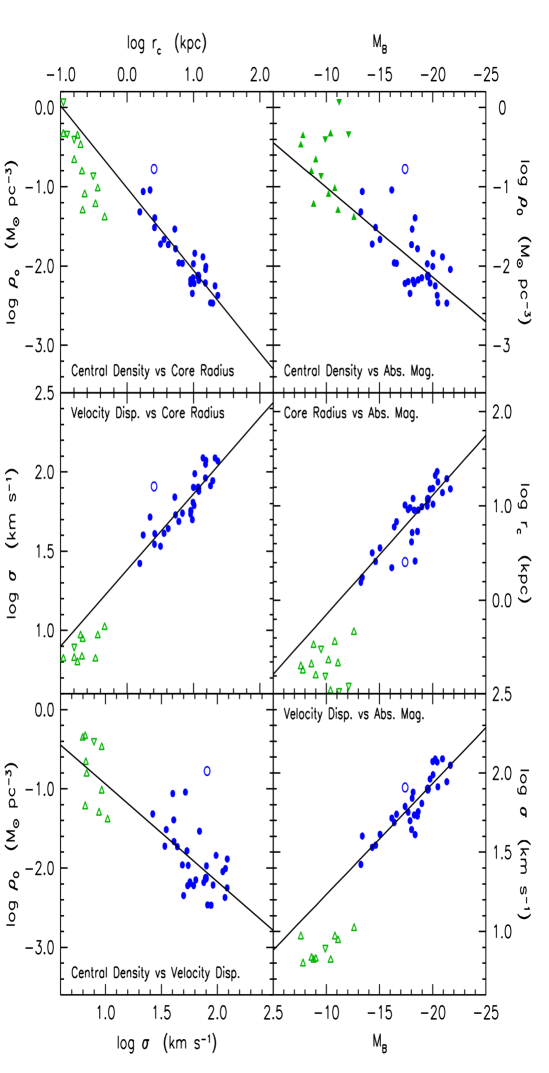
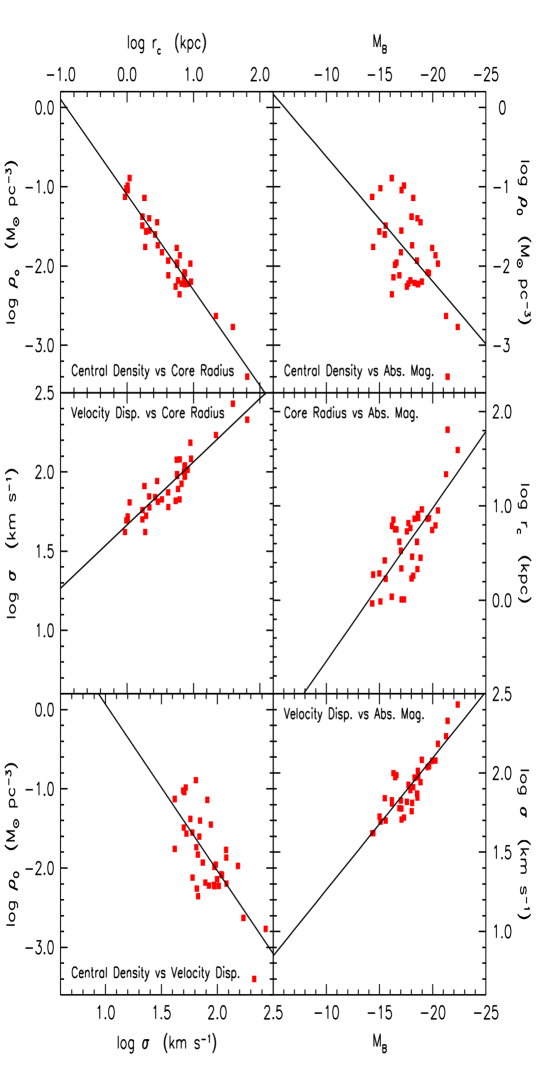
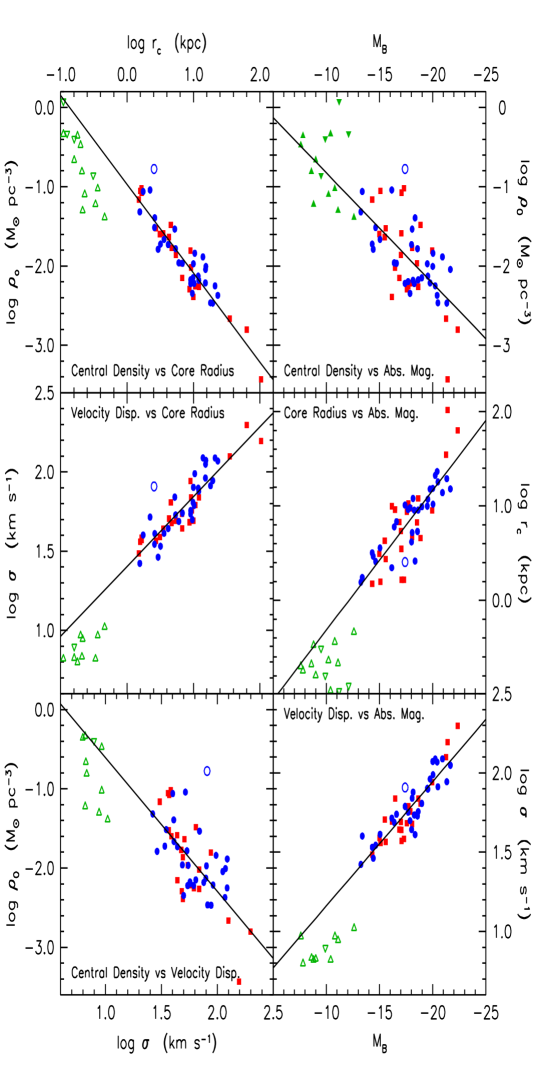
Figure 4 shows the combined sample after scaling of the pseudo-isothermal results to those determined with isothermal halos. Based on 55 galaxies spanning 9 magnitudes in , the correlations are quite robust. Uncertainties in rotation curve decomposition are unlikely to threaten them, although the slopes are still uncertain. If we keep only the galaxies with the most leverage on the DM, say the 11 galaxies whose rotation curves reach out to at least 10 times the scale length of the disk (one of these is NGC 3198, in which the ratio is 11.4), then we get essentially the same correlations with essentially the same scatter. Least-squares fits to the points in Figure 4 give:
| (20) | |||||
| (21) | |||||
| (22) | |||||
| (23) | |||||
| (24) | |||||
| (25) |
In physically more transparent terms ( is ),
| (26) | |||||
| (27) | |||||
| (28) | |||||
| (29) | |||||
| (30) | |||||
| (31) | |||||
| (32) |
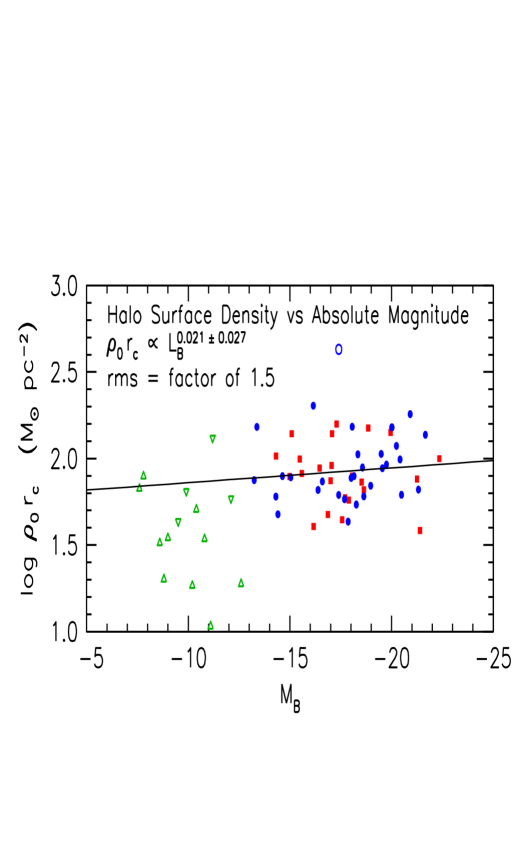
Equations 26 and 27 imply that halo surface density, which is proportional to , is nearly independent of galaxy luminosity. This near-independence is illustrated explicitly in Figure 5. It implies a Tully-Fisher (1977) relation similar to equation 29 (cf. Fall 2002). Since mass and since constant, . Then implies that . We find that . This suggests that . If we correct for the slight dependence of halo surface density on (Fig. 5), then this becomes . Slope uncertainties are significant, so we should be cautious in how much we interpret this result. However, it is a plausible estimate of the degree to which small galaxies are more DM dominated than large ones. UGC 2885 () is brighter than UMi () by 14.7 mag. Over 15 mag, implies that changes by a factor of 26. This is entirely reasonable.
4. Conclusions
Scaling laws are new constraints on the nature of DM and on galaxy formation and evolution. Most of these remain to be explored. Simple implications include:
1 – The surprisingly high DM densities in dwarf spheroidals are normal for galaxies of such low luminosity. This implies that dSphs are real galaxies and not tidal fragments. Tides almost certainly pull bound fragments out of more luminous galaxy progenitors, but they cannot retain even the relatively low DM densities in those progenitors (Barnes & Hernquist 1992), much less increase the DM density to the high values characteristic of dwarf spheroidal galaxies.
2 – Dwarf spheroidal galaxies are not included in the least-squares fits in Figures 2 and 4 because only can be derived for their halos. However, these values lie on the extrapolation to low luminosity of the correlations for spiral and irregular galaxies. That is, the DM halos of dSph and Sc – Im galaxies appear to form a single physical sequence as a function of DM core mass.
3 – Since virialized density depends on collapse redshift , , the smallest dwarfs formed at least earlier than the biggest spirals. Correction for baryonic DM compression will make smaller for giant galaxies. This will slightly increase .
4 – The visible matter parameters and of dSphs are a factor of about 2 smaller than their extrapolated DM parameters. This is reasonably consistent with the hypothesis that extreme dSphs have low visible matter densities () because they lost most of their baryons early. Possible reasons include galactic winds (e. g., Dekel & Silk 1986) or the difficulty of holding onto baryons in shallow DM potential wells when the Universe was ionized (e. g., Klypin et al. 1999). In the absence of a dark halo, the loss of most baryons would unbind the few stars that had already formed. But since these galaxies contain DM halos, we expect instead that the distribution of stars has expanded to fill the halo’s core. Unlike the situation in giant galaxies, visible matter and DM would then have similar scale parameters.
5 – The fact that, as luminosity decreases, dwarf galaxies become much more numerous and also more nearly dominated by DM raises the possibility that there exists a large population of objects that are completely dark (Freeman 1987; Kormendy 1990; see also Tully 2004). Undiscovered DM dwarfs would help to solve the well known problem that the spectrum of initial density fluctuations predicted by CDM theory predicts far too many dwarf satellites of giant galaxies (Moore et al. 1999; Klypin et al. 1999). The favored explanation for why these dwarfs are not seen is that they virialized early, before or during the reionization of the Universe, and therefore lost or never captured the canonical fraction of baryons because those baryons were too hot to be confined in the puny potential wells of the dark dwarfs. Our observations suggest that empty halos – if they exist – are likely to be small and dense and to have small total masses. They would be darker versions of Draco and UMi.
6 – Djorgovski (1992) has compared an earlier version of the DM parameter correlations to the scaling laws predicted by hierarchical clustering (Peebles 1974; Gott & Rees 1975). For a power spectrum of initial density fluctuations that is a power law in wavenumber , , the size , density , and velocity dispersion of a bound object are related approximately by
| (33) | |||||
| (34) | |||||
| (35) |
Here we have used the relation for an isothermal sphere. Djorgovski pointed out that the DM parameter correlations in Kormendy (1990) imply that , close to the value expected for giant galaxies in CDM theory. With the more accurate fits in equations 20 – 22,
| (36) | |||||
| (37) | |||||
| (38) |
we get , , and , respectively. Note that these values are not independent. Their average is . If we use the fits (equations 5 – 7) determined from decompositions using isothermal DM, then the average is . Both values are remarkably close to the value expected in CDM theory at a halo mass of (Shapiro & Iliev 2002). We need to correct the slopes for baryonic DM compression; this will be done in Kormendy & Freeman (2003). The above comparison provides a measure of the slope of the fluctuation power spectrum on mass scales that are smaller than those accessible to most other methods.
Shapiro & Iliev (2002) have made a more detailed comparison of the DM parameter correlations published by Kormendy & Freeman (1996) with their predictions based on COBE-normalized CDM fluctuation spectra. They found that the agreement between predictions and observations was best for CDM.
It is interesting to note a consequence of the theoretical prediction that the slope gets steeper at smaller mass scales. If for the smallest dwarfs (Shapiro & Iliev 2002; Ricotti 2002), then the straight lines in the left panels of Figure 4 should curve downward toward the visible matter parameters of dSph galaxies. This would strengthen the inference that the visible and dark matter in these galaxies is distributed similarly. It will be important to look for curvature in the correlations as more data become available for dwarf galaxies.
Finally, we note that the scatter in Figures 2 – 4 has surely been increased by problems with the data. (1) Distance errors are not negligible. For our calibrating galaxies, we can compare accurate distances to those given by our Virgocentric flow field machinery. This implies errors in of . Since , distance errors are a significant – although not the dominant – source of scatter in equations 5 – 25. (2) If some disks are submaximal, then this affects the scatter in the correlations. If the degree to which they are submaximal depends on (Kranz, Slyz, & Rix 2003), this affects the correlation slopes, too. (3) The assumption that DM halos have isothermal cores is challenged by CDM theory, although it is suppported by many observations. It will be important to see how the correlations are affected if NFW halos are used. (4) The correlations in Figures 2 – 4 require correction for DM compression by the baryons before a definitive comparison with theory can be made. We will address these issues in future papers.
Acknowledgments.
JK is grateful to the staff of Mt. Stromlo Observatory for their hospitality during three visits when part of this work was done. We thank S. Djorgovski, S. M. Fall, and P. Shapiro for helpful discussions on the comparison of predicted and observed DM scaling laws. This work used the NASA/IPAC Extragalactic Database, which is operated by the Jet Propulsion Laboratory, California Institute of Technology, under contract with NASA.
References
Aaronson, M. 1983, ApJ, 266, L11
Aaronson, M., & Olszewski, E. 1987, in IAU Symposium 117, Dark Matter in the Universe, ed. J. Kormendy & G. R. Knapp (Dordrecht: Reidel), 153
Armandroff, T. E., Olszewski, E. W., & Pryor, C. 1995, AJ, 110, 2131
Athanassoula, E., 2004, in IAU Symposium 220, Dark Matter in Galaxies, ed. S. Ryder, D. J. Pisano, M. Walker, & K. C. Freeman (San Francisco: ASP), in press
Athanassoula, E., Bosma, A., & Papaioannou, S. 1987, A&A, 179, 23 (ABP)
Barnes, J. E., & Hernquist, L. 1992, Nature, 360, 715
Binggeli, B., & Cameron, L. M. 1991, A&A, 252, 27
Binggeli, B., Tammann, G. A., & Sandage, A. 1987, AJ, 94, 251
Blais-Ouellette, S., Carignan, C., Amram, P., & Côté, S. 1999, AJ, 118, 2123
Bosma, A. 1978, PhD Thesis, Rijksuniversiteit Groningen
Bosma, A. 1999, in Galaxy Dynamics: A Rutgers Symposium, ed. D. Merritt, J. A. Sellwood, & M. Valluri (San Francisco: ASP), 339
Bosma, A., Kormendy, J., & Souviron, J. 2003, in preparation
Bottema, R. 1993, A&A, 275, 16
Bottema, R. 1997, A&A, 328, 517
Broeils, A. H. 1992, PhD Thesis, Rijksuniversiteit Groningen
Burstein, D., & Heiles, C. 1984, ApJS, 54, 33
Carignan, C., Beaulieu, S., Côté, S., Demers, S., & Mateo, M. 1998, AJ, 116, 1690
Carignan, C., & Puche, D. 1990, AJ, 100, 394
Carignan, C., & Purton, C. 1998, ApJ, 506, 125
Carignan, C., Sancisi, R., & van Albada, T. S. 1988, AJ, 95, 37
Cook, K. H., et al. 1999, PASP, 111, 306
Corbelli, E. 2003, MNRAS, 342, 199
Côté, P., Mateo, M., Olszewski, E. W., & Cook, K. H. 1999, ApJ, 526, 147
Côté, S., Carignan, C., & Freeman, K. C. 2000, AJ, 120, 3027
Courteau, S., & Rix, H.-W. 1999, ApJ, 513, 561
Da Costa, G. S. 1994, in ESO/OHP Workshop on Dwarf Galaxies, ed. G. Meylan & P. Prugniel (Garching: ESO), 221
Debattista, V. P., & Sellwood, J. A. 1998, ApJ, 493, L5
de Blok, W. J. G., & McGaugh, S. S. 1996, ApJ, 469, L89
de Blok, W. J. G., & McGaugh, S. S. 1997, MNRAS, 290, 533
de Blok, W. J. G., McGaugh, S. S., & Rubin, V. C. 2001, ApJ, 122, 2396
Dekel, A., & Silk, J. 1986, ApJ, 303, 39
de Vaucouleurs, G., et al. 1991, Third Reference Catalogue of Bright Galaxies (New York: Springer)
Djorgovski, S. 1992, in Cosmology and Large-Scale Structure in the Universe, ed. R. R. de Carvalho (San Francisco: ASP), 19
Djorgovski, S., & Davis, M. 1986, in Galaxy Distances and Deviations from Universal Expansion, ed. B. F. Madore & R. B. Tully (Dordrecht: Reidel), 135
Djorgovski, S., & Davis, M. 1987, ApJ, 313, 59
Djorgovski, S., de Carvalho, R., & Han, M.-S. 1988, in The Extragalactic Distance Scale, ed. S. van den Bergh & C. J. Pritchet (San Francisco: ASP), 329
Dressler, A., et al. 1987, ApJ, 313, 42
Faber, S. M., et al. 1987, in Nearly Normal Galaxies: From the Planck Time to the Present, ed. S. M. Faber (New York: Springer), 175
Fall, S. M. 2002, in The Dynamics, Structure and History of Galaxies, ed. G. S. Da Costa & H. Jerjen (San Francisco: ASP), 289
Ferguson, H. C., & Binggeli, B. 1994, A&AR, 6, 67
Ferrarese, L., et al. 2000, ApJS, 128, 431
Freeman, K. C. 1970, ApJ, 160, 811
Freeman, K. C. 1987, in Nearly Normal Galaxies: From the Planck Time to the Present, ed. S. M. Faber (New York: Springer), 317
Gallart, C., Martínez-Delgado, D., Gómez-Flechoso, M. A., & Mateo, M. 2001, AJ, 121, 2572
Gerhard, O. E, 2004, in IAU Symposium 220, Dark Matter in Galaxies, ed. S. Ryder, D. J. Pisano, M. Walker, & K. C. Freeman (San Francisco: ASP), in press
Gott, J. R., & Rees, M. J. 1975, A&A, 45, 365
Irwin, M., & Hatzidimitriou, D. 1995, MNRAS, 277, 1354
Jobin, M., & Carignan, C. 1990, AJ, 100, 648
King, I. R. 1966, AJ, 71, 64
Klessen, R. S., Grebel, E. K., & Harbeck, D. 2003, ApJ, 589, 798
Klypin, A., Kravtsov, A. V., Valenzuela, O., & Prada, F. 1999, ApJ, 522, 82
Knapp, G. R., Kerr, F. J., & Bowers, P. F. 1978, AJ, 83, 360
Kormendy, J. 1982, in Morphology and Dynamics of Galaxies, ed. L. Martinet & M. Mayor (Sauverny: Geneva Observatory), 113
Kormendy, J. 1984, ApJ, 287, 577
Kormendy, J. 1985, ApJ, 295, 73
Kormendy, J. 1987a, in IAU Symposium 117, Dark Matter in the Universe, ed. J. Kormendy & G. R. Knapp (Dordrecht: Reidel), 139
Kormendy, J. 1987b, in IAU Symposium 127, Structure and Dynamics of Elliptical Galaxies, ed. T. de Zeeuw (Dordrecht: Reidel), 17
Kormendy, J. 1987c, in Nearly Normal Galaxies: From the Planck Time to the Present, ed. S. M. Faber (New York: Springer), 163
Kormendy, J. 1988, in Guo Shoujing Summer School of Astrophysics; Origin, Structure and Evolution of Galaxies, ed. Fang Li Zhi (Singapore: World Scientific), 252
Kormendy, J. 1990, in The Edwin Hubble Centennial Symposium: The Evolution of the Universe of Galaxies, ed. R. G. Kron (San Francisco: ASP), 33
Kormendy, J., & Bender, R. 1994, in ESO/OHP Workshop on Dwarf Galaxies, ed. G. Meylan & P. Prugniel (Garching: ESO), 161
Kormendy, J., & Djorgovski, S. 1989, ARA&A, 27, 235
Kormendy, J., et al. 1994, in ESO/OHP Workshop on Dwarf Galaxies, ed. G. Meylan & P. Prugniel (Garching: ESO), 147
Kormendy, J., & Freeman, K. C. 1996, in Ringberg Proceedings 1996 of Sonder-forschungsbereich 375, Research in Particle Astrophysics, ed. R. Bender et al. (Munich: Technische Universität München, Ludwig-Maximilians-Universität, Max-Planck-Institut für Physik, & Max-Planck-Institut für Astrophysik), 13
Kormendy, J., & Freeman, K. C. 2003, in preparation
Kraan-Korteweg, R. C. 1986, A&AS, 66, 255
Kranz, T., Slyz, A., & Rix, H.-W. 2003, ApJ, 586, 143
Kuhn, J. R. 1993, ApJ, 409, L13
Kuhn, J. R., & Miller, R. H. 1989, ApJ, 341, L41
Lake, G. 1990, MNRAS, 244, 701
Lake, G., & Feinswog, L. 1989, AJ, 98, 166
Lauer, T. R. 1985, ApJ, 292, 104
Lauer, T. R., et al. 1995, AJ, 110, 2622
Martimbeau, N., Carignan, C., & Roy, J.-R. 1994, AJ, 107, 543
Mateo, M. 1994, in ESO/OHP Workshop on Dwarf Galaxies, ed. G. Meylan & P. Prugniel (Garching: ESO), 309
Mateo, M. 1997, in The Second Stromlo Symposium: The Nature of Elliptical Galaxies, ed. M. Arnaboldi, G. S. Da Costa, & P. Saha (San Francisco: ASP), 259
Mateo, M. 1998, ARA&A, 36, 435
Mateo, M., Olszewski, E. W., Pryor, C., Welch, D. L., Fischer, P. 1993, AJ, 105, 510
Mateo, M., Olszewski, E. W., Vogt, S. S., & Keane, M. J. 1998, AJ, 116, 2315
Merritt, D. 1987, ApJ, 313, 121
Meurer, G. R., Carignan, C., Beaulieu, S. F., & Freeman, K. C. 1996, AJ, 111, 1551
Meurer, G. R., Staveley-Smith, L., & Killeen, N. E. B. 1998, MNRAS, 300, 705
Milgrom, M. 1983a, ApJ, 270, 365
Milgrom, M. 1983b, ApJ, 270, 371
Milgrom, M. 1983c, ApJ, 270, 384
Milgrom, M., & Bekenstein, J. 1987, in IAU Symposium 117, Dark Matter in the Universe, ed. J. Kormendy & G. R. Knapp (Dordrecht: Reidel), 319
Miller, B. W., & Rubin, V. C. 1995, AJ, 110, 2692
Moore, B. 1994, Nature, 370, 629
Moore, B., et al. 1999, ApJ, 524, L19
Navarro, J. F., Frenk, C. S., & White, S. D. M. 1996, ApJ, 462, 563 (NFW)
Navarro, J. F., Frenk, C. S., & White, S. D. M. 1997, ApJ, 490, 493 (NFW)
Oh, K. S., Lin, D. N. C., & Aarseth, S. J. 1995, ApJ, 442, 142
Olszewski, E. W., Pryor, C., & Armandroff, T. E. 1996, AJ, 111, 750
Peebles, P. J. E. 1974, ApJ, 189, L51
Palma, C., et al. 2003, AJ, 125, 1352
Piatek, S., & Pryor, C. 1995, AJ, 109, 1071
Piatek, S., Pryor, C, Armandroff, T. E., & Olszewski, E. W. 2001, AJ, 121, 841
Piatek, S., Pryor, C, Armandroff, T. E., & Olszewski, E. W. 2002, AJ, 123, 2511
Puche, D., Carignan, C., & Wainscoat, R. J. 1991, AJ, 101, 447
Pryor, C. 1992, in Morphological and Physical Classification of Galaxies, ed. G. Longo, M. Capaccioli, & G. Busarello (Dordrecht: Kluwer), 163
Pryor, C., and Kormendy, J. 1990, AJ, 100, 127
Ricotti, M. 2002, MNRAS, in press (astro-ph/0212146)
Sackett, P. D. 1997, ApJ, 483, 103
Sellwood, J. A., & Moore, E. M. 1999, ApJ, 510, 125
Sellwood, J. A., & Pryor, C. 1998, Highlights Astron., 11, 638
Shapiro, P. R., & Iliev, I. T. 2002, ApJ, 565, L1
Sicotte, V., & Carignan, C. 1997, AJ, 113, 609
Skillman, E. D., Bothun, G. D., Murray, M. A., & Warmels, R. H. 1987, A&A, 185, 61
Swaters, R. A., Madore, B. F., & Trewhella, M. 2000, ApJ, 531, L107
Swaters, R. A., Madore, B. F., van den Bosch, F. C., & Balcells, M. 2003, ApJ, 583, 732
Taga, M., & Iye, M. 1994, MNRAS, 271, 427
Tonry, J. L., et al. 2001, ApJ, 546, 681
Toomre, A. 1981, in The Structure and Evolution of Normal Galaxies, ed. S. M. Fall & D. Lynden-Bell (Cambridge: Cambridge University Press), 111
Tremaine, S. 1987, in Nearly Normal Galaxies: From the Planck Time to the Present, ed. S. M. Faber (New York: Springer), 76
Tully, R. B. 2004, in IAU Symposium 220, Dark Matter in Galaxies, ed. S. Ryder, D. J. Pisano, M. Walker, & K. C. Freeman (San Francisco: ASP), in press
Tully, R. B., & Fisher, J. R. 1977, A&A, 54, 661
Tully, R. B., & Fouqué, P. 1985, ApJS, 58, 67
van Albada, T. S., Bahcall, J. N., Begeman, K., & Sancisi, R. 1985, ApJ, 295, 305
van Zee, L., Haynes, M. P., Salzer, J. J., & Broeils, A. H. 1997, AJ, 113, 1618
Verdes-Montenegro, L., Bosma, A., & Athanassoula, E. 1997, A&A, 321, 754
Verheijen, M. A. W. 1997, PhD Thesis, Rijksuniversiteit Groningen
Weiner, B. J., 2004, in IAU Symposium 220, Dark Matter in Galaxies, ed. S. Ryder, D. J. Pisano, M. Walker, & K. C. Freeman (San Francisco: ASP), in press
Weiner, B. J., Sellwood, J. A., & Williams, T. B. 2001, ApJ, 546, 931
Weldrake, D. T. F., de Blok, W. J. G., & Walter, F. 2003, MNRAS, 340, 12
Wilkinson, M. I., 2004, in IAU Symposium 220, Dark Matter in Galaxies, ed. S. Ryder, D. J. Pisano, M. Walker, & K. C. Freeman (San Francisco: ASP), in press