Evidence for X-ray Obscuration in Type II Quasar Candidates from the Sloan Digital Sky Survey
Abstract
Recently, Zakamska et al. (2003) selected 291 high-ionization narrow emission-line AGN in the redshift range 0.3–0.83 from the Sloan Digital Sky Survey spectroscopic data. The sample includes both Seyfert II galaxies and their higher luminosity “cousins”, Type II quasar candidates. Here we present the results on the X-ray properties of 17 of these objects for which archival X-ray data (ROSAT and XMM-Newton) are available. Three sources have been significantly () detected, one being the most radio-loud source of the sample; its X-ray emission, possibly enhanced by jet emission, is consistent with the absence of absorption. Another source has a detection in the ROSAT All-Sky Survey, possibly complex radio structure, and no evidence for strong X-ray absorption. For the third X-ray detection, the XMM-Newton spectrum indicates a column density of cm-2; this result, coupled with the 2–10 keV luminosity of 4 erg s-1, makes this source a genuine Type II quasar. Using the [O iii]5007 line luminosities, we estimated the intrinsic X-ray power of the AGN and found that per cent of the observed sample shows indications of X-ray absorption, with column densities cm-2. This provides further evidence that a considerable fraction are obscured quasars. Support to our conclusions also comes from the recent analysis of RASS data performed by Zakamska et al. (2004), who found five additional lower significance () X-ray matches.
keywords:
galaxies: active — galaxies: nuclei — quasars: general — X-rays1 Introduction
One of the basic predictions of Unification models of active galactic nuclei (AGN) is the existence of a population of luminous, highly obscured (i.e., with high-ionization, narrow optical emission-line spectra) AGN, the so-called Type II quasars, often referred to as the higher luminosity counterparts of local Seyfert II galaxies. In the X-ray band these objects are expected to be highly luminous ( a few erg s-1) and absorbed by column densities cm-2; given their properties, they would constitute an important ingredient of most AGN synthesis models for the X-ray background (XRB; e.g., Comastri et al. 2001; Gilli, Salvati & Hasinger 2001). Before the advent of the current generation of X-ray telescopes (Chandra and XMM-Newton), Type II quasars formed quite an elusive class of sources [but see Brandt et al. (1997) and Franceschini et al. (2000)]. Recent X-ray surveys have found several genuine Type II quasars (e.g., Norman et al. 2002; Stern et al. 2002; Fiore et al. 2003; Perola et al. 2004; Gandhi et al. 2004; Caccianiga et al. 2004; Szokoly et al. 2004) and many more candidate Type II quasars (e.g., Crawford et al. 2001, 2002; Mainieri et al. 2002; Barger et al. 2003). Multiwavelength observations of these objects generally support their Type II quasar status; in particular, at optical wavelengths Type II quasars often show high equivalent width, narrow emission lines with high-ionization line ratios. However, in some cases broad-band, high signal-to-noise ratio optical/near-infrared follow-up observations of X-ray selected Type II quasar candidates have revealed broad components in their permitted emission lines (e.g., Halpern et al. 1999; Akiyama et al. 2002). Overall, less than 20 per cent of the hard X-ray, presumably absorbed sources found in moderately deep/ultra-deep surveys have optical counterparts characterized by high-ionization narrow emission lines (e.g., Barger et al. 2003), suggesting that the Type II quasar population is not adequately sampled at present. Furthermore, the optical counterparts of X-ray selected Type II quasar candidates are typically so faint that the spectroscopic identification is quite a challenging task. Therefore, to have a comprehensive view of the properties of Type II quasars, the selection of a relatively optically bright sample is necessary. In this regard, recently Zakamska et al. (2003; hereafter Z03) selected 291 high-ionization narrow emission line AGN in the redshift range 0.3–0.83 from the Sloan Digital Sky Survey (SDSS; York et al. 2000) spectroscopic data. The sample includes both Seyfert II galaxies and their higher luminosity “cousins”, Type II quasar candidates. This is the only published optically selected sample of candidate Type II quasars in this redshift range.111 We note that Djorgovski et al. (2001) have produced a sample of obscured quasar candidates, selected on the basis of narrow permitted emission lines and high-ionization line ratios. This sample covers the complementary 0.31–0.36 redshift range. The main goal of the present work is to define the basic X-ray properties of optically selected Type II quasar candidates.
Hereafter we adopt the “concordance” (WMAP) cosmology (=70 km s-1 Mpc-1, =0.3, and =0.7; Spergel et al. 2003).
2 Sample selection
To select candidate obscured (i.e., Type II) AGN from the SDSS spectroscopic data, Z03 searched for objects with narrow emission lines without underlying broad components and with line ratios characteristic of non-stellar ionizing radiation. The redshift range (0.3–0.83) is chosen to include the [O iii]5007 line in all of the spectra and this allows a statistically relevant study of the emission-line properties of the sources. The sample members are characterized by spectra with signal-to-noise ratios , rest-frame equivalent width of the [O iii] line Å, and FWHM (H km s-1. The high-ionization selection criteria adopted by Z03 (see 3.3 of Z03 and Kewley et al. 2001 for further references) are designed to properly reject star-forming galaxies and genuinely unobscured objects, such as narrow-line Seyfert 1 galaxies (NLS1s), which otherwise would match the FWHM criterion (e.g., Williams, Pogge & Mathur 2002). Given the width of the fibers used in the SDSS spectroscopic runs (3′′), a significant contribution to the overall emission can come from the AGN host galaxies. To compute reliable AGN emission-line parameters, Z03 subtracted the host galaxy contribution from each spectrum (using templates) before computing the line parameters. About 50 per cent of the objects selected by Z03 have [O iii] line luminosities in the range 3 , comparable to those of luminous () quasars. This, coupled with other evidences, suggests that at least the objects in the luminous subsample are Type II quasar candidates.222 A widely accepted definition of Type II quasars does not exist at present. From the optical perspective, Type II quasars are the luminous [typically (e.g., Schmidt & Green 1983), although this “historical” absolute magnitude limit has not a physically supported motivation and is based on a different cosmology than the one adopted here] analogs of Seyfert II galaxies. In the X-rays, objects with 2–10 keV luminosity erg s-1 and characterized by absorption cm-2 are usually called Type II quasars. We note that a priori it is possible that the objects optically classified as Type II quasars do not match the X-ray definition and viceversa. Therefore, in the following we will refer to our objects as Type II quasar candidates.
It must be noted that Z03 sample, is not complete; 28 per cent of the sources have been selected as “targets”, 42 per cent as “serendipitous”, 19 per cent from the Deep Southern Equatorial Scan (DSES) plates (where the magnitude limit is 1 mag fainter), and 11 per cent from the “special plates” (see Z03 for details). Nevertheless, the careful and accurate analyses performed by Z03 to select the final sample of 291 candidate obscured AGN allow reliable studies of optically selected Type II quasar candidates.
3 The X-ray data: reduction and analysis
The Z03 catalog of candidate Type II quasars was cross correlated with archival ROSAT, Chandra, and XMM-Newton observations. Our basic X-ray source searching strategy is performed using ROSAT because of its large field-of-view. On the contrary, Chandra and XMM-Newton cover smaller regions of the sky but provide greater sensitivity and broader energy range (up to 10 keV). Seventeen sources lie in archival X-ray observations. The observation log and source X-ray fluxes (or upper limits) are presented in Table 1.
| Srca | SDSS J | b | c | d | Instr.e | f | Exp. Time | Off-axis | Obs.g | ||
|---|---|---|---|---|---|---|---|---|---|---|---|
| ID # | (1020 cm-2) | (mJy) | () | (ks) | Angle (′) | ID | |||||
| 34 | 021047.01100152.9 | 0.540 | 2.17 | 9.79 | 45.1 | P | 14.6 | 19.6 | 800114p | ||
| 55 | 023359.93004012.7 | 0.388 | 2.82 | 8.17 | 43.5 | P | 28.2 | 6.8 | 800482p | ||
| 59 | 024309.79000640.3 | 0.414 | 3.56 | 7.95 | 43.3 | P | 5.5 | 10.3 | 150021p2 | ||
| 59h | H | 72.0 | 9.5 | 701352h1 | |||||||
| 68 | 025558.00005954.0 | 0.700 | 6.33 | 8.51 | 43.9 | P | 3.0 | 15.4 | 190338p | ||
| 70 | 025951.28002301.0 | 0.505 | 7.14 | 8.53 | 43.9 | P | 5.0 | 16.4 | 700393p | ||
| 130 | 084234.94362503.1 | 0.561 | 3.41 | 1.64 | 10.10 | 45.5 | H | 28.1 | 5.7 | 800854h | |
| 148 | 090933.51425346.5 | 0.670 | 1.60 | 4009.5 | 8.92 | 44.3 | P | 22.1 | 0.2 | 700329p1 | |
| 152 | 092014.11453157.3 | 0.402 | 1.51 | 9.04 | 44.4 | P | 4.3 | 12.0 | 700539p | ||
| 174 | 100854.43461300.7 | 0.544 | 0.95 | 7.16 | 8.32 | 43.7 | H | 9.5 | 17.5 | 702430h | |
| 188 | 104505.39561118.4 | 0.428 | 0.65 | 2.59 | 9.08 | 44.4 | P | 3.9 | 14.0 | 600058p | |
| 204 | 122656.48013124.3 | 0.732 | 1.84 | 9.66 | 45.0 | P | 24.8 | 12.5 | 600242p1 | ||
| 204i | 44.6–44.7 | X | 7.8–9.8 | 6.0 | 0110990201 | ||||||
| 208 | 123453.10640510.2 | 0.594 | 1.87 | 8.77 | 44.1 | P | 3.0 | 17.0 | 800263p | ||
| 209 | 124736.07023110.7 | 0.487 | 1.76 | 0.90 | 8.59 | 43.9 | P | 5.5 | 17.5 | 700020p | |
| 212 | 130740.56021455.3 | 0.425 | 1.75 | 1.66 | 8.92 | 44.3 | P | 1.6 | 18.2 | 200531p | |
| 239 | 150117.96545518.3 | 0.338 | 1.40 | 20.87j | 9.06 | 44.4 | R | 1.1 | 930725p | ||
| 256 | 164131.73385840.9 | 0.596 | 1.16 | 2.80 | 9.92 | 45.3 | P | 5.5 | 16.1 | 201538p | |
| 258 | 165627.28351401.7 | 0.679 | 1.73 | 1.16 | 8.57 | 43.9 | P | 22.1 | 18.1 | 400374p |
a From Table 1 of Zakamska et al. 2003. b From Dickey & Lockman 1990. c Integrated 1.4 GHz flux density (or 3 upper limit) from FIRST (Becker, White & Helfand 1995). d Predicted 2–10 keV luminosity and relative uncertainty (using the 1 scatter in the Mulchaey et al. 1994 correlation; see 4 for details) in units of erg s-1. e “P” and “H” indicate the ROSAT PSPC and HRI observations, respectively, while “R” indicates the ROSAT All-Sky Survey (RASS) observation (in this case the off-axis angle is not reported); “X” is referred to the object with XMM-Newton observation. f Galactic absorption-corrected flux (or 3 upper limit) in the observed 0.5–2 keV band, in units of 10-14 . g Observation ID in the ROSAT (ROSAT observation request, ROR) and XMM-Newton archives. h Both PSPC and HRI data are reported for source #59, since the results obtained from their analyses appear significantly different (see text and Table 2 for details). i XMM-Newton observation of source #204. The flux and observed (de-absorbed) 2–10 keV luminosity shown here have been derived directly from X-ray spectral fitting of XMM-Newton data (see 4.1); the range is due to slight pn–MOS differences in relative normalisations. Both the pn and MOS exposure times after the removal of periods of flaring background are reported. j The flux density is referred to the FIRST source which is closest (0.3′′) to the optical position of the quasar. This object has possibly a peculiar radio morphology, as reported in the Appendix A.4 and Fig. 2 of Zakamska et al. (2004).
3.1 ROSAT observations
At first the Z03 sample was cross correlated with ROSAT data [pointed PSPC, pointed HRI, and the ROSAT All-Sky Survey (RASS)]. We used only the central regions (20′ radius) of the ROSAT PSPC and HRI detectors, where the sensitivity is highest and the PSPC window support structure does not affect source detection. This maximizes the probability of detecting faint sources. In cases of multiple observations of the same SDSS quasar with the same X-ray instrument, the one with the best combination of off-axis angle and exposure time has been chosen. Typically, the use of PSPC data is preferred to that of HRI data, given the larger number of objects with PSPC data available.333For source #59 we report the results from both the PSPC and HRI observations. The detailed source detection procedure is described in Vignali, Brandt & Schneider (2003). Briefly, source detection was performed in the 0.5–2 keV band for the PSPC and in the full band ( 0.1–2.4 keV) for the HRI. A conservative matching radius of 40′′ was used to take into account the broadening of the Point Spread Function (PSF) at large off-axis angles,444See ftp://ftp.xray.mpe.mpg.de/rosat/catalogues/1rxp/wga_rosatsrc.html. although typically a good match is obtained within 15–20′′ (e.g., Vignali et al. 2003).
Standard likelihood detection algorithms available under MIDAS/EXSAS (Zimmermann et al. 1998) have been used. We set the detection threshold to a likelihood of , corresponding to a probability of the order of 2.510-3 that the observed number of photons in the source cell is produced entirely by a background fluctuation (corresponding to the 3.2 detection level; Cruddace, Hasinger & Schmitt 1988).
Sixteen of the Z03 SDSS AGN fall in the inner part of the field-of-view of ROSAT pointed observations. Two have X-ray detections (one in the PSPC and the other in both the PSPC and HRI); these X-ray counterparts lie at 01 (source #148) and 82 (source #204) from the optical position; given their relatively large fluxes (see Table 1), we do not expect either of these sources to be spurious. We determined X-ray count rates (for the two detections) and 3 upper limits for the 14 X-ray non-detections (12 from PSPC and 2 from HRI) using the SOSTA task in the XIMAGE package (version 4.1; Giommi et al. 1992). For the two X-ray detections the X-ray count rates obtained using ximage have been compared with those derived using the maximum likelihood method, finding good agreement. The X-ray count rates have been converted using PIMMS (Mukai 2001) into observed 0.5–2 keV fluxes (for both PSPC and HRI; this energy range corresponds to 0.7–3.5 keV in the source rest frame) using a power law with and Galactic absorption (from Dickey & Lockman 1990). Although both Type I (i.e., with broad permitted emission lines) and Type II (i.e., with narrow permitted and forbidden emission lines) AGN in the local Universe are generally well described by =1.8–2.0 X-ray continua (e.g., Nandra & Pounds 1994; Reeves & Turner 2000; Risaliti et al. 2002; Deluit & Courvoisier 2003; Malizia et al. 2003), it must be kept in mind that an additional soft X-ray component (perhaps related to the AGN host galaxy, to a circumnuclear starburst or to a scattering component; see, e.g., Vignali et al. 2001) could be present. However, the redshift range of the present sample partially reduces the contribution of this soft component to the measured 0.5–2 keV fluxes. For the sources where both the PSPC and HRI measurements are available, we compared the X-ray fluxes (upper limits). These are usually similar (but see Table 1 for the case of source #59), therefore we decided to use the PSPC measurements since they are available for the majority of the sources in the present sample. For the X-ray detected source #148, a variability of a factor of 2 over time-scales of 5 yr seems to be present. This is not surprising since X-ray variability over time-scales of several years are often observed in AGN (Almaini et al. 2000; Markowitz, Edelson & Vaughan 2003); furthermore, this source is also the most radio-loud AGN in Z03 sample (see Table 1), so enhanced variability, perhaps related to a jet component, might be present. Also in this case the PSPC measurement is used.
To match the Z03 sample with the RASS (Voges et al. 1999), we used the ROSAT Web Browse555See http://www.xray.mpe.mpg.de/cgi-bin/rosat/src-browser. assuming a matching radius of 40′′ and adopted a slightly more conservative detection threshold (, corresponding to the 3.7 detection level) than that adopted for ROSAT pointed observations. One candidate Type II quasar is detected (at the 6 level) in the RASS (source #239 in Table 1). The detection of this source in the RASS was possible due to a longer than typical exposure ( 1100 s as compared to typical values of a few hundred seconds for most of the other Z03 sources). The X-ray upper limits for the majority of the Z03 sources in the RASS are not sensitive enough for the purposes of this study.
Recently, Zakamska et al. (2004) have searched for the counterparts of their Type II AGN at radio/infrared wavelengths and in the X-ray band (using the RASS only). They found six sources with a counterpart in the RASS (at ) using a matching radius of 1′ (see their Table 4). Among these, source #239 is in common with our list (see Table 1), while all of the remaining sources are below the detection threshold adopted in the present paper (three have detections, one is detected at the 3.4 level, and one at the 3.6 level). Two of these five matched sources have likely radio counterparts, thus increasing the reliability of their X-ray detection in the shallow RASS fields. However, the visual inspection of the individual RASS images provides evidence for weak X-ray emission only in the 3.4 RASS source (having also a radio counterpart). Including the additional five lower significance () RASS sources from Zakamska et al. (2004) would provide eight X-ray detections of Type II quasar candidates, although in the following we will refer only to the three higher significance X-ray sources matching our more conservative selection criteria. As pointed out by Zakamska et al. (2004), it is interesting to note that the fraction of SDSS Type I AGN (in the redshift range ) having RASS counterpart is significantly higher ( 15-20 per cent) than that of Z03 SDSS Type II AGN. This can be explained assuming the presence of X-ray obscuration ( cm-2, Zakamska et al. 2004); a similar result is clearly found in of the present paper on a larger sample of Type II quasar candidates with deeper X-ray observations and also via direct X-ray spectral analysis (for source #204, see 4.1).
3.2 Chandra observations
Only one source in the Z03 sample [#130 (OBS_ID=532); also reported as HRI upper limit; see Table 1] lies within an archival Chandra observation (on-axis exposure time of 8.1 ks) but is not detected. Unfortunately, its position, very close to the edge of ACIS-I field-of-view, prevents a reliable determination of the source X-ray flux upper limit.
3.3 XMM-Newton observations
Two sources of the Z03 sample fall in XMM-Newton archival observations. One is a clear X-ray detection (source #204, also detected by ROSAT PSPC; see Table 1); the spectral analysis of this source using EPIC pn and MOS data is presented in 4.1. The XMM-Newton data were reduced with the version 5.4.1 of the Science Analysis Software (sas) following the procedure described in Vignali et al. (2004). The data were filtered to avoid background flares which affect large intervals ( 60–70 per cent) of our observation. The tasks epproc and emproc were used to generate valid photon list; patterns 0–4 and 0–12 were used for pn and MOS, respectively. Source counts were extracted in the 0.3–10 keV band from circular regions of radius 30′′ (pn) and 40′′ (MOS), while background counts were extracted from off-source regions of radius 90′′ (pn) and 80′′ (MOS). Response functions for spectral fitting were generated using the tasks rmfgen and arfgen.
The other source [object #59 (OBS_ID=0111200101), also reported as PSPC upper limit; see Table 1] is not detected; its position, close to the edge of EPIC-pn field-of-view, does not allow us to derive a reliable X-ray flux upper limit, despite the long exposure of the observation ( 37 ks).
3.4 Summary of X-ray observations
Overall, three sources of the Z03 sample have X-ray detections with ROSAT (sources #148, #204, and #239) assuming the matching criteria and detection thresholds reported in 3.1. Source #204, serendipitously found and detected also by XMM-Newton, has enough counts for a moderate-quality spectral analysis; the most relevant results are presented in 4.1.
4 Constraints on the X-ray properties of Type II quasar candidates
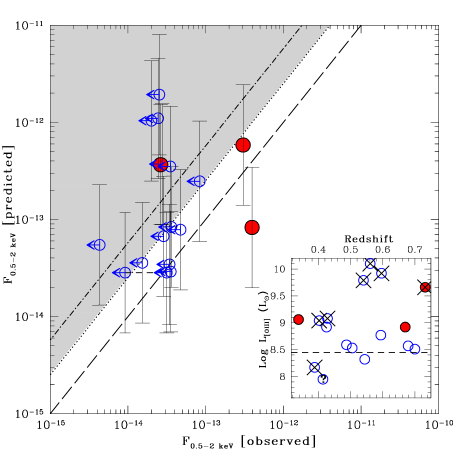
The distribution of the [O iii] luminosities () vs. redshift for the Z03 sources is shown in Fig. 1.

Large open circles indicate the sources having X-ray upper limits, while the three large filled circles indicate the objects with X-ray detections. Most of the sources with X-ray information have [O iii] line luminosities in the range 3 (region above the dashed line in Fig. 1) which are comparable to those of luminous () quasars (Z03). In other words, most of our X-ray observed objects are Type II quasar candidates (see Footnote 2).
To derive basic constraints on the X-ray emission of Type II quasar candidates, we have used the correlation between the [O iii] flux and the 2–10 keV flux found for Seyfert II galaxies (Mulchaey et al. 1994), adopting the parameterization reported in 3.2 of Collinge & Brandt (2000). Using this approach, we have computed the expected 2–10 keV flux for each source and, using the 1 scatter in the correlation of Mulchaey et al. (1994), also the corresponding error range. It must be noted that no correction has been applied to the [OIII] line flux for the absorption due the narrow-line region itself [see Maiolino et al. (1998) and Bassani et al. (1999) for details]. This effect is usually corrected for by using the Balmer decrement, but unfortunately the spectral coverage of the H line is not available for most of the objects in the present sample. This approach leads to a conservative determination in whether or not a source is absorbed in the X-ray band.
The predicted 2–10 keV fluxes (with their 1 uncertainties) have been converted into soft (0.5–2 keV) X-ray fluxes assuming a power law with photon index , which seems to be a relatively good parameterization for the intrinsic X-ray continuum of both Type I and Type II AGN (e.g., Nandra & Pounds 1994; Deluit & Courvoisier 2003).666The assumption of instead of 2.0 provides lower 0.5–2 keV fluxes (by 14 per cent).
The soft X-ray fluxes derived following the method described above have then been compared with those observed (or the 3 upper limits for the X-ray non-detections; see Table 1). This has allowed us to estimate on a source-by-source basis the amount of X-ray absorption required to match the derived soft X-ray flux with the observed one. Since the derived soft X-ray flux has an associated scatter (due to that of the Mulchaey et al. 1994 correlation), for each source we determine an “allowed” range of column densities ( and in Table 2). For sake of completeness, the column density range associated with each source is shown in Fig. 2.
| Src | Column Densitya | X-rayb | Likelyc | QSO IId | ||
|---|---|---|---|---|---|---|
| ID # | Det. | Abs. | ||||
| 34 | 1.2 | 6.0 | 2.0 | |||
| 55 | 4.6 | 1.1 | 9.6 | |||
| 59 | 0 | 0 | 1.5 | |||
| 59e | 1.2 | 7.0 | 4.9 | |||
| 68 | 0 | 0 | 2.0 | |||
| 70 | 8.0 | 0 | 4.7 | |||
| 130 | 1.5 | 8.0 | 2.3 | |||
| 148 | 0 | 0 | 0 | |||
| 152 | 5.0 | 1.3 | 1.0 | |||
| 174 | 0 | 0 | 2.3 | |||
| 188 | 4.3 | 8.5 | 9.5 | |||
| 204 | 8.7 | 2.3 | 1.8 | |||
| 208 | 5.0 | 0 | 4.1 | |||
| 209 | 9.0 | 0 | 4.6 | |||
| 212 | 1.7 | 0 | 4.9 | |||
| 239 | 4.7 | 0 | 3.0 | |||
| 256 | 1.3 | 6.0 | 2.1 | |||
| 258 | 1.2 | 0 | 6.2 | |||
The column densities reported here (in cm-2) should be considered as lower limits for all those objects which have not been detected by ROSAT. For the three X-ray detected sources, the column density range (, ) is broadly consistent with the absorption derived by the hardness-ratio analysis.
a The three values of column densities have been obtained using the best-fitting value and the corresponding scatter in the Mulchaey et al. (1994) correlation between the [O iii] flux and the 2–10 keV flux found for Seyfert II galaxies; this correlation has been applied to our data and used to estimate the expected 0.5–2 keV flux range for each object. Then the estimated 0.5–2 keV fluxes have been compared with the observed 0.5–2 keV fluxes (or 3 upper limits) to derive , , and on a source-by-source basis. Given the procedures adopted to derive the column densities (see 4 for details), should be considered a conservative estimate. b means that the object is detected by ROSAT; see Table 1. c marks the sources which are likely absorbed (i.e., ); see text for details. d indicates the possibly absorbed sources with X-ray luminosities erg s-1(see Table 1 and Footnote 2). e For this source, HRI data indicate the presence of absorption. The time interval between the PSPC and HRI observations is 2 yr.
This procedure is based on the simplest assumption made possible by the data at our disposal, i.e., these Type II quasar candidates have the same underlying average X-ray continuum of local Seyfert I galaxies and quasars, the only difference being the amount of X-ray absorption, which has been assumed to be intrinsic to the source. Clearly, the uncertainties associated with the predicted soft X-ray fluxes (and thus with the derived column densities) are large. However, within our assumptions, these column densities (see Table 2) should be considered as lower limits, since all but three of our sources are not detected in the soft X-ray band.
At least 47 per cent (8/17) of the sources with X-ray information shows indications of X-ray absorption (see Fig. 2 and Table 2), with column densities typically cm-2 (dotted line in Fig. 1 for a source at ). A column density of 1–2 cm-2, close to the value, has been obtained also for source #204, whose X-ray properties have been derived via direct X-ray spectral analysis using XMM-Newton data (see 4.1 and Fig. 3).
We also tried to perform a stacking analysis combining all of the X-ray undetected sources. Although an 4 detection has been obtained, the total number of X-ray source counts ( 34) did not allow us to derive an average column density through hardness-ratio analysis. However, we compared the average flux derived from the stacking analysis (weighted by the exposure time of each observation with respect to the total) with that expected on the basis of the correlation of Mulchaey et al. (1994). An average column density of 1.4–2.7 cm2 has been derived, although we note that this value suffers from significant uncertainties. More reliable constraints could be obtained using Chandra, given the lower background and sharper PSF.
A caveat to the plain use of the method described above is related to the fact that the observations in the optical and X-ray bands are not simultaneous. Intrinsic source variability as well as variability in the absorbing medium over the time-scales probed by the X-ray observations might be present. However, our approach, although limited by the paucity of X-ray detections, is simple and designed to place basic constraints on the overall X-ray properties of optically selected, Type II quasar candidates.


4.1 X-ray spectral analysis of source #204: XMM-Newton results
Source #204 has counts in the pnMOS1MOS2 data. These counts were grouped into spectra such that each spectral bin contained at least 15 counts to allow fitting. X-ray spectra were fitted using the xspec package (version 11.2; Arnaud 1996). The quoted errors on the derived model parameters correspond to the 90 per cent confidence level for one interesting parameter (i.e., ; Avni 1976). All spectral fits include absorption due to the line-of-sight Galactic column density (from Dickey & Lockman 1990; see Table 1). Separate spectral fitting indicates that pn and MOS spectral results are consistent to within 10 per cent; this is similar to the value quoted by Kirsch (2003; 13 per cent). Therefore in the following the pn and MOS data will be fitted together with the same model leaving the relative normalisations free to vary.
A single power-law model is clearly not an adequate fit to XMM-Newton data; the quality of the fit is poor (/d.o.f.=61.2/32) and the photon index is very flat (), suggesting the presence of absorption. If an absorber at the source redshift () is added to the previous model, the fit improves significantly (/d.o.f.=45.4/31), although some residuals are still present at energies around 1.5 keV. These can be partially accounted for by the addition of a thermal component (mekal model in xspec), perhaps related to the AGN host galaxy or to a circumnuclear starburst, but the spectral parameters of this component are poorly constrained, and therefore it will not be considered in the following. The best-fitting spectrum [shown in Fig. 3, panel (a)] is parameterized by a photon index and a column density cm-2. The 68, 90, and 99 per cent confidence contours for the photon index vs. column density are shown in Fig. 3 [panel (b)]. If the photon index is forced to be , more representative of the typical AGN intrinsic X-ray emission, the column density becomes 2.2–3.2 cm-2, more consistent with the range derived from ROSAT data and reported in Table 2. We note, however, that source variability may have occurred between the ROSAT and XMM-Newton observations (over a time-scale of 10 yr). The intrinsic 2–10 keV luminosity (1044.6-44.7 erg s-1), the column density ( 1–2 cm-2), and the narrow-line optical spectrum (Z03) are fully consistent with source #204 being a genuine Type II quasar.
5 Discussion
Though not complete, the catalog of Z03 provides
an optically well-defined sample of candidate Type II quasars which can be
used as a starting point for detailed analyses of the broad-band properties
of optically luminous Type II quasars and for the study of the contribution
of this population to the hard XRB (e.g., Gilli et al. 2001).
In particular, Type II quasars might be crucial to study the
dependence of absorption upon X-ray luminosity (Ueda et al. 2003;
La Franca et al., in preparation).
Since the sources of the present sample are mostly optically luminous,
this study can be considered complementary to that of X-ray selected Type II
quasar candidates, whose optical counterparts are typically faint and often
hamper an accurate spectroscopic identification.
Clearly, the results presented in this paper suffer from significant
uncertainties, mostly related to the scatter in the correlation
between the [O iii] line intensity and hard X-ray flux (Mulchaey et al. 1994),
the applicability of this method to the higher luminosity “cousins” of
local Seyfert II galaxies (from which the correlation is obtained), and
the assumption that all the AGN spectra have on average
the same underlying X-ray continuum.
The first of these three major sources of uncertainty has been taken into
account by comparing the observed soft X-ray fluxes and upper limits with
those obtained using the correlation above.
The uncertainties related to the scatter in the correlation
(vertical error bars in Fig. 2)
affect the derivation of the column densities
(see the values and in Table 2);
it must be kept in mind, however, that the predicted soft X-ray fluxes have
been compared mostly with the observed X-ray flux upper limits,
therefore the column densities should be treated as lower limits.
Furthermore, intrinsically flatter X-ray slopes would produce lower
column densities (by 20 per cent, if instead of 2.0
is adopted), while the presence of an additional soft X-ray component
(e.g., thermal emission from the host galaxy, scattering, etc.)
would produce the opposite effect.
Given the lack of spectral constraints provided by direct X-ray fitting
(except for source #204), this approach, although a bit simplistic,
allowed us to derive basic X-ray constraints for 17 Type II AGN, some of
which being quasar candidates:
(i) At least 47 per cent of the present sample shows indications
of X-ray absorption, with column densities cm-2.
(ii)
The presence of genuine Type II quasars among the objects presented in this
paper finds further support from the only object (source #204)
with XMM-Newton moderate-quality spectral data (4.1).
The intrinsic 2–10 keV luminosity ( 1044.6 erg s-1),
the column density ( 1–2 cm-2),
and the narrow-line optical spectrum of this source are consistent with
the Type II quasar definition.
Moreover, its X-ray luminosity is comparable with those of some
higher redshift X-ray selected Type II quasars
(e.g., Stern et al. 2002; Mainieri et al. 2002; Brusa et al. 2003).
Our results find further support from those obtained recently by Zakamska et al. (2004) on the basis of RASS data only.
The large-area surveyed by the SDSS, coupled with the relatively bright flux limit, the spectroscopic target selection and wavelength coverage, is such to possibly provide large numbers of optically selected Type II quasar candidates to be followed-up at other wavelengths with, e.g., Spitzer, SCUBA and current X-ray telescopes such as Chandra and XMM-Newton. Therefore, in the following years it will become possible to properly assess the broad-band properties of optically selected Type II quasars (in particular, their spectral energy distribution) and estimate their contribution to the hard XRB.
Acknowledgments
CV and AC acknowledge partial support by the Italian Space agency under the contract ASI I/R/057/02. DMA is supported by the Royal Society. The authors would like to thank L. Angeretti for help with the plots, M. Mignoli and L. Pozzetti for useful discussions, and G. Zamorani for a careful reading of the manuscript. CV gratefully remembers Rosa B.
References
- [] Akiyama M., Ueda Y., Ohta, K., 2002, ApJ, 567, 42
- [] Almaini O. et al., 2000, MNRAS, 315, 325
- [] Arnaud K.A., 1996, in Jacoby G., Barnes J., eds, ASP Conf. Ser. Vol. 101, Astronomical Data Analysis Software and Systems V. Astron. Soc. Pac., San Francisco, p. 17
- [] Avni Y., 1976, ApJ, 210, 642
- [] Barger A.J. et al., 2003, AJ, 126, 632
- [] Bassani L., Dadina M., Maiolino R., Salvati M., Risaliti G., della Ceca R., Matt G., Zamorani G., 1999, ApJS, 121, 473
- [] Becker R.H., White R.L., Helfand D.J., 1995, ApJ, 450, 559
- [] Brandt W.N., Fabian A.C., Takahashi K., Fujimoto R., Yamashita A., Inoue H., Ogasaka Y., 1997, MNRAS, 290, 617
- [] Brusa M. et al., 2003, A&A, 409, 65
- [] Caccianiga A. et al., 2004, A&A, 416, 901
- [] Collinge M.J., Brandt W.N., 2000, MNRAS, 317, L35
- [] Comastri A. et al., 2001, MNRAS, 327, 781
- [] Crawford C.S., Fabian A.C., Gandhi P., Wilman R.J., Johnstone R.M., 2001, MNRAS, 324, 427
- [] Crawford C.S., Gandhi P., Fabian A.C., Wilman R.J., Johnstone R.M., Barger A.J., Cowie L.L., 2002, MNRAS, 333, 809
- [] Cruddace R.G., Hasinger G., Schmitt, J.H.M.M., 1988, in Murtagh F., Heck A., eds, ESO Conf. and Workshop Proc. 28, Astronomy from large databases: Scientific objectives and methodological approaches, p. 177
- [] Deluit S., Courvoisier T.J.-L., 2003, A&A, 399, 77
- [] Dickey J.M., Lockman F.J., 1990, ARA&A, 28, 215
- [] Djorgovski S.G., Mahabal A.A., Brunner R.J., Gal R.R., Castro S., de Carvalho R.R., Odewahn S.C., 2001, in Brunner R.J., Djorgovski S.G., Szalay A.S., eds, ASP Conf. Ser. 225, Virtual Observatories of the Future. Astron. Soc. Pac., San Francisco, p. 52
- [] Fiore F. et al., 2003, A&A, 409, 79
- [] Franceschini A., Bassani L., Cappi M., Granato G.L., Malaguti G., Palazzi E., Persic M., 2000, A&A, 353, 910
- [] Gandhi P., Crawford C.S., Fabian A.C., Johnstone R.M., 2004, MNRAS, 348, 529
- [] Gilli R., Salvati M., Hasinger G., 2001, A&A, 366, 407
- [] Giommi P., Angelini L., Jacobs P., Tagliaferri G., 1992, in Worrall D.M., Biemesderfer C., Barnes J., eds, ASP Conf. Ser. 25, Astronomical Data Analysis Software and Systems I. Astron. Soc. Pac., San Francisco, p. 100
- [] Halpern J., Turner T., George I., 1999, MNRAS, 307, L47
- [] Kewley L.J., Dopita M.A., Sutherland R.S., Heisler C.A., Trevena J., 2001, ApJ, 556, 121
- [] Kirsch M., 2003, XMM-Newton Users Group Meeting Presentations (CAL-TN-0018-2-1)
- [] Mainieri V. et al., 2002, A&A, 393, 425
- [] Maiolino R., Salvati M., Bassani L., Dadina M., della Ceca R., Matt G., Risaliti G., Zamorani G., 1998, A&A, 338, 781
- [] Malizia A., Bassani L., Stephen J.B., Di Cocco G., Fiore F., Dean A.J., 2003, ApJ, 589, L17
- [] Markowitz A., Edelson R., Vaughan S., 2003, ApJ, 598, 935
- [] Mukai K., 2001, PIMMS Users’ Guide (Greenbelt: NASA/GSFC)
- [] Mulchaey J.S. et al., 1994, ApJ, 436, 586
- [] Nandra K., Pounds K.A., 1994, MNRAS, 268, 405
- [] Norman C. et al., 2002, ApJ, 571, 218
- [] Perola G.C. et al., 2004, A&A, 421, 491
- [] Reeves J.N., Turner M.J.L., 2000, MNRAS, 316, 234
- [] Risaliti G., 2002, A&A, 386, 379
- [] Schmidt M., Green R.F., 1983, ApJ, 269, 352
- [] Spergel D.N. et al., 2003, ApJS, 148, 175
- [] Stern D. et al., 2002, ApJ, 568, 71
- [] Szokoly G.P. et al., 2004, ApJS, in press (astro-ph/0312324)
- [] Ueda Y., Akiyama M., Ohta K., Miyaji T., 2003, ApJ, 598, 886
- [] Vignali, C., Comastri, A., Fiore, F., & La Franca, F. 2001, A&A, 370, 900
- [] Vignali C., Brandt W.N., Schneider D.P., 2003, AJ, 125, 433
- [] Vignali C., Brandt W.N., Boller Th., Fabian A.C., Vaughan S., 2004, MNRAS, 347, 854
- [] Voges W. et al., 1999, A&A, 349, 389
- [] Williams R.J., Pogge R.W., Mathur S., 2002, AJ, 124, 3042
- [] York D.G. et al., 2000, ApJ, 120, 1579
- [] Zakamska N.L. et al., 2003, ApJ, 126, 2125 (Z03)
- [] Zakamska N.L., Strauss M.A., Heckman T.M., Ivezic Z., Krolik J.H., 2004, AJ, in press (astro-ph/0406248)
- [] Zimmermann H.U., Boese G., Becker W., Belloni T., Döbereiner S., Izzo C., Kahabka P., Schwentker O., 1998, EXSAS User’s Guide, MPE Report, ROSAT Scientific Data Center