Old Galaxies in the Young Universe
A. Cimatti1, E. Daddi2, A. Renzini2, P. Cassata3,
E. Vanzella3, L. Pozzetti4, S. Cristiani5, A. Fontana6,
G. Rodighiero3, M. Mignoli4, G. Zamorani4
1 INAF - Osservatorio Astrofisico di Arcetri, Largo E. Fermi 5,
I-50125, Firenze, Italy
2 European Southern Observatory, Karl-Schwarzschild-Str. 2, D-85748,
Garching, Germany
3 Dipartimento di Astronomia, Università di Padova, Vicolo
dell’Osservatorio, 2, I-35122 Padova, Italy
4 INAF - Osservatorio Astronomico di Bologna, via Ranzani 1, I-40127,
Bologna, Italy
5 INAF - Osservatorio Astronomico di Trieste, Via Tiepolo 11, I-34131
Trieste, Italy
6 INAF - Osservatorio Astronomico di Roma, via dell’Osservatorio 2,
Monteporzio, Italy
More than half of all stars in the local Universe are found in massive spheroidal galaxies1, which are characterized by old stellar populations2,3 with little or no current star formation. In present models, such galaxies appear rather late as the culmination of a hierarchical merging process, in which larger galaxies are assembled through mergers of smaller precursor galaxies. But observations have not yet established how, or even when, the massive spheroidals formed2,3, nor if their seemingly sudden appearance when the Universe was about half its present age (at redshift ) results from a real evolutionary effect (such as a peak of mergers) or from the observational difficulty of identifying them at earlier epochs. Here we report the spectroscopic and morphological identification of four old, fully assembled, massive ( solar masses) spheroidal galaxies at , the most distant such objects currently known. The existence of such systems when the Universe was only one-quarter of its present age, shows that the build-up of massive early-type galaxies was much faster in the early Universe than has been expected from theoretical simulations4.
In the CDM scenario5, galaxies are thought to build-up their present-day mass through a continuous assembly driven by the hierarchical merging of dark matter halos, with the most massive galaxies being the last to form. However, the formation and evolution of massive spheroidal early-type galaxies is still an open question.
Recent results indicate that early-type galaxies are found up to with a number density comparable to that of local luminous E/S0 galaxies6,7, suggesting a slow evolution of their stellar mass density from to the present epoch. The critical question is whether these galaxies do exist in substantial number8,9 at earlier epochs, or if they were assembled later10,11 as favored by most renditions of the hierarchical galaxy formation scenario4. The problem is complicated also by the difficulty of identifying such galaxies due to their faintness and, for , the lack of strong spectral features in optical spectra, placing them among the most difficult targets even for the largest optical telescopes. For example, while star-forming galaxies are now routinely found up to 12, the most distant spectroscopically confirmed old spheroid is still a radio–selected object at discovered almost a decade ago13,14.
One way of addressing the critical question of massive galaxy formation is to search for the farthest and oldest galaxies with masses comparable to the most massive galaxies in the present-day universe ( M⊙), and to use them as the “fossil” tracers of the most remote events of galaxy formation. As the rest-frame optical – near-infrared luminosity traces the galaxy mass15, the -band (m in the observer frame) allows a fair selection of galaxies according to their mass up to .
Following this approach, we recently conducted the K20 survey16 with the Very Large Telescope (VLT) of the European Southern Observatory (ESO). Deep optical spectroscopy was obtained for a sample of 546 objects with (Vega photometric scale) and extracted from an area of 52 arcmin2, including 32 arcmin2 within the GOODS–South field 17 (hereafter the GOODS/K20 field). The spectroscopic redshift () completeness of the K20 survey is 92%, while the available multi-band photometry () allowed us to derive the spectral energy distribution (SED) and photometric redshift () of each galaxy. The K20 survey spectroscopy was complemented with the ESO/GOODS public spectroscopy (Supplementary Table 1).
The available spectra within the GOODS/K20 field were then used to search for old, massive galaxies at . We spectroscopically identified four galaxies with and which have rest-frame mid-UV spectra with shapes and continuum breaks compatible with being dominated by old stars and (the colour expected at for old passively evolving galaxies due to the combination of old stellar populations and k-correction effects9). The Supplementary Table 1 lists the main galaxy information. The spectrum of each individual object allows a fairly precise determination of the redshift based on absorption features and on the overall spectral shape (Fig. 1).
The co-added average spectrum of the four galaxies (Fig. 2–3) shows a near-UV continuum shape, breaks and absorption lines that are intermediate between those of a F2 V and a F5 V star18, and typical of about 1-2 Gyr old synthetic stellar populations19,20. It is also very similar to the average spectrum of old Extremely Red Objects7 (EROs), and slightly bluer than that of the SDSS red luminous galaxies21 and of the old galaxy LBDS 53w09113. However, it is different in shape and slope from the average spectrum of dusty star-forming EROs7.
The multi-band photometric SED of each galaxy was successfully fitted without the need for dust extinction, and using a library of simple stellar population (SSP) models19 with a wide range of ages, and Salpeter IMF. This procedure yielded best-fitting ages of 1.0-1.7 Gyr, the mass-to-light ratios and hence the stellar mass of each galaxy, which results in the range of 1–3 M⊙. km s-1 Mpc-1 (with ), and are adopted.
In addition to spectroscopy, the nature of these galaxies was investigated with the fundamental complement of Hubble Space Telescope+ ACS (Advanced Camera for Surveys) imaging from the GOODS public Treasury Program17. The analysis of the ACS high-resolution images reveals that the surface brightness distribution of these galaxies is typical of elliptical/early-type galaxies (Fig. 4).
Besides pushing to the identification of the highest redshift elliptical galaxy, these objects are very relevant to understand the evolution of galaxies in general for three main reasons: their old age, their high mass, and their substantial number density.
Indeed, an average age of about 1-2 Gyr () at implies that the onset of the star formation occurred not later than at ( for ). These are strict lower limits because they follow from assuming instantaneous bursts, whereas a more realistic, prolonged star formation activity would push the bulk of their star formation to an earlier cosmic epoch. As an illustrative example, the photometric SED of ID 646 () can be reproduced (without dust) with either a 1 Gyr old instantaneous burst occurred at , or with a 2 Gyr old stellar population with a star formation rate declining with ( Gyr). In the latter case, the star formation onset would be pushed to and half of the stars would be formed at . In addition, with stellar masses , these systems would rank among the most massive galaxies in the present-day universe, suggesting that they were fully assembled already at this early epoch.
Finally, their number density is considerably high. Within the comoving volume relative to 32 arcmin2 and (40,000 Mpc3), the comoving density of such galaxies is about Mpc-3, corresponding to a stellar mass density of about M⊙Mpc-3, i.e. about 10% of the local () value22 for masses greater than M⊙. This mass density is comparable to that of star-forming galaxies at 23, suggesting that while the most massive galaxies in the local universe are now old objects with no or weak star formation, by passive and active star-forming massive galaxies coexist in nearly equal number.
Although more successful than previous models, the most recent realizations of semi-analytic hierarchical merging simulations still severely underpredict the density of such old galaxies: just one old galaxy with , , and is present in the mock catalog4 for the whole five times wider GOODS/CDFS area.
As expected for early-type galaxies9,24, the three galaxies at may trace the underlying large scale structure. In this case, our estimated number density may be somewhat biased toward a high value. On the other hand, the number of such galaxies in our sample is likely to be a lower limit due to the spectroscopic redshift incompleteness. There are indeed up to three more candidate old galaxies in the GOODS/K20 sample with , , and compact HST morphology. Thus, in the GOODS/K20 sample the fraction of old galaxies among the whole galaxy population is 158% (spectroscopic redshifts only), or up to 2511% if also all the 3 additional candidates are counted.
It is generally thought that the so-called “redshift desert” (i.e. around ) represents the cosmic epoch when most star formation activity and galaxy mass assembly took place25. Our results show that, in addition to actively star forming galaxies26, also a substantial number of “fossil” systems already populate this redshift range, and hence remain undetected in surveys biased towards star-forming systems. The luminous star-forming galaxies found at in sub-mm27 and near-infrared23,28 surveys may represent the progenitors of these old and massive systems.
1. Fukugita, M., Hogan, C.J., Peebles, P.J.E. The Cosmic Baryon Budget.
Astrophys. J. 503, 518-530 (1998).
2. Renzini, A. Origin of Bulges. In “The formation of galactic
bulges”, ed. C.M. Carollo, H.C. Ferguson, R.F.G. Wyse, Cambridge
University Press, p.9-26 (1999).
3. Peebles, P.J.E. When did the Large Elliptical Galaxies Form?
In “A New Era in Cosmology”, ASP Conference Proceedings, Vol. 283.
ed. N. Metcalfe and T. Shanks, Astronomical Society of the Pacific,
2002., p.351-361 (2002).
4. Somerville, R.S. et al. The Redshift Distribution of
Near-Infrared-Selected Galaxies in the Great Observatories Origins Deep
Survey as a Test of Galaxy Formation Scenarios. Astrophys. J., 600, L135-139
(2004).
5. Freedman, W.L. & Turner, M.S. Colloquium: Measuring and
understanding the universe. Reviews of Modern Physics, 75,
1433-1447 (2003).
6. Im, M. et al. The DEEP Groth Strip Survey. X. Number Density and
Luminosity Function of Field E/S0 Galaxies at . Astrophys. J. 571,
136-171 (2002).
7. Cimatti, A. et al. The K20 survey. I. Disentangling old and dusty
star-forming galaxies in the ERO population. Astron. Astrophys. 381, L68-73
(2002).
8. Benitez, N. et al. Detection of Evolved High-Redshift Galaxies in
Deep NICMOS/VLT Images. Astrophys. J. 515, L65-69 (1999).
9. Daddi, E. et al. Detection of strong clustering of extremely red
objects: implications for the density of ellipticals. Astron.
Astrophys. 361, 535-549 (2000).
10. Zepf, S.E. Formation of elliptical galaxies at moderate redshifts.
Nature 390, 377-380 (1997).
11. Rodighiero G., Franceschini A., Fasano G. Deep Hubble Space Telescope
imaging surveys and the formation of spheroidal galaxies. Mon. Not. R.
Astron. Soc. 324, 491-497 (2001).
12. Taniguchi, Y. et al. Lyman Emitters beyond Redshift 5: The
Dawn of Galaxy Formation. Journal of the Korean Astronomical Society 36,
no.3, 123-144 (2003).
13. Dunlop, J.S. et al. A 3.5-Gyr-old galaxy at redshift 1.55. Nature,
381, 581-584 (1996).
14. Spinrad, H., Dey, A., Stern, D., Dunlop, J., Peacock, J., Jimenez,
R., Windhorst, R. LBDS 53W091: an Old, Red Galaxy at z=1.552. Astrophys.
J., 484, 581-601 (1997).
15. Gavazzi, G., Pierini, D., Boselli, A., The phenomenology of disk
galaxies. Astron. Astrophys. 312, 397-408 (1996).
16. Cimatti, A. et al. The K20 survey. III. Photometric and
spectroscopic properties of the sample. Astron. Astrophys. 392, 395-406
(2002).
17. Giavalisco, M. et al., The Great Observatories Origins Deep Survey:
Initial Results from Optical and Near-Infrared Imaging. Astrophys. J. 600,
L93-98 (2004).
18. Pickles, A.J. A Stellar Spectral Flux Library: 1150-25000 Å.
PASP 110, 863-878 (1998).
19. Bruzual, G. & Charlot, S. Stellar population synthesis at the
resolution of 2003. Mon. Not. R. Astron. Soc. 344, 1000-1028 (2003).
20. Jimenez, R. et al. Synthetic stellar populations: single stellar
populations, stellar interior models and primordial proto-galaxies,
Mon. Not. R. Astron. Soc. 349, 240-254 (2004).
21. Eisenstein, D.J. et al. Average Spectra of Massive Galaxies in the
Sloan Digital Sky Survey. Astrophys. J. 585, 694-713 (2003).
22. Cole, S. et al. The 2dF galaxy redshift survey: near-infrared galaxy
luminosity functions. Mon. Not. R. Astron. Soc., 326, 255-273 (2001).
23. Daddi, E. et al., Near-Infrared Bright Galaxies at . Entering
the Spheroid Formation Epoch ? Astrophys. J., 600, L127-131 (2004).
24. Davis, M., Geller, M.J. Galaxy Correlations as a Function of
Morphological Type. Astrophys. J., 208, 13-19 (1976).
25. Dickinson, M., Papovich, C., Ferguson, H.C., Budavari, T. The
Evolution of the Global Stellar Mass Density at . Astrophys. J.,
587, 25-40 (2003).
26. Steidel, C.C. et al. A Survey of Star-Forming Galaxies in the
z=1.4-2.5 ‘Redshift Desert’: Overview. Astrophys. J. 604, 534-550 (2004).
27. Genzel, R., Baker, A.J., Tacconi, L.J., Lutz, D., Cox, P.; Guilloteau,
S., Omont, A. Spatially Resolved Millimeter Interferometry of SMM
J02399-0136: A Very Massive Galaxy at . Astrophys. J. 584, 633-642
(2003).
28. Franx, M. et al. A Significant Population of Red, Near-Infrared-selected
High-Redshift Galaxies. Astrophys. J., 587, L79-L83 (2003).
29. Pignatelli, E. & Fasano, G. GASPHOT: A Tool for Automated Surface
Photometry of Galaxies. Astrophys. Sp. Sci. 269, 657-658 (1999).
30. Peng, C.Y., Ho, L.C., Impey, C.D., Rix, H.-W., Detailed Structural
Decomposition of Galaxy Images. Astron. J., 124, 266-293 (2002).
Correspondence and requests for material should be sent to Andrea Cimatti (cimatti@arcetri.astro.it).
This work is based on observations made at the European Southern Observatory, Paranal, Chile, and with the NASA/ESA Hubble Space Telescope obtained at the Space Telescope Science Institute, which is operated by the Association of Universities for Research in Astronomy (AURA). We thank Rachel Somerville for information on the GOODS/CDFS mock catalog. We are grateful to the GOODS Team for obtaining and releasing the HST and FORS2 data.
Figure 1
The individual and average spectra of the detected galaxies. From bottom to top: the individual spectra smoothed to a 16 Å boxcar (26 Å for ID 237) and the average spectrum of the four old galaxies (). The red line is the spectrum of the old galaxy LBDS 53w091 () used to search for spectra with a similar continuum shape. Weak features in individual spectra (e.g. MgII2800 and the 2640 Å continuum break, B2640) become clearly visible in the average spectrum. The object ID 235 has also a weak [OII]3727 emission (not shown here). The spectra were obtained with ESO VLT+FORS2, grisms 200I (R(400) (ID 237) and 300I (R(600) (IDs 235,270,646), 1.0′′ wide slit and seeing conditions. The integrations times were 3 hours for ID 237, 7.8 hours for IDs 235 and 270, and 15.8 hours for ID 646. For ID 646, the ESO/GOODS public spectrum was co-added to our K20 spectrum (see Supplementary Tab. 1). “Dithering” of the targets along the slits was applied to remove efficiently the CCD fringing pattern and the strong OH sky lines in the red. The data reduction was done with the IRAF software package (see16). The spectrophotometric calibration of all spectra was achieved and verified by observing several standard stars. The average spectrum, corresponding to 34.4 hours integration time, was obtained by co-adding the individual spectra convolved to the same resolution, scaled to the same arbitrary flux (i.e. with each spectrum having the same weight in the co-addition), and assigning wavelength–dependent weights which take into account the noise in the individual spectra due to the OH emission sky lines.
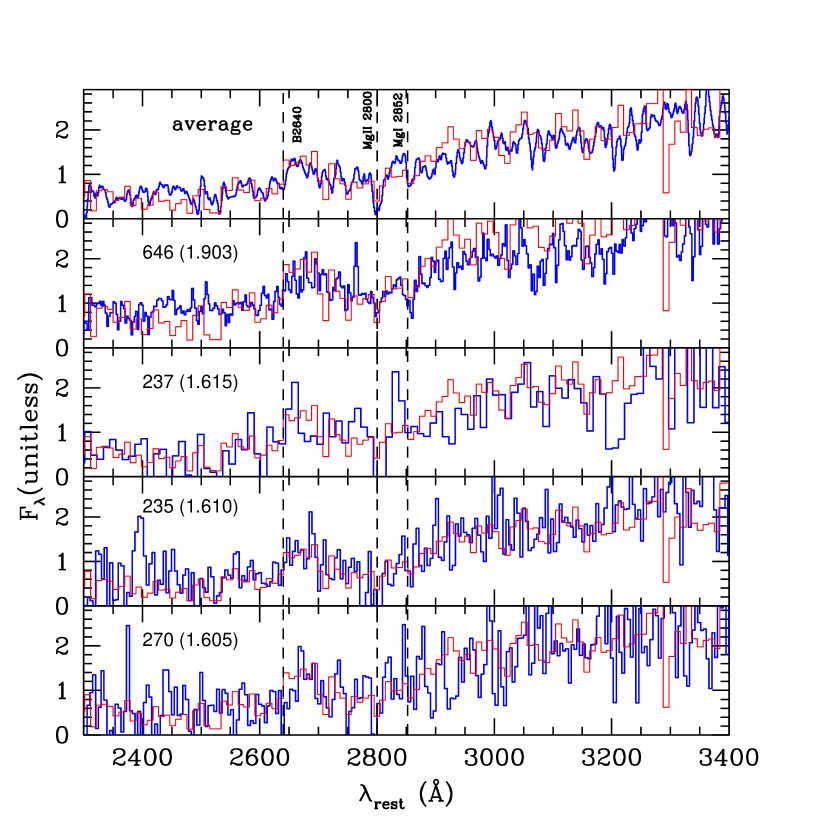
Figure 2
The detailed average spectrum of the detected galaxies. A zoom on the average spectrum (blue) compared with the synthetic spectrum19 of a 1.1 Gyr old simple stellar population (SSP) with solar metallicity () and Salpeter IMF (red). The observed average spectrum was compared to a library of synthetic SSP template spectra19,20 with a range of ages of 0.1-3.0 Gyr with a step of 0.1 Gyr, and with assumed metallicities =0.4, 1.0, and 2.5. The best fit age for each set of synthetic templates was derived through a minimization over the rest-frame wavelength range 2300–3400 Å. The rms as a function of wavelength used in the procedure was estimated from the average spectrum computing a running mean rms with a step of 1 Å and a box size of 20 Å, corresponding to about three times the resolution of the observed average spectrum. The median signal-to-noise ratio is 20 per resolution element in the 2300–3400 Å range. The wavelength ranges including the strongest real features (i.e. absorptions and continuum breaks) were not used in the estimate of the rms. The resulting reduced is of the order of unity for the best fit models. In the case of solar metallicity, the ranges of ages acceptable at 95% confidence level are Gyr and Gyr for SSP models of19 and20 respectively (see also Fig. 3, top panel). Ages younger or older are also acceptable for or respectively. The 2640 Å and 2900 Å continuum break13 amplitudes measured on the average spectrum are B2640=1.80.1 and B2900=1.20.1. These values are consistent with the ones expected in SSP models19-20 for ages around 1–1.5 Gyr and solar metallicity. For instance, the SSP model spectrum shown here has B2640=1.84 and B2900=1.27.
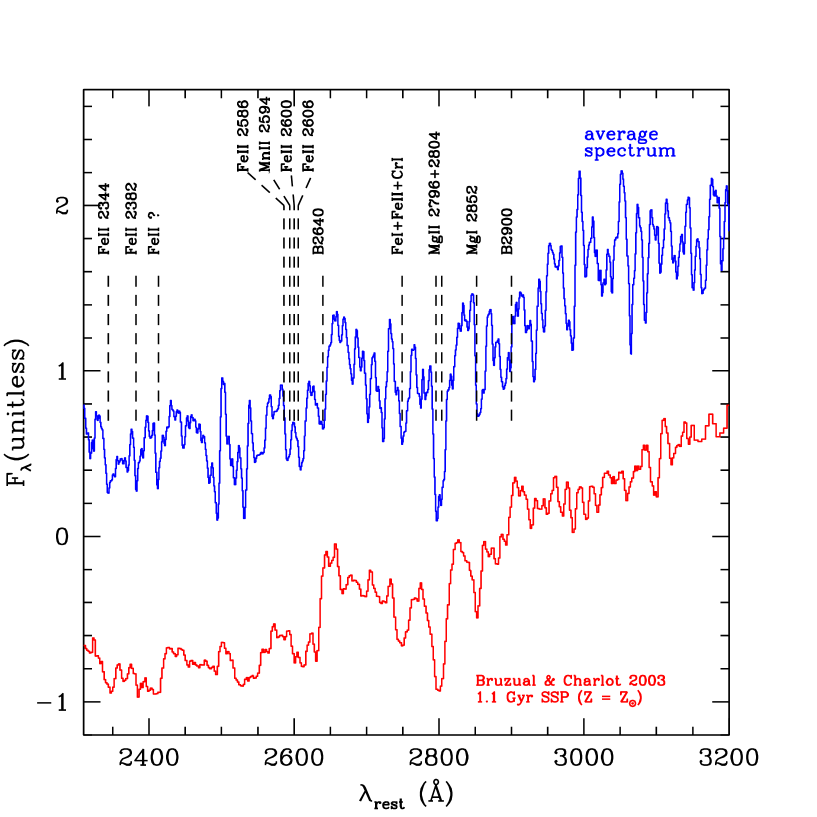
Figure 3
The comparison between the average spectrum and a set of spectral templates. The average spectrum (blue) compared to a set of template spectra. From bottom: F2 V (green) and F5 V (red) stellar spectra18 with , the composite spectrum (red) of 726 luminous red galaxies at selected from the SDSS21 (available only for Å), the average spectra of old (red) and dusty star-forming (green) EROs7, SSP synthetic spectra19 (, Salpeter IMF) with ages of 0.5 Gyr (magenta), 1.1 Gyr (green) and 3.0 Gyr (red).
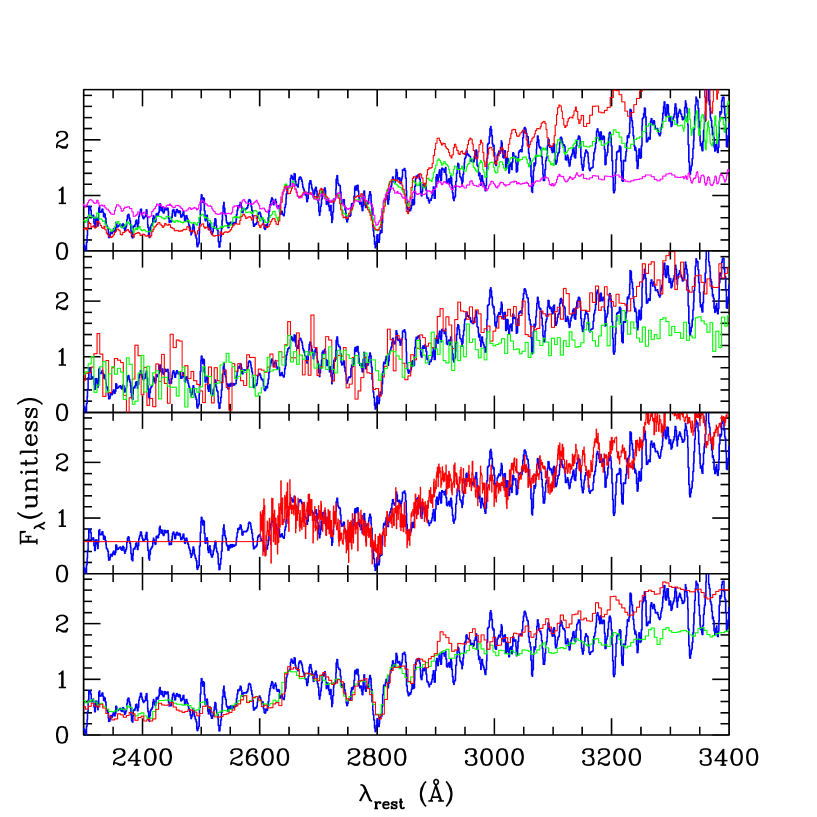
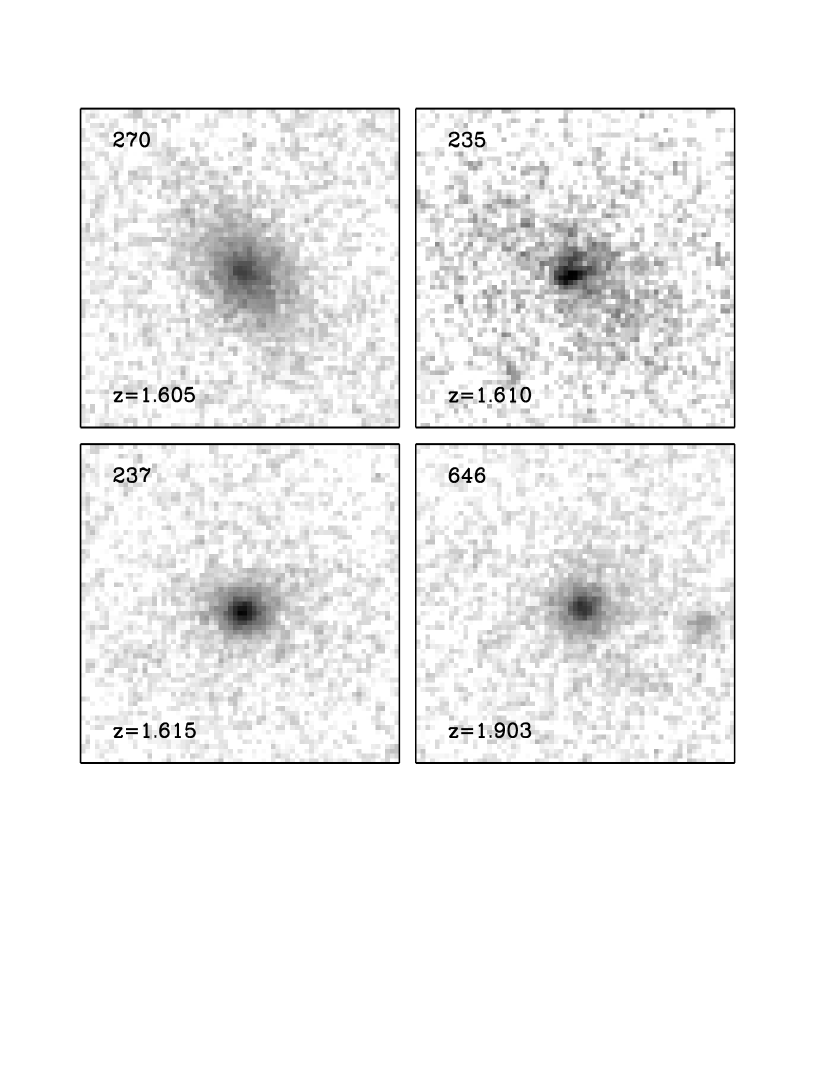
Figure 4
The morphological properties of the detected galaxies. Images of the four galaxies taken with the Hubble Space Telescope +ACS through the F850LP filter (from GOODS data17) which samples the rest-frame 3000-3500 Å for . The images are in logarithmic grey–scale and their size is , corresponding to kpc for the average redshift and the adopted cosmology. At a visual inspection, the galaxies show rather compact morphologies with most of the flux coming from the central regions. A fit of their surface brightness profiles was performed with a “Sersic law” () convolved with the average point spread function extracted from the stars in the ACS field and using the GASPHOT29 and GALFIT30 software packages. Objects ID 237 and ID 646 have profiles with acceptable values of in the range of , i.e., typical of elliptical galaxies, object ID 270 is better reproduced by a flatter profile (), whereas a more ambiguos result is found for the object showing some evidence of irregularities in the morphology (ID 235, ). These latter objects may be bulge-dominated spirals but no bulge/disk decomposition was attempted. Ground-based near-infrared images taken under 0.5′′ seeing conditions with the ESO VLT+ISAAC through the filter (rest-frame 6000-8000 Å) show very compact morphologies, but no surface brightness fitting was done.
SUPPLEMENTARY TABLE 1
The detected galaxies
| IAU | K20 | R.A. (J2000) | Dec (J2000) | Spectrum | |||
|---|---|---|---|---|---|---|---|
| ID | ID | h m s | |||||
| J033210.79-274627.8 | 235 | 03 32 10.776 | -27 46 27.73 | 17.980.04 | 6.470.10 | 1.610 | K20 |
| J033210.52-274628.9 | 237 | 03 32 10.507 | -27 46 28.84 | 19.050.05 | 6.830.28 | 1.615 | K20 |
| J033212.53-274629.2 | 270 | 03 32 12.525 | -27 46 29.16 | 18.740.05 | 5.990.10 | 1.605 | K20 |
| J033233.85-274600.2 | 646 | 03 32 33.847 | -27 46 00.24 | 19.070.07 | 5.990.10 | 1.903 | K20+GOODS |
Supplementary Table 1
IAU ID: official identification number in the GOODS–South catalog (z-band)
(http://www.stsci.edu/science/goods/catalogs).
K20 ID: identification number in the K20 survey catalog
(http://www.arcetri.astro.it/k20/).
R.A., Dec: Right Ascension and Declination at equinox J2000 based on
the public ESO/GOODS -band VLT+ISAAC image.
: K20 survey total magnitude in the -band (Vega scale).
color (Vega scale) in 2′′ diameter aperture.
: spectroscopic redshift.
Spectrum: K20: K20 survey, GOODS: public ESO/GOODS VLT+FORS2
spectroscopy (Vanzella et al., in preparation;
http://www.eso.org/science/goods).