First results from the ATCA 18 GHz pilot survey
Abstract
As a pilot study for the first all–sky radio survey at short wavelengths, we have observed 1216 deg2 of the southern sky at 18 GHz (16 mm) using a novel wide–band (3.4 GHz bandwidth) analogue correlator on one baseline of the Australia Telescope Compact Array (ATCA). We scanned a region of sky between declination and with an rms noise level of 15 mJy. Follow–up radio imaging of candidate sources above a 4 detection limit of 60 mJy resulted in 221 confirmed detections, for which we have measured accurate positions and flux densities. For extragalactic sources, the survey is roughly 70% complete at a flux density of 126 mJy and 95% complete above 300 mJy. Almost half the detected sources lie within a few degrees of the Galactic plane, but there are 123 sources with which can be assumed to be extragalactic. The differential source counts for extragalactic sources in the range are well fitted by a relation of the form , in good agreement with the 15 GHz counts published by Taylor et al. (2001) and Waldram et al. (2003). Over 70% of the extragalactic sources have a flat radio spectrum (, S), and 29% have inverted radio spectra (). The optical identification rate is high: 51% of the extragalactic sources are identified with stellar objects (candidate QSOs), 22% with galaxies and only 27% with faint optical objects or blank fields.
keywords:
surveys — cosmic microwave background — galaxies: radio continuum — galaxies: active — radio continuum: general1 Introduction
The radio–source population above 5 GHz has not yet been well studied. This is mainly because large radio telescopes typically have fields of view of a few arcmin at high frequencies, making it extremely time–consuming to carry out large–area surveys. Measuring the high–frequency properties of extragalactic radio sources is also crucial for interpreting the high–sensitivity and high–resolution maps of the Cosmic Microwave Background (CMB) provided by WMAP (Bennett et al. 2003) and forthcoming missions like ESA’s Planck satellite (Tauber 2001). Current analyses (De Zotti et al. 1999a) indicate that the best regions for high–resolution CMB mapping lie near 100 GHz, and that the main contaminant is likely to be the fluctuations due to individual foreground radio sources.
The brightest high–frequency radio sources are expected to be blazars (high and low-polarization flat-spectrum quasars and BL Lac objects) and galaxies with highly–inverted radio spectra such as the GHz Peaked Spectrum (GPS) sources (O’Dea 1998). The Michigan 8 GHz (3.8 cm) survey covered deg2 of sky and detected 55 sources down to a limiting flux density of 0.6 Jy. These sources were found to be different from those detected in low–frequency surveys, with 70% having flat or inverted spectra. More than 80% had optical counterparts on the Palomar Sky Survey, most of them QSOs (Brandie & Bridle 1974; Brandie, Bridle & Kesteven 1974).
The first blind radio survey above 8 GHz was carried out by Taylor et al. (2001) with the Ryle Telescope. They observed 63 deg2 of sky and detected 66 sources to a limiting flux density of 20 mJy at 15.2 GHz. A significant fraction (20%) of the sources they detected would not have been predicted by a simple extrapolation from lower–frequency surveys. Two–thirds of their sources had flat or inverted spectra. The source density observed by Taylor et al. was also a factor of 1.3–2 lower than predicted by theoretical models based on low-frequency radio luminosity functions (Dunlop & Peacock 1990; Toffolatti et al. 1998).
The 15 GHz survey was extended by Waldram et al. (2003) to 520 deg2 in three regions of sky targeted by the Very Small Array (Watson et al. 2003). They found 465 sources above a completeness limit of 25 mJy in their main survey, although a total of 760 sources were detected down to a limiting flux density of 10 mJy.
Preliminary radio source counts at 30 GHz have been measured by the DASI (Leitch et al. 2002), VSA (Grainge et al. 2003) and CBI (Mason et al. 2003) groups, and a catalogue of 208 point source candidates stronger than about 1 Jy from the first year of WMAP data (five frequency bands from 23–94 GHz) has recently been published by Bennett et al. (2003).
In this paper, we present the results of a 18 GHz Pilot Survey at the Australia Telescope Compact Array (ATCA)111See www.narrabri.atnf.csiro.au and Journal of Electrical and Electronics Engineering, Australia, Special Issue, Vol. 12, No. 2, June 1992. The pilot survey covered 1216 deg2 of sky in the region between and to a (4) limiting flux density of 60 mJy. In the follow-up observations we confirmed 221 sources.
In Section 2, we briefly describe the survey strategy and give some details of the observing run. Section 3 describes the data–reduction strategy for the scan data, which has some novel features. Follow-up synthesis imaging observations of the detected sources are described in Section 4, and their data reduction in Section 5. Section 6 presents the follow-up results, Section 7 a comparison with surveys at other frequencies, Section 8 the optical identifications and Section 9 summarizes our conclusions.
2 Survey strategy and observations
An analogue wide–band prototype correlator originally developed for the Taiwanese CMB instrument AMiBA (Lo et al. 2001) was linked to two ATCA antennas to produce a two–element interferometer with 3.4 GHz bandwidth. The two 22m antennas were placed on the shortest ATCA baseline (30 m), giving a fringe spacing of arcsec at the centreband frequency of 18 GHz. The correlator produced 16 lag channels corresponding (after the Fourier inversion) to 8 frequency channels, each with a bandwidth of 425 MHz. This large total bandwidth allowed us to obtain high signal-to-noise measurements in the very short integration time used (0.2 sec/beam). Such rapid scanning was a design feature of the ATCA implemented to perform mosaic observation over large areas. This combination of wide bandwidth and fast scanning has made it possible to observe a large fraction of the sky despite the small ATCA primary beam at 18 GHz ( arcmin). Only a single linear polarization was implemented in this correlator configuration.
No delay tracking had been built for this analogue correlator (AMiBA antennas are on a common tracking mount) so we designed an observing mode in which all observations are taken on the meridian where the delay for an east–west interferometer is zero.
The scanning strategy was as follows: the two ATCA antennas point in the same direction and scan the sky synchronously up and down between and in elevation along the meridian with a scan rate of 10∘ per minute (the maximum speed the antennas can slew in a closed loop in elevation). The Earth’s rotation then allows us to cover a strip of the sky in raster scan mode. Antenna coordinates were sampled at 10 Hz. With an integration time of 80 ms, the antenna pointing was recorded every 0.8 arcmin.
The pilot survey run took place on 2002 September 13–17 during one observing period of 96 hours.
3 Survey data reduction
The antenna positions (obtained from the telescope encoders) and fringe visibilities (produced by the analogue correlator) were stored in data files. Custom MIRIAD (Sault, Teuben & Wright 1995) tasks were written to flag out bad data (e.g. antenna pointings more than 30″ from one another) and to calibrate the visibilities in absolute flux and bandpass.
The next stage involved searching for peaks in the fringe visibility amplitudes above a given signal-to-noise ratio in the time-ordered raster scans, to produce a candidate source list. This was done using the following steps:
-
1.
We calculated the weighted complex mean of the 8 separate frequency channels to form a single 3.4 GHz wide band. The bandwidth smearing (Thompson 1999) in the worst case (a source at half power point of the primary beam) is 1/6 of the fringe spacing and can be ignored. Expressed in a different way our 15% bandwidth corresponds to a 5.6m variation in the 30m spacing used, which is a small fraction of the 22m dish diameter.
-
2.
We apply a beam shape Gaussian (.3) filter acting as a weighted running mean for this short baseline to smooth out fluctuations (generated by receiver noise) on spatial scales less than the antenna primary beam.
-
3.
In the plane defined by the real an imaginary parts of the fringe visibility we determined the dispersion along each axis. Points lying at are selected as candidate sources at level. In general a source generates up to 4 contiguous points along the time series corresponding to the sampling by different parts of the beam in steps of 0.8 arcmin. The candidate source position corresponds to the maximum visibility amplitude in this sequence.
-
4.
We created a list of candidate point–source detections at a range of signal-to-noise ratios (3, 3.5, 4 and 5 ) to explore the optimum detection strategy.
The raw candidate source lists were then merged into a single list. The number of candidate sources for the entire survey was 574. The measured rms noise in the scans was mJy.
We performed a Monte Carlo simulation to estimate the number of spurious peaks generated by Gaussian noise at a given signal–to–noise ratio (see Table 1). The same number of real and imaginary parts of the fringe visibilities for each frequency channel was generated 30 times by sampling a Gaussian distribution with the same mean and standard deviation as the actual distributions. A cutoff value of was chosen as a good trade-off, since lower values yield too many spurious peaks while for we reject too many sources which are genuine detections. Since the S/N in the follow-up is very high compared with the 0.2 sec survey integration, we could afford to explore the detection statistics by going well into the region of spurious detections due to noise.
| S/N | ||
|---|---|---|
| 3 | 542 | 52921 |
| 3.5 | 111 | 10410 |
| 4 | 24 | 164 |
| 5 | 5 | 0.130.35 |
4 Follow-up observations
Follow-up synthesis–imaging observations of the candidate sources were carried out on 2002 October 8–12 with the ATCA in its hybrid H168B configuration, which has antennas along the new 214 m Northern Spur as well as the existing east–west railway track. At the time of this run, only three antennas had been equipped with low–noise 12 mm receivers, so only three baselines were available for imaging. We therefore observed each object over a wide range in hour angle to maximize coverage. The angular resolution depends on the source declination. The median major and minor axis values are 30 and 13 arcsec respectively. The average rms noise in synthetized maps was mJy.
We used the standard ATCA correlator, allowing us to observe in two spectral windows centred at 17.2 and 18.7 GHz each with a bandwidth of 128 MHz. At 18 GHz, the standard ATCA primary calibrator is too faint to provide a good absolute flux density scale, and we used the planet Mars as our primary calibrator. The fringe–visibility amplitude dependence on spatial frequency has been accurately modelled for the ATCA. The Mars model we used is described in Ulich (1981) and Rudy (1987). As in Ulich (1981), the seasonal variation of Mars brightness temperature is also taken in account by the model.
5 Follow-up data reduction
5.1 Follow–up 18 GHz images
Reduction of the follow–up 18 GHz images was done in the standard way using the MIRIAD software package (Sault, Teuben & Wright 1995). The target sources and calibrators were imaged in total intensity (Stokes I) and circular polarization (Stokes V). The sources were assumed to have zero circular polarization, and the Stokes V maps were used to estimate the rms noise. We used the MIRIAD Multi–Frequency Synthesis (MFS) algorithm at the Fourier inversion stage, since this improves coverage by simultaneously Fourier–transforming the visibility data from both observing frequencies. After the Fourier inversion the maps were CLEANed, and the resulting clean components were restored using an elliptical Gaussian beam.
We used the maximum pixel value in the restored Stokes I map together with the V Stokes rms noise to calculate the map signal-to-noise (hereafter S/N) ratios. A source was considered to be detected when its S/N value was above 5.
The number of sources above this detection threshold was 282 out of 574 candidates. However, many candidate objects () were multiple detections of the same source, so that the actual number of spurious sources in the survey was smaller. These multiple observations were used to estimate data quality.
5.2 Flux density and position measurements
We reimaged the detected sources in all four Stokes parameters, applying the primary beam correction to restored maps and a natural weighting to the fringe visibilities before the Fourier inversion. The primary beam correction was only applied at this last stage, because the increase in noise near the map border complicates the detection statistics.
All but five of the confirmed (S/N) sources were well–fitted by a single elliptical Gaussian.
We created a final source list by removing all sources which had the same position (within the errors) as a previously–listed one. This decreased the final number of detected sources from 282 to 221, and most of the subsequent analysis was done on this list of objects. Source parameters determined by the MIRIAD IMFIT algorithm222Described in wwwatnf.csiro.au/computing/software/miriad/ taskindex.html for the confirmed sources are presented in Table 2. Any source having an angular size larger than 10 arcsec was dubbed (R) meaning “significantly resolved”. Because of angular size measurement errors, point-like sources at the resolution of follow-up images could appear resolved.
5.3 Polarization
Determining the level of polarization in foreground radio sources is critically important for the study of polarization anisotropies in the cosmic microwave background (e.g. Hu, Hedman & Zaldarriaga 2003). De Zotti et al. (1999b) and Mesa et al. (2002) estimate that extragalactic sources will not be a strong limiting factor in measurements of E-mode CMB polarization, but there are few existing measurements of the polarization of radio galaxies and quasars at frequencies above 5 GHz (Ricci et al. 2004).
For all the sources and calibrators we produced polarized intensity p, fractional polarization m and position angle PA maps and the relative error maps after clipping (i.e. blanking) pixels with S/N ratios below 3. The peak flux in the Q, U and I maps was then measured at the I map peak position using the MIRIAD MAXFIT task (see the MIRIAD web page in the previous footnote), and the fractional linear polarization estimated through the relation:
| (1) |
| Source | Frac. | ID | ||
|---|---|---|---|---|
| (deg) | (mJy) | pol. | ||
| 1147-6753 | 5.9 | 1150 | 2.0% | QSO |
| 1236-6150 | 1.0 | 422 | 0.7% | Galactic |
| 1243-6254 | 0.06 | 787 | 2.8% | Galactic |
| 1310-6245 | 0.03 | 379 | 5.0% | Galactic? |
| 1311-6246 | 0.01 | 1264 | 0.5% | Galactic? |
| 1337-6508 | 2.7 | 765 | 5.1% | Extragalactic |
| 1346-6021 | 1.8 | 1503 | 7.9% | Radio galaxy |
| 1400-6209 | 0.4 | 231 | 15.1% | Galactic |
| 1647-6438 | 12.5 | 534 | 6.9% | Radio galaxy |
| 1803-6507 | 19.6 | 945 | 2.0% | Radio galaxy |
| 1824-6717 | 22.4 | 105 | 16.2% | Radio galaxy? |
| 2303-6806 | 46.0 | 848 | 3.7% | QSO |
| 2312-6607 | 48.1 | 102 | 2.0% | QSO? |
Only 13 of the 221 follow-up confirmed sources were found to have a linear polarization intensity above 3, where is typically 6 mJy (Table 3). Six of these have and appear to be extragalactic. Two extra-galactic objects in the Galactic strip were also detected in polarization.
In Fig. 1 we show the fraction of 18 GHz polarized sources that were actually detected below a certain polarization level inside the sample of sources that could be detected below that polarization level. This statistical method, similar to the one used by Auriemma et. al (1977) to study radio luminosity functions, gives an estimate of the fractional polarization distribution. Error bars indicate the maximum range inside each polarization sub-sample. The first polarization level is strongly affected by small number statistical Poissonian errors, having 7 polarization detections out of 8 sources in which polarization could be detected. If we take only the extragalactic sources into account we have a median polarization of . The average flux density of all extragalactic sources contributing to the median is 1.0 Jy.

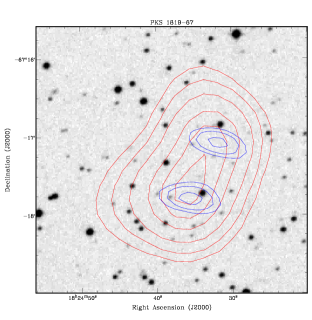
We also draw attention to the extragalactic source 18246717 (=PKS 181967), which has the highest fractional polarization so far measured in our sample at 16.2%. Since PKS 181967 is a widely–spaced (47 arcsec) double, with extended radio emission seen at lower frequencies (Fig. 2), it is unlikely to be a distant gravitationally–lensed radio galaxy. We are probably seeing a pair of radio hotspots in a powerful FRII radio galaxy. Since such sources are identified with intrinsically bright elliptical galaxies and no optical counterpart is seen on the DSS, the galaxy redshift should be .
6 Distribution of sources
6.1 Distribution of the detected sources on the sky
As can be seen from Figs. 3 and 4, many of the confirmed 18 GHz sources lie in or near the Galactic plane.
Using the source density histogram in Fig. 3, we estimated the number of galactic objects that are expected to be found in the extragalactic survey region. The galactic plane shape in the source density histogram was fitted with a single Gaussian profile. The best fit parameters resulted to be =2.3 deg-2, =0 and =0∘.8, where is the source density peak, is the galactic latitude value at the source density peak and is the Gaussian profile width.
In the discussion which follows we assume that the 123 sources which have , and which lie more than 5.5 degrees from the LMC centre (, , J2000; , ) are extragalactic. When split in this way, the final sample of confirmed sources in Table 3 contains 84 Galactic, 14 LMC and 123 extragalactic sources.


6.2 Survey sensitivity
Because this pilot survey did not achieve uniform coverage we made a quantitative assessment of the survey sky coverage through a survey sensitivity map, i.e. a sky map representing the limiting flux density value at every point of the sky covered by the survey. To create this map, the survey sky strip () was gridded into 30 arcsec30 arcsec pixels, and the survey sample pointings were projected onto this 180024000-pixel grid. To account for the antenna primary-beam pattern, this image was convolved with a 77-pixel discretized Gaussian function (). The convolved pointing number per pixel was then multiplied by the time taken by a single beam to sweep across a pixel (sec) to get the pixel observing time. The antenna system temperature (K), the antenna gain at 12mm (), the observing time per pixel and the correlator band-width (GHz) were used to compute the pixel rms sensitivity . A quantitative representation of the sensitivity map is offered by the effective area as a function of the limiting flux density (Fig. 5), which is simply given by the cumulative number of pixels for which multiplied by the single pixel area.

6.3 Differential counts of extragalactic sources
Here, we determine source counts for the extragalactic population at 18 GHz. We exclude Galactic sources, since many have large angular size and their integrated flux densities are underestimated in the follow–up snapshot images.
The counts were logarithmically binned in flux density starting from Slim=100 mJy with a common binsize of 0.2 dex. A limiting flux density of 100 mJy was chosen because only a handful of objects were detected below this flux density.
As the effective surveyed area drops with decreasing limiting flux density below Jy, the surface density of sources in the (small) flux density interval , , is given by:
| (2) |
where is the number of counted sources brighter than . This procedure is equivalent to the more commonly used method of calculating the effective area over which each source could have been observed and summing the inverse area in the flux density bin of interest (Katgert et al. 1973).
The computed source counts need to be corrected for incompleteness. The fraction of sources with true flux , that should be in our sample but are missed because their observed flux is given by:
| (3) |
The values of as a function of are shown in Table 5 together with their negative and positive errors.
| (Jy) | (%) | (Jy-1 sr-1) | neg. err. | pos. err. |
|---|---|---|---|---|
| 0.126 | 31.4 | 9298 | 5735 | 33452 |
| 0.200 | 14.3 | 1175 | 286 | 580 |
| 0.316 | 4.4 | 412 | 97 | 125 |
| 0.501 | 2.0 | 174 | 48 | 63 |
| 0.794 | 3.3 | 57 | 21 | 31 |
| 1.259 | 0.0 | 20 | 9.6 | 16 |
| 1.995 | 0.0 | 9.5 | 5.2 | 9.2 |
| 3.162 | 0.0 | 2.0 | 1.6 | 4.6 |
We have used the lowest possible angular resolution in the survey to minimize the selection against extended sources, but any sources extended more than a few minutes of arc could be missed at the survey limit. This will have a very small effect on the estimate of the total source counts.
The uncertainties on differential counts were estimated by summing in quadrature the Poisson errors (Gehrels 1986) and the uncertainties in the effective area. The results are plotted in Fig. 6, where we also show the least square linear fit given by:
| (4) |
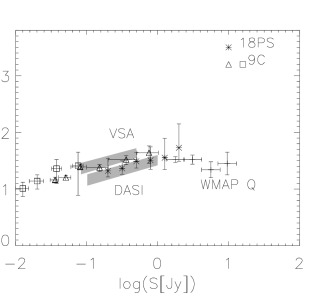
Our counts are in good agreement with those by Waldram et al. (2003) (9C survey) at 15 GHz (Fig. 7), as well as with the preliminary VSA (Grainge et al. 2003), DASI (Leitch et al. 2002), and WMAP counts (Bennett et al. 2003) if we assume a radio spectral index .

7 Comparison with data at lower radio frequencies
7.1 Position comparison
Twenty of the objects detected in the 18 GHz pilot survey are strong compact radio sources which have previously been observed by Ma et al. (1998) with Mark III VLBI at 2.3 and 8.4 GHz as part of a program to tie down the International Celestial Reference Frame. The mean offset is 0.5 arcsec in RA and 0.2 arcsec in Dec, with standard deviations of 3.0 and 1.4 arcsec respectively. These standard deviations are larger than the formal uncertainties (2.0 arcsec in RA and 1.1 arcsec in Dec) measured in the Miriad source–fitting, and reflect the true external errors in our position measurements.
We also cross-matched our extragalactic sub-sample with the 0.843 GHz SUMSS (Mauch et al. 2003) and 4.85 GHz PMN (Gregory et al. 1994) catalogues. All the 123 18 GHz extragalactic sources have a PMN counterpart, and all 102 sources lying in the region of overlap with SUMSS have a SUMSS counterpart.
7.2 Spectral index distribution
Fig. 8 shows that the low-frequency (S0.843) and high-frequency (S18) flux densities are uncorrelated. It is important to stress this point because in many CMB experiments the extra-galactic radio source foreground is computed starting from low-frequency source catalogues and assuming a distribution of spectral indices around a mean value to model the source population at high frequency (30 GHz), but in doing this, a correlation between low- and high-frequency flux density is implicitly assumed.

Fig. 9 shows the spectral index distribution ( where ) for the extragalactic population. Most spectral indices are in the range . Over 70 % of the extragalactic sources have a flat radio spectrum () and 29% have an inverted spectral index ().

The spectral index distribution we obtained is in good agreement with the Michigan 8 GHz survey (70% flat or inverted sources) and Taylor et al. (2001)’s distributions (2/3 of the sources flat or inverted). However, the 9C (Waldram et al. 2003) spectral index distribution between 1.4 GHz NVSS and 15 GHz flux densities, which goes about 4 times fainter, contains almost equal numbers of flat and steep spectrum sources (55% flat or inverted), suggesting that the ratio of flat to steep spectrum sources decreases at lower flux density. The same behaviour is found for the spectral index statistics of a lower frequency survey such as the 5 GHz selected 1 Jy sample (54% of flat or inverted spectrum sources, Stickel et al. 1994). Theoretical predictions based on low frequency selected radio luminosity functions (e.g. Dunlop & Peacock 1990) and simple spectral scaling laws (flat spectrum and steep spectrum ) tend to overestimate the source density at high frequency and fail to reproduce the observed proportionality between flat and steep spectrum populations. High-frequency turn-over in radio source spectra due to synchrotron electron ageing needs to be modelled as we are at reasonably high observing frequency and some sources lie at high redshift.
To better characterise the spectral behaviour of the extra-galactic population we also present an vs. scatter plot in Fig. 10 for the 101 extragalactic objects having a flux density measurement at 0.8, 5 and 18 GHz.
We found that 15 sources classified as inverted at low frequency () are also inverted at high frequency (). No sources out of the 6 classified as High Frequency Peaker candidates having show a rising spectrum between 5 and 18 GHz. 14 sources being flat between 0.8 and 5 GHz () become inverted at higher frequency. Most of the steep spectrum () sources (except 2 objects) stay steep even in the high frequency range.
In the histogram in Fig. 9 there are 9 sources in the 0.4–0.6 bin but only 2 are present in the same spectral range in the histogram. The radio spectra of these objects are turning up at higher frequency. It is worth noticing that the PMN flux densities could be overestimated as the PMN survey beam was so large (3 arcmin) that it is possible that more than one source is included inside the beam area. This would flatten the 0.843–5 GHz spectral indices and steepen the 5–18 GHz ones.

Within the boundaries in Fig. 4 there are 12 WMAP sources. We found that six of them fall in small survey “holes” where the survey sensitivity was too poor or array antennas were unable to sample sky positions and amplitudes. The effect of these regions with poor or null sensitivity on the survey effective area and completeness is quantitatively taken in account in Fig. 5. For the six sources having a S/N 4 in the survey we were able to produce wide range (0.8–61 GHz) radio spectra which in four cases turned out to be steeply rising spectra. One source (PMNJ1803–6507) could be a HFP candidate possibly peaking at about 40 GHz (Fig. 11). Note that WMAP and 18 GHz pilot survey flux densities were measured within a few months of each other (i.e. they are near-simultaneous), the PMN (5 GHz) and SUMSS (0.843 GHz) measurements date from 10 and 4 years earlier respectively.

8 Optical identifications of extragalactic sources
8.1 Optical identifications from SuperCosmos
We used the SuperCOSMOS online database (Hambly et al. 2001) to search for optical counterparts to the 18 GHz sources detected in the pilot study. Our radio position errors are typically 3.0 arcsec in RA and 1.4 arcsec in Dec (§7.1). The optical positions listed in the SuperCOSMOS catalogue also have an associated uncertainty of up to 1 arcsec, so we chose a cutoff radius of 8 arcsec around the radio position to search for an optical counterpart. Table 4 lists the results of this search for the 123 extragalactic sources in our sample. Of these, 74 (60%) are identified with stellar objects (candidate QSOs), 30 (25%) with galaxies and 19 (15%) are blank fields, i.e. they have no optical counterpart in SuperCOSMOS. Some notes on individual sources are given in Appendix A.
The table columns are as follows:
(1) 18 GHz source name, as in Table 2.
(2,3) 18 GHz radio position (J2000.0) measured from the follow-up images
as described in §5.1.
(4,5) The position (J2000.0) of the closest optical
counterpart identified in the SuperCOSMOS catalogue. Where these columns
are blank, there is no catalogued optical object within 8 arcsec of the
18 GHz radio position.
(6) Blue (BJ) apparent magnitude of the optical ID.
(7) SuperCOSMOS T parameter, where T=1 corresponds to a
spatially–resolved galaxy and T=2 to a stellar object.
(8) Offset (in arcsec) between the radio and optical positions.
(9,10) Total (integrated) 18 GHz flux density and estimated error.
Note that these are
generally higher than the peak flux densities listed in Table 2.
(11,12) 5 GHz flux density (in mJy) from the PMN catalogue (Gregory 1994),
and estimated error.
(13,14) 843 MHz flux density (in mJy) from the SUMSS catalogue
(Mauch et al. 2003), and estimated error. Where no flux density is listed,
the source lies in an area of sky where SUMSS observations had not been
completed by mid–2003, and which was therefore not included in the
Jul–1–2003 version of the SUMSS catalogue.
(15,16) Radio spectral index between 843 MHz and 18 GHz, and estimated
error.
(17) Source name in the NASA Extragalactic Database (NED).
(18) Notes on NED sources.
Sixteen of the objects in Table 4 have published redshifts, and these range from =0.014 to 0.183 for the galaxies and =0.54 to 3.15 for the QSOs.
Fig. 12 shows the relation between 18 GHz flux density and spectral index for sources identified with QSOs, galaxies and blank fields. There appears to be a clear similarity between QSO and galaxy spectral index distributions, while in low-frequency surveys these populations have a very different behaviour. We suggest that our sample is dominated by AGN in galaxy nuclei rather than radio galaxy lobes. This then points to a close similarity between radio loud QSO and galaxy nuclei populations.
8.2 Reliability of the optical IDs
We used a series of Monte Carlo tests to estimate the number of spurious SuperCOSMOS radio–source IDs which arise from the chance superposition of a radio source and a foreground star or galaxy. To do this, we offset the position of each radio source by an amount (typically 10–30 arcmin) which is significantly larger than our 8 arcsec matching radius, but small enough that the surface density of SuperCOSMOS stars and galaxies should be similar. We then cross–matched the offset radio positions with the SuperCOSMOS catalogue in the same way as was done for the genuine radio positions. This was done four times, with offsets to the north, south, east and west of the original positions, to measure the average number of spurious matches.
We found that for a cutoff radius of 8 arcsec and an optical magnitude B mag, roughly 17% of the optical IDs in Table 4 are likely to be spurious, giving an overall reliability of 83%. This could be improved by measuring more accurate radio positions for the 18 GHz sources, so that the cutoff radius for matching could be reduced. The small number of very faint optical IDs (B mag) in Table 4 is close to the number expected by chance, suggesting that almost all of these very faint objects are chance associations rather than genuine IDs.
8.3 Optical identification rate
Restricting the sample to a limiting magnitude of B where the SuperCOSMOS catalogue is complete and the reliability of the radio–optical matching high, we find an overall optical ID rate of 808% (98/122 extragalactic sources). When corrected statistically for chance coincidences with foreground objects, this drops to 73% with an optical ID brighter than B, where 51% are stellar objects (candidate QSOs), 22% galaxies and 27% faint objects or blank fields. This rate is comparable with the 83% ID rate reported by Snellen et al. (2002) for a sample of flat–spectrum radio sources selected at 6 cm and with flux densities above 200 mJy. It is however much higher than that found for weak low-frequency samples (Windhorst, Kron & Koo 1984; McMahon et al. 2002).

9 Conclusions
The wide-band interferometer (total bandwidth spanning from 16 to 20 GHz) produced by linking a wide–band correlator to two ATCA antennas equipped with low–noise receivers allowed us to survey the sky at a rate of more than 12 deg2 per hour to a detection limit of mJy despite the small primary beam area ( arcmin). A total of 221 sources have been confirmed by follow-up observations and had flux densities and positions measured.
The distribution with Galactic latitude shows a sharp peak with FWHM in of 1.9∘ due to Galactic sources.
We exclude the galactic plane and use only the 123 sources with . Although this pilot survey is not extremely uniform we know the sensitivity map and can estimate the 18 GHz counts of extragalactic sources down to mJy. The results are in good agreement with the 15 GHz counts by Taylor et al. (2001), with the preliminary VSA (Grainge et al. 2003) and DASI (Leitch et al. 2002) counts, with the WMAP counts at 41 GHz (Bennett et al. 2003) and with the 9C survey at 15 GHz by Waldram et al. (2003). We determine the source counts particularly well in the crucial 200 - 800mJy flux range, bridging the gap between the 9C and the WMAP surveys. With our estimate of the slope as S-2.2 we can confirm that the Planck mission will only need to measure and correct for foreground sources down to the 100mJy level in order to push the fluctuations due to extragalactic radio sources below the instrumental noise (cf. Fig. 6 of De Zotti et al. 1999a). At this flux level a blind survey of the entire sky at 20GHz is feasible.
Although this survey has not revealed any new class of radio sources, we drew attention to the huge scatter in the flux - flux scatter plot (Fig. 8) which suggests that care is needed when using low-frequency surveys to correct high frequency CMB observations.
The radio spectral index distribution of the extra-galactic sources shows that over 70% of them are “flat”-spectrum (, ), including 30 (29%) sources with rising spectrum (). We have a significant population of sources with minima in their spectrum in the 1-10 GHz range.
The optical identification rate of 73% is very high: 51% of the extra-galactic sample are identified with stellar objects (candidate QSOs) and 22% with radio galaxies. This is almost a factor of 3 higher than the identification rate in surveys at comparable flux levels at 1.4GHz. This indicates that the high-frequency source population has a luminosity function which does not extend to such high power as in lower frequency samples. We thus expect that high-frequency surveys will be more sensitive to clustering effects.
A statistical estimate of fractional polarization distribution yielded a median value of 2.1% which is low compared with the steeper spectrum population. It agrees with the median polarization measured for the flat-spectrum population in the Kühr sample (Ricci et al. 2004) again indicating that this high-frequency survey has not revealed any new population of sources at this flux level. With the median polarization below that expected for CMB E-mode, Planck will have no difficulty correcting for this foreground population. However B-mode CMB polarization is much harder to detect and correction for polarised sources will be necessary. Future targeted follow–up with much higher polarization sensitivity is possible.
In the near future we plan to cover 104 deg2 in the southern sky by using an improved and more powerful version of the wide band correlator (3 baselines and 8 GHz bandwidth) being able to reach a 100% completeness for all sources with S mJy and we expect to detect extragalactic sources down to that limiting flux density.
This survey has confirmed a lower than expected density of sources at high frequency making the mm array calibration problem more difficult, however the full 18GHz ATCA survey will still be able to provide a superb calibration source network for ALMA with a density of about one source per square degree down to 40mJy.
10 Acknowledgments
We are grateful to the referee for his very careful reading of the manuscript and his many useful suggestions. This research was supported in part by the Italian Space Agency (ASI) and by the Italian MIUR through a COFIN grant. RR gratefully acknowledges a financial contribution from the Italian National Research Council (CNR) in the framework of an exchange program with CSIRO; he also warmly thanks the Paul Wild Observatory staff for their kind hospitality at Narrabri (NSW, Australia) where part of this work was carried out. The Australia Telescope is funded by the Commonwealth of Australia for operation as a National Facility managed by CSIRO. This research has made use of the NASA IPAC Extragalactic Database (NED) which is operated by the Jet Propulsion Laboratory, California Institute of Technology, under contract with the National Aeronautics and Space Administration.
References
- [1] Auriemma, C., Perola, G.C., Ekers, R.D., Fanti, R., Lari, C., Jaffe, W.J., Ulrich, M.H., 1977, A&A, 57, 41
- [2] Bennett, C.L. et al., 2003, ApJ, 583, 1
- [3] Brinkmann, W., Siebert, J., & Boller, Th., 1994, A&A, 281, 355
- [4] Brandie, G.W., Bridle, A.H., 1974, AJ, 79, 903
- [5] Brandie, G.W., Bridle, A.H., Kesteven, M.J.L., 1974, Nature, 252, 212
- [6] De Zotti, G., Toffolatti, L., Argüeso Gómez, F., Davies, R.D., Mazzotta, P., Partridge, R.B., Smoot, G.F., Vittorio, N., 1999a, in proc. “3K Cosmology”, L. Maiani, F. Melchiorri, & N. Vittorio eds., AIP Conf. Proc., 476, 204
- [7] De Zotti, G., Gruppioni, C., Ciliegi, P., Burigana, C., Danese, L., 1999b, NA, 4, 481
- [8] De Zotti, G., Granato, G.L., Silva, L., Maino, D., Danese, L., 2000, A&A, 354, 467
- [9] Dunlop, J.S., Peacock, J.A., 1990, MNRAS, 247, 19
- [10] Gehrels, N., 1986, ApJ, 303, 336
- [11] Grainge, K. et al., 2003, MNRAS, 341, L23
- [12] Gregory, P.C., Vavasour, J.D., Scott, W.K., Condon, J.J., 1994, ApJS, 90, 173
- [13] Hambly, N.C. et al., 2001, MNRAS, 326, 1279
- [14] Hu, W., Hedman, M.M., Zaldarriaga, M., Phs Rev D, 67, 043004
- [15] Jackson, C.A., et al., 2002, A&A, 386, 97
- [16] Jarrett, T.H., Chester, T., Cutri, R., et al., 2002, AJ, 119, 2498
- [17] Jauncey, D.L., et al., 1989, AJ, 98, 54
- [18] Jones, P.A., McAdam, W.B., 1992, ApJS, 80, 137
- [19] Katgert, P., Katgert-Merkelijn, J.K., Le Poole, R.S., van der Laan, H., 1973, A&A, 23, 171
- [20] Koekemoer, A.M., & Bicknell, G.V., 1998, ApJ, 497, 662
- [21] Leitch, E.M., Pryke, C., Halverson, Kovac, J., Davidson, G. et al., 2002, ApJ, 568, 28 420, 763
- [22] Lo, K.Y., Chiueh, T.H., Martin, R.N., et al., 2001, in 20th Texas Symposium on relativistic astrophysics, eds., J. Craig Wheeler and Hugo Martel, AIP Conf. Proc., 586, 172
- [23] Ma, C. et al. 1998, AJ, 116, 516
- [24] Mason, B.S. et al., 2003, ApJ, 591, 540
- [25] Mauch, T., Murphy, T., Buttery, H.J., et al., 2003, MNRAS, 342, 1117
- [26] McMahon, R.G., White, R.L., Helfand, D.J., & Becker, R.J., 2002, ApJS, 143, 1
- [27] Mesa, D., Baccigalupi, C., De Zotti, G., Gregorini, L., Mack, K.-H., Vigotti, M., Klein, U., 2002, A&A, 396, 463
- [28] O’Dea, C.P., Baum, S.A., Stanghellini, C., 1991, ApJ, 380, 66
- [29] O’Dea, C.P., 1998, PASP, 110, 493
- [30] Ricci, R., Prandoni, I., Gruppioni, C., Sault, R.J., & De Zotti, G., 2004, A&A, 415, 549
- [31] Roy, A.L., & Norris, R.P., 1997, MNRAS, 289, 824
- [32] Rudy, D.J., Icarus, 71, 159
- [33] Sault, R.J., Teuben, P.J., & Wright, M.C.H., 1995, “A retrospective view of Miriad” in Astronomical Data Analysis Software ans Systems, eds. R. Shaw, H.E. Payne, & J.J.E. Haynes, ASP Conf. Series, 77, 433
- [34] Snellen, I.A.G., McMahon, R.G., Hook, I.M., & Browne, I.W.A., 2002, MNRAS, 329, 700
- [35] Stickel, M, Meisenheimer, K., & Kühr, H., 1994, A&A Supp. Ser., 105, 211
- [36] Tauber, J.A., 2001, in “The Extragalactic Infrared Background and its Cosmological Implications”, proc. IAU Symp. 204, M. Harwit ed., p. 493
- [37] Taylor, A.C., Grainge, K., Jones, M.E., Pooley, G.G., Saunders, R., Waldram, E.M., 2001, MNRAS, 327, 1
- [38] Thompson, A.R., 1999, in Synthesis Imaging in Radio Astronomy II, eds. G.B. Taylor, C.L. Carilli & R.A. Perley, ASP Conf. Ser., 180, 11
- [39] Tingay, S.J., et al., 1997, AJ, 113, 2025
- [40] Toffolatti, L., Argueso Gomez, F., De Zotti, G., Mazzei, P., Franceschini, A., Danese, L., Burigana, C., 1998, MNRAS, 297, 117
- [41] Ulich, 1981, AJ, 86, 1619
- [42] Voges, W., Aschenbach, B., Boller, H., et al., 1999, A&A 349, 389
- [43] Waldram, E. et al., 2003, MNRAS, 342, 915
- [44] Watson, R.A. et al., 2003, MNRAS, 341, 1057
- [45] White, G.L., et al., 1987, MNRAS, 227, 705
- [46] Windhorst, R.A., Kron, R.G., & Koo, D.C., 1984, A&AS, 58, 39
Appendix A Notes on individual sources
PKS 0021686: We adopt the SuperCOSMOS classification as a stellar object, but note that the 2MASS Extended Objects catalogue (Jarrett et al. 2002) classified this as a galaxy with Ks(total)=13.65 mag. Detected as an X-ray source in the RASS Bright Source Catalogue (Voges et al. 1999).
PKS 002260: Compact double source shown in Fig. A1. The catalogued MRC flux density of 3.83 (0.17) Jy at 408 MHz implies a radio spectral index .
PKS 0101649: The 843 MHz flux density is from Jones & McAdam (1992). Listed in the 2MASS Extended Objects catalogue as a galaxy with Ks(total)=13.41 mag.
PKS 0235618: Detected as an X-ray source in the RASS Bright Source Catalogue. Jones & McAdam (1992) note that the original Parkes detection is resolved into a pair of unrelated sources at 843 MHz. The source detected at 18 GHz is associated with the western (brighter) member of the pair.
PMNJ 04226507: The optical ID is offset 7.9 arcsec in RA from the 18 GHz radio position, but is within 0.5 arcsec of the SUMSS position. We accept this as the correct ID because of the close agreement with the SUMSS position, and because the 18 GHz source is close to the edge of the observed field.
PKS 0516621: The optical ID is within 0.1 arcsec of the VLBI position measured by Ma et al. (1998).
PKS 0522611: Noted as a ROSAT X-ray source by Brinkmann, Siebert & Boller (1994).
PKS 1105680: The optical ID found in SuperCOSMOS was first identified by Jauncey et al. (1989), and is within 0.1 arcsec of the Ma et al. (1998) VLBI position. The foreground Galactic extinction in this field () is A mag.
PKS 1133681: There is no optical object within 5 arcsec of the 18 GHz radio position in the SuperCOSMOS catalogue. White et al. (1987) identify this source with a faint (B=22.2 mag.) galaxy which is just visible on the SuperCOSMOS B image. The foreground Galactic extinction in this field () is A mag.
PKS 1420679: The SuperCOSMOS image shows no optical object within 5 arcsec of the radio position. White et al. (1987) identify this source with a faint (B=22.2 mag.) stellar object, but this should be regarded as uncertain without spectroscopic confirmation because of the high surface density of foreground stars at this low Galactic latitude. The Galactic extinction in this field () is A mag.
PKS 1448648: The SuperCOSMOS image shows no optical object within 5 arcsec of the radio position. White et al. (1987) identify this source with a faint (B=22.0 mag.) galaxy which is 7.5 arcsec from the 18 GHz position, but this object is classified as stellar by SuperCOSMOS and may be a foreground star. The extinction in this low-latitude region () is A mag.
WKK 5585: Detected as an X-ray source in the RASS Bright Source Catalogue (Voges et al. 1999).
NGC 6328: This nearby (=0.014) galaxy is the optical counterpart of the radio galaxy PKS 1718649, which is the closest-known GPS radio source (Tingay et al. 1997).
PKS 1801702: A bright elliptical galaxy without a catalogued redshift, Ks(total)=13.65 mag in the 2MASS Extended Objects catalogue.
PKS 181463: A nearby (=0.0627) active galaxy, with Ks(total)=13.65 mag in the 2MASS Extended Objects catalogue.
PKS 181967: Highly-polarized double source with no optical ID, discussed in §5.3.
PKS 192262: This source is 4.5 arcmin from the strong radio source PKS 192262. Large pointing errors in PMN (Parkes telescope beam width is about 5 arcmin) are likely to be the cause of the offset.
PKS 1934638: This strong and well–studied radio galaxy was the prototype GPS source (O’Dea et al. 1991).
PMNJ 20086110: Compact source with a highly–inverted radio spectrum and no optical ID.
MRC 2041617: Detected as an X-ray source in the RASS Bright Source Catalogue (Voges et al. 1999) and shown in Fig. A1.
ESO 075G41: The two components detected here (Fig. A1) are the core and southern hotspot of this nearby (=0.028) radio galaxy.
PKS 2210637: Detected as an X-ray source in the RASS Bright Source Catalogue (Voges et al. 1999).
PKS 2300683: Noted as a ROSAT X-ray source by Brinkmann, Siebert & Boller (1994).
PKS 2303656: There is no optical counterpart in the SuperCOSMOS catalogue, but Jackson et al. (2002) report that a faint red galaxy is visible on CCD images of this field, with a tentative redshift of =0.470 from an optical spectrum.
IRAS 230745957: Noted by Roy & Norris (1997) as a member of the rare class of ‘radio–excess infrared galaxies’. Listed in the 2MASS Extended Objects catalogue with Ks(total)=14.00 mag.
PKS 235661: Well known FRII radio galaxy (Koekemoer & Bicknell 1998)– both hotspots are detected at 18 GHz. The host galaxy has Ks(total)=12.86 mag in the 2MASS Extended Objects catalogue.
(a) PKS 002260 (b) PMNJ 20086110
(c) MRC 2041617 (d) ESO 07541
(e) PKS 235661 (f) PKS 235661 with SUMSS 843 MHz contours overlaid
(a) PKS 0021686 (b) PKS 0101649
(c) PKS 0235618 (d) PMNJ 04226507
(e) PKS 0516621 (f) PKS 0522611
(a) PKS 1105680 (b) PKS 1133681
(c) PKS 1420679 (d) PKS 1448648
(e) WKK 5585 (f) NGC 6328
(a) PKS 1801702 (b) PKS 181463
(c) PKS 181967 (d) SUMSSJ 192659624225
(e) PKS 193463 (f) PKS 2210637
(a) PKS 2300683 (b) PKS 2303656
(c) IRAS 230745957