1]Max-Planck-Institut für extraterrestrische Physik, PO Box 1312, 85741 Garching, Germany 2]CEA/Saclay, DAPNIA/Service d’Astrophysique, F-91191 Gif sur Yvette, France 3]Centre d’Etudes Spatiales des Rayonnements, 9, avenue du Colonel Roche, 31028 Toulouse, France
Search for 44Ti gamma-ray line emission from GRO J0852-4642 with INTEGRAL/SPI
Abstract
The gamma-ray source GRO J0852-4642, discovered by COMPTEL, is a possible counterpart of the supernova remnant RX J0852-4622. Detection of radioactive decay from 44Ti nuclei would proof it to be the youngest and nearest supernova remnant known so far. During the first year of INTEGRAL core program, the Vela region was observed twice in all for more than 2000 ks. Among other nucleosynthesis studies, one of the most important scientific goals of this observation is the detection of 44Ti gamma-ray lines expected at 68 keV, 78 keV and 1157 keV. For this purpose the INTEGRAL Spectrometer (SPI), with its very high energy resolution thanks to its germanium detector camera is the key instrument, permitting a precise determination of gamma-ray line intensities and profiles. The upper limit for the 78.4 keV 44Ti gamma-ray line emission derived from the first analysis is . This value is mainly dominated by systematic uncertainties in the treatment of the instrumental background. By accumulating more observation time in the next years of the mission and by improving the background understanding, a reliable 44Ti flux for GRO J0852-4642 or an upper limit which constrains the COMPTEL flux can be expected.
keywords:
gamma rays: observations, nucleosynthesis, Space telescope: SPI/INTEGRAL1 Introduction
One of the main scientific topics of the INTEGRAL mission is the investigation of stellar nucleosynthesis (Hydrostatic burning, supernovae, novae) (Winkler et al., 2003). In this context the spectrometer SPI is important, due to its capability to resolve nuclear lines with its high energy resolution (Vedrenne et al., 2003; Schanne et al., 2003; Attié et al., 2003). The measurement of -ray line intensities, line profiles and line shifts is one of SPI’s main goals (Schönfelder et al., 2000).
Only few isotopes exist which are accessible to -ray astronomy for probing cosmic nucleosynthesis (Diehl & Timmes, 1998). Especially 44Ti is an important probe for the investigation of supernovae (SNe) and their young remnants (SNR). 44Ti decays via 44Sc to 44Ca:
This decay chain is driven by the decay-time of 44Ti. The 67.9 keV and 78.4 keV transitions form a cascade and have the same probability (99%) as the 1157 keV transition, thus a similar flux of all three lines is expected. The mean life-time of 44Ti was for a long time very uncertain, but has been settled a few years ago to a current ”best value” of yr (1 error) [half-life time: 59.6 0.5 yr], from more accurate laboratory measurements (Norman et al., 1998; Ahmad et al., 1998; Görres et al., 1998; Wietfeldt et al., 1999). 44Ti decays through electron capture, therefore its decay lifetime depends on the ionization state: in the extreme case of a fully-ionized nucleus the 44Ti isotope is stable. This effect, if present, might introduce some uncertainty in the estimation of the 44Ti-mass ejected by the SN (Mochizuki et al., 1999; Laming, 2001).
The discovery of 1157 keV 44Ti line emission from the historic youngest-known Galactic SNR Cas A by COMPTEL (Iyudin et al., 1994) confirmed that 44Ti is indeed produced in core collapse SNe explosions. 44Ti is expected to be produced in all types of SNe, although with very different yields, depending on the mass-cut between a few 10-5 and 10-4 M⊙ for the most frequent SNe of type II and Ib (Woosley & Weaver, 1995; Thielemann et al., 1996). 44Ti provides an excellent diagnostic of the still not completely understood core-collapse SN-explosion mechanism itself. According to theoretical models, 44Ti is produced through explosive Si burning in an -rich freeze-out and thus originating from the innermost ejected material. 44Ti thus probes deep into the interior of the exploded star (similar to radioactive 56Ni). Its yield is sensitive to the asymmetries of the collapse and explosion, possibly caused by stellar rotation (Nagataki et al., 1998).
The recently-discovered SNR RXJ0852-4622 (Aschenbach, 1998), with 2∘ diameter, an age probably much below that of the Vela SNR, and a large distance uncertainty, from 0.2 to 1 kpc, is the object of our investigation. INTEGRAL observations have the potential to resolve the distance uncertainty from a test for 44Ti emission and from a study of the 1.8 MeV gamma-ray line shape expected to be broadened and produced by the decay of fast moving 26Al nuclei possibly released by this SNR, compared to the line shape (narrow) produced by slow moving 26Al nuclei which form a diffuse background in the Vela region.
The flux of the 44Ti line is given by
| (1) |
with as the distance of the supernova, as the mass yield of 44Ti, as the atomic mass of 44Ti, as the 44Ti mean life-time and as the time elapsed since the supernova explosion. Obviously, for any observed flux there is some ambiguity in the age and distance parameters of the source. This is where other astronomical observations must join in. Ice-core dating of nearby supernovae had been proposed for such purpose already in the 1970s. It was claimed that the measurement of nitrate abundance in Antarctic ice cores shows evidence for a correlation with known recent nearby supernovae (Rood et al., 1979; Burgess & Zuber, 2000), due to photochemical reactions in the atmosphere.
From the observations of X-rays, the age and distance of the newly-discovered SNR RXJ0852-4622 has been a matter of debate. From its size and spectrum, values well below 1 kpc were thought plausible (Aschenbach, 1998), while comparisons of absorption column data with the Vela SNR require distances well beyond the Vela SNR (currently placed at 250 pc; Cha et al. (1999); Slane et al. (2001)). From an identification of RXJ0852-4622 with the 44Ti source, a combination of arguments led to a most plausible parameter set of 200 pc for the distance, and 680 years for the age of the SN (Aschenbach et al., 1999). Other tracers (Iyudin, 2002) also support a SN event around 1320, the occurance time of the COMPTEL GRO J0852-4622 event estimated from 44Ti measurements (Iyudin et al., 1998). If this small distance value applies, an interesting perspective for INTEGRAL is opened from its capability to detect 26Al radioactive isotopes expected to be released by this SNR. Indeed, core-collapse supernovae are believed to be common sources of 26Al (Prantzos & Diehl, 1996), and could be visible with INTEGRAL as individual sources out to distances of a few 100 pc, assuming standard model yields, due to the long 26Al lifetime of 106 y. Indeed, COMPTEL’s 26Al survey shows a peak of emission towards this direction, which could be largely due to this source (Aschenbach et al., 1999). First results of a search for 26Al emission in the Vela region with INTEGRAL/SPI are shown elsewhere (Maurin et al., 2004). A measurement of the 26Al line width in the Vela region, expected to be performed by SPI, will be crucial for the interpretation of the nature of the SNR RX J0852-4622.
The detection of 1157 keV 44Ti emission (Iyudin et al., 1998) has shown that it is possible to discover a supernova remnant, which was undetected in other wavelengths before, by the detection of -ray lines. Although the 44Ti detection is only marginal (Schönfelder et al., 2000), it is for the first time that a -ray line observation triggered the discovery of a new supernova remnant, through X-rays measured with ROSAT. A confirmed 44Ti -ray line emission for GRO J0852-4642 will help also to study the Galactic supernovae rate. 44Ti is an excellent indicator for Galactic supernova explosions which occurred in the past few centuries (age 1000 yr), even in otherwise obscured regions. The Galaxy is, compared to other wavelength bands, practically transparent in the -ray band. Therefore it will be possible to complement historical observations of galactic SNe through supernovae remnants revealed by their 44Ti -ray line emission.
2 Observation of the Vela region
The Vela Region was observed twice during the INTEGRAL AO-I Core Program in 2003.
The first set of data with 1236 ks exposure time was recorded during the satellite orbits 81 to 88 from June 12 until July 6. The 55 dither pattern was centered in the Vela region at and , off the position of the potential SNR GRO J0852-4642. During orbit 82 and 83 a large solar flare occurred with the consequence that the data of these orbits were left out for the analysis.
The second set of data with 986 ks exposure time has been taken during the orbits 137 to 141 from November 27 until December 11. The 55 dither pattern was centered on and , off the position of GRO J0852-4642. In reaction to the Vela X-1 outburst on November 28 (Krivonos et al., 2003; Staubert et al., 2004), a 12.6 ks observation with a hexagonal dither pattern centered on Vela X-1 ( and ) was executed end of orbit 138 on December 2. Unfortunately one of SPI’s germanium detectors (Ge-detector No. 2) failed at the beginning of orbit 140 on December 6. The consequence is that the partly energy deposition in detectors which are involved in the same multiple detector event as the failed one will impose fake background events, especially in detectors which are located in the neighborhood of Ge-detector 2. A new detector response is required to account for the changed conditions. The current analysis, which is presented here, discards the data of orbit 140 and 141 until the new response is available. As it already happened during the first Vela observation, a strong solar flare occurred during the second period too, starting at the end of orbit 138 and lasting until the beginning of orbit 139. Due to the shorter duration of the activity, the recorded data were used for the analysis.
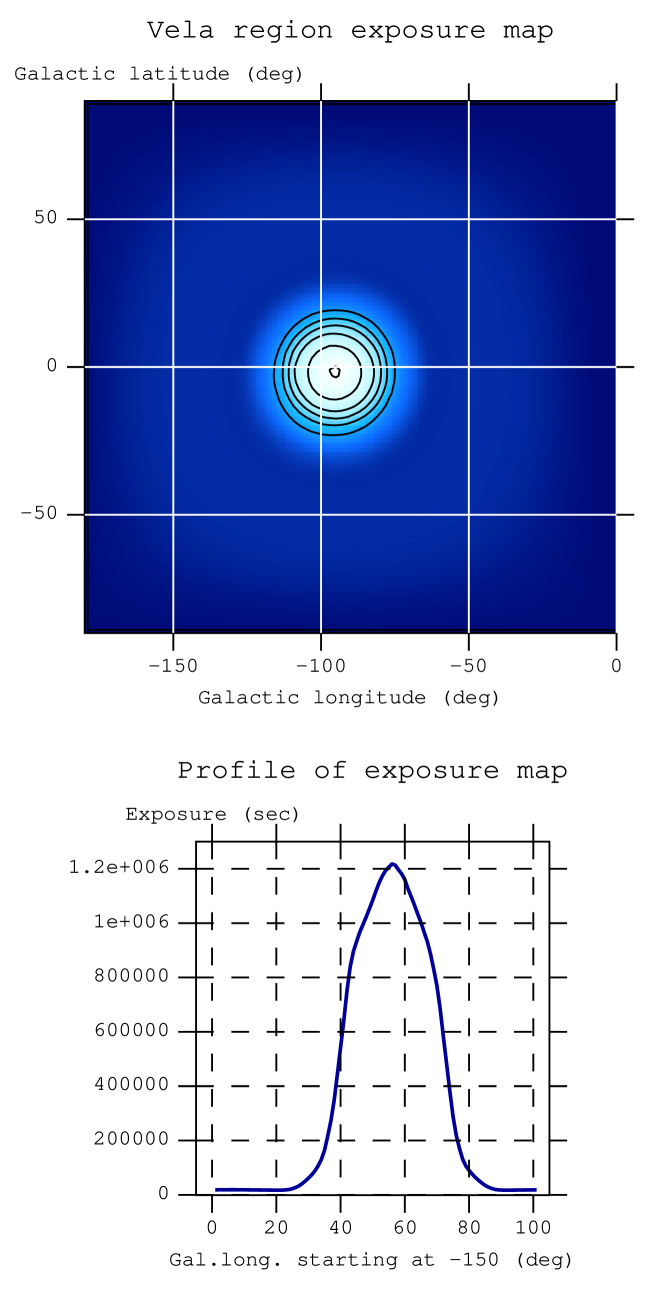
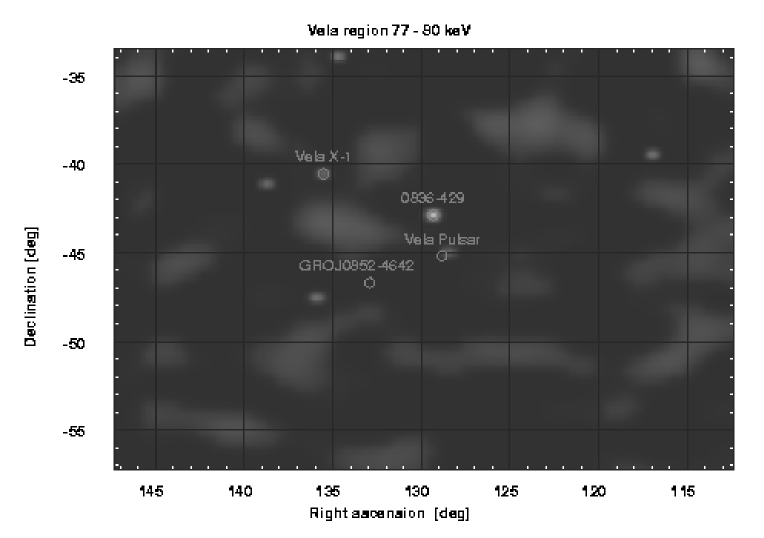
Altogether the Vela Region was observed for 2235 ks. The data of the orbits 82, 83, 140, 141 and the satellite slews were discarded. Thus the on-target time used for the analysis amounts 1540 ks. With the mean deadtime of all detectors and pointings of 11% the effective exposure was 1370 ks. Fig. 1 shows the distribution map of the effective exposure. With the selected data, only 1200 ks effective exposure (about 54% of the observing time) are available for the spectral analysis of GRO J0852-4642.
3 Sensitivity estimations
The expectations to obtain a significant result for the 67.9 keV line is low, because SPI has at 67.9 keV a small sensitivity of caused by the strong background line complex between 50 and 70 keV (see Fig. 3). The narrow line sensitivity at the 1157 keV line is , when adding the single and multiple detector events, it is about the same as the one at 78.4 keV of (sensitivities taken from Roques et al. (2003)). However at high energies SPI’s sensitivity is deteriorated by strong Doppler line broadening which can be expected for this source. In the case of SPI the Doppler broadening of the 1157 keV line could exceed significantly the intrinsic energy resolution of the germanium detector, leading to a reduced sensitivity. For example a Doppler broadening of 35 keV, which corresponds to an expansion velocity of about 4600 km/s, only a significance of can be obtained with an 3000 ks observation.
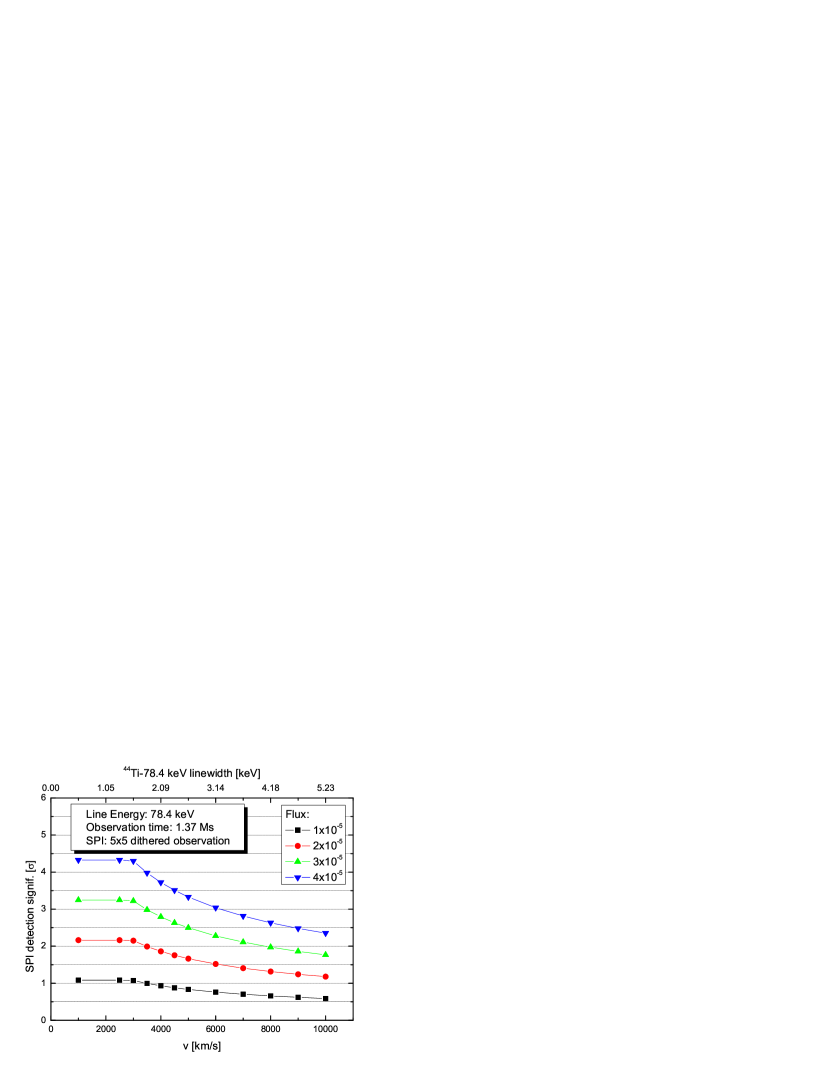
Fig. 2 summarize the expected significances for the detection of the 78.4 keV 44Ti-line with SPI for an 1370 ks observation with a dither pattern (16 days, which corresponds to the effective exposure as determined in Section 2). The significances were derived by using the Observation Time Estimator (OTE) of ISOC for 44Ti-line fluxes in the range . This range corresponds to the 44Ti excess measured with COMPTEL of from GRO J0852-4642 (Schönfelder et al., 2000). The expected significances are plotted for expansion velocities of the SNR between 1,000 and . Higher velocities lead to an even larger broadening of the line so that they fall below the sensitivity limit of SPI. A hexagonal dither pattern would have yielded a higher detection significance for the same observation time, but with the point source on axis, the equations which have to be solved for a SPI image reconstruction are underdetermined. So the SPI data would be of limited use.
In the case of a SN of type Ib/II 44Ti is coming from the innermost ejected material. So it is expected that 44Ti was ejected at lower speed compared to the mean expansion velocity of known SNR of about (Hughes, 2000). For a Doppler-broadened line with FWHM of 2.4 keV, which corresponds to an expansion velocity of about , the 44Ti 78.4 keV line will be detectable at level for the highest flux depicted in Fig. 2. The instrumental energy resolution of the germanium detectors is about 1.8 keV in this energy range, thus it should be possible to determine/constrain the Doppler broadening and the shape of the line.
From IBIS/ISGRI interesting results can be expected (Lebrun et al., 2001), because it provides a high angular resolution of 12 arcmin, which is high enough to spatially resolve GRO J0852-4642, but with the drawback of a degraded sensitivity for sources which are not point like. Furthermore the energy resolution of ISGRI (: 9% at 100 keV) is not sufficient to address a possible line broadening. Already from the AO-1 observation of the Galatic center region with ISGRI upper limits on the 44Ti line flux at 67.9 keV and 78.4 keV are presented by Renaud et al. (2004). From IBIS/PICsIT we do not expect a significant result at 1157 keV, because its line sensitivity at this energy is more than an order of magnitude worse compared to that of SPI.
4 Analysis
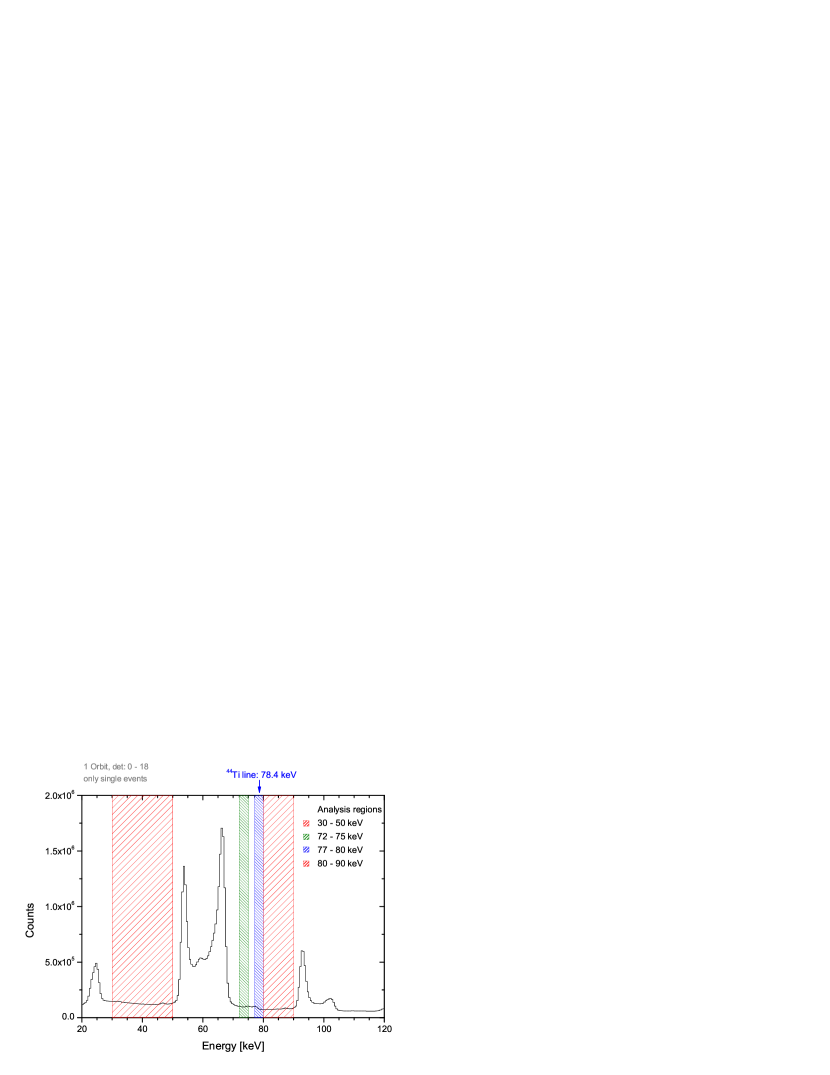
As has been shown in Section 3 the search for an astrophysical 44Ti-line flux is most promising at the 78.4 keV line, especially for broadened lines. The analysis method111The data were prepared with the INTEGRAL off-line scientific analysis package, version OSA 3.0, released by ISDC. uses imaging in a narrow energy band around this line from 77 to 80 keV. For an assessment of systematics and artefacts, the analysis was redone in an adjacent narrow energy band between 72 and 75 keV. In order to find strong continuum sources, which could produce fake line sources in the two narrow energy bands, a search for continuum sources was performed in two broader energy bands, lacking of strong background lines, one below the interesting range from 30 to 50 keV and one above from 70 to 80 keV. In Fig. 3 these four energy ranges are marked on top of a typical spectrum of SPI’s camera.
| Source | Flux [] | |||
|---|---|---|---|---|
| ”continuum” | ”line” | ”44Ti - line” | ”continuum” | |
| E - Range | 30 – 50 keV | 72 – 75 keV | 77 – 80 keV | 80 – 90 keV |
| sources fixed: | ||||
| Vela X-1 | 145.5 0.7 | 0.6 0.2 | 0.4 0.2 | 1.4 0.3 |
| GS0836-429 | 46.04 0.7 | 1.3 0.2 | 1.2 0.2 | 1.5 0.3 |
| GROJ0852-4642 | – | – | 0.0 0.2 | – |
| free search for new sources: | ||||
| (Vela Pulsar) | – | – | 0.4 0.2 | 1.9 0.3 |
| ”Spurious” detections up to | 16 0.7 | 0.6 0.2 | 0.7 0.2 | 1.1 0.3 |
The imaging analysis was performed by using the SPIROS222SPIROS, version 6.0. software (Skinner & Connell, 2003). SPIROS allows the choice between different background models and methods. Commonly the saturated event rate of each germanium detector is used as a background tracer, which is a good measure of the high-energy particle flux impinging on SPI’s camera. This rate can be used as an estimate of the background variation with time and of the scaling factors between the detectors, which both will be fitted within SPIROS (SPIROS method 2). An alternative is the so called ”mean count-rate method” (MCM: SPIROS method 5) which does not need a background model generated by another program like SPIBACK (Diehl et al., 2003). SPIROS is calculating in this case the background internally by assuming that the measured rates of each detector are mainly due to background events. Their variations are accounted for changes of the background level. This method is not advisable in the case when strong or variable sources are in the field of view. The optimization statistics was used and pointings with extreme count residues above 3 for each detector individually were automatically excluded by SPIROS. With this method it is possible to obtain reduced values . The Vela region was analyzed with both background methods. Nevertheless a strong and variable source was in the field of view (Vela X-1), the results obtained with the MCM background method (summarized in Tab. 1) yielded better values.
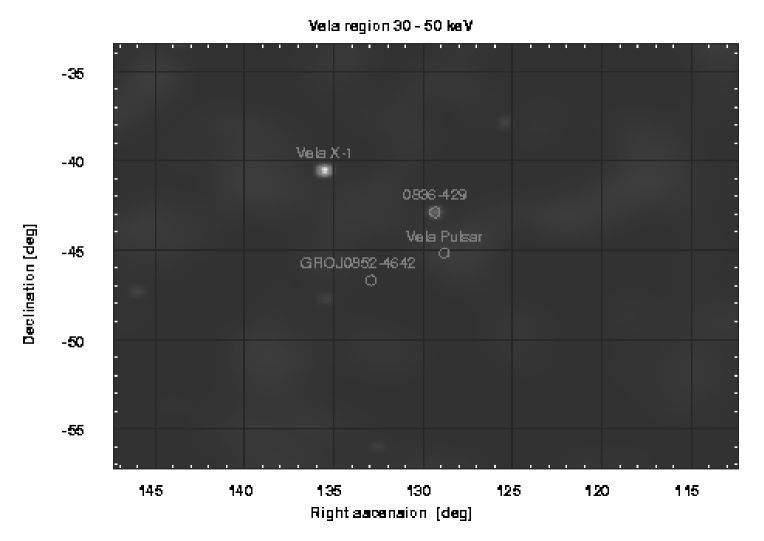
The results of the imaging analysis are summarized in Tab. 1. In all 4 energy bands the position of three sources, Vela X-1, the Burster GS0836-429 (Aoki et al., 1992) and the source of interest GROJ0852-4642 were fixed. With SPIROS a search for 5 new sources above a significance threshold of 3 was performed and the fluxes of the fixed and newly found sources were extracted. Fig. 4 shows two of the obtained SPIROS detection significance maps. In both broad energy bands the two continuum sources Vela X-1 and GS0836-429 were detected. In the 30 to 50 keV band with a high significance and in the 80 to 90 keV band with . In the two line-like energy bands only GS0836-429 was visible with . The Vela Pulsar was found without catalogue input in the 80-90 keV energy band at , 0.33∘ off the catalogue position. No flux was detected from GROJ0852-4642 in any of the 4 energy bands, especially in the energy band where the 44Ti line flux is expected. In this case a statistical upper limit of can be deduced. In all four energy bands always 5 new sources, most of them obviously not real (except Vela pulsar), at random positions were found. The extracted flux levels of the strongest of these ”spurious” sources is listed in the last row of Tab. 1. A detailed discussion on the detection of spurious sources can be found in Dubath et al. (2004)
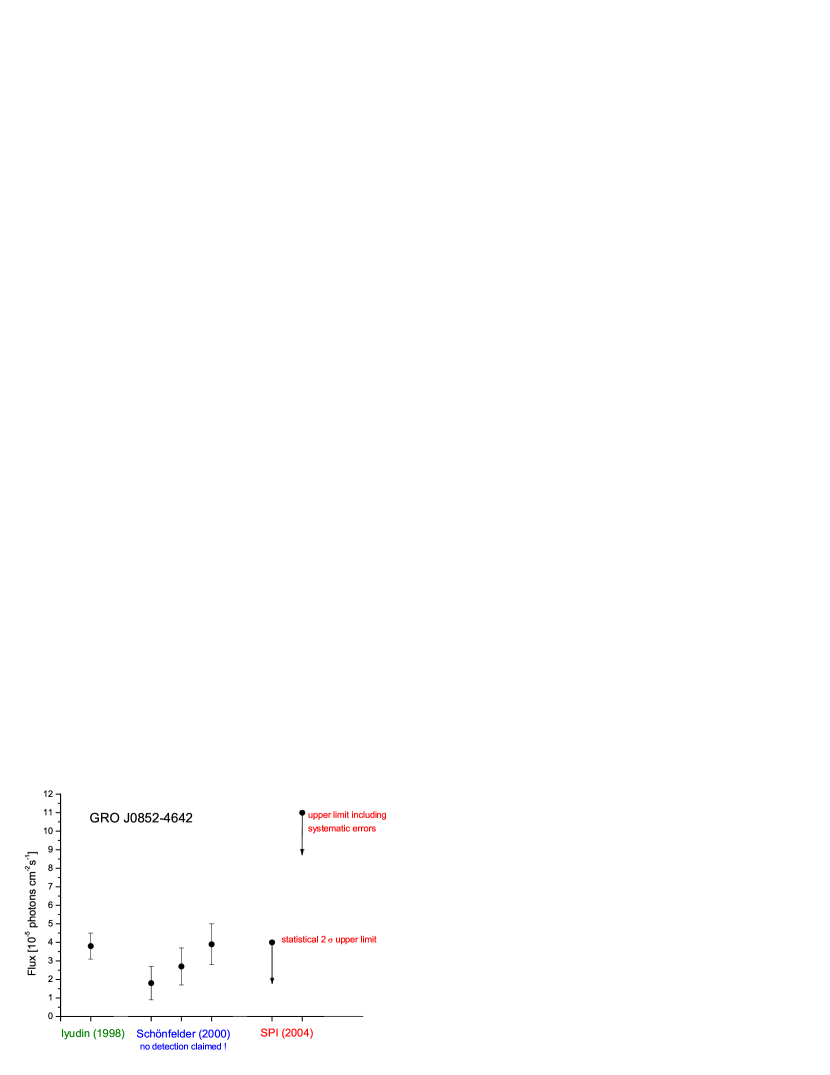
The occurrence of spurious sources can be used as a measure of the systematic uncertainties introduced by a not optimal handling of the background. For the 44Ti line energy band we detected spurious sources up to a flux of . Adding the statistical upper limit, one gets a conservative upper limit for the 44Ti line flux at 78.4 keV for GROJ0852-4642 of .
5 Conclusion
In Fig. 5 the upper limits derived from the current analysis of the SPI Vela observation are compared with flux values quoted for GROJ0852-4642 in the literature (Iyudin et al., 1998; Schönfelder et al., 2000). Without improving the systematic uncertainties the SPI result will not constrain the COMPTEL measurements.
Acknowledgments
The SPI/INTEGRAL project is supported by the German ”Ministerium für Bildung und Forschung” through DLR grant 50.OG.9503.0.
References
- Ahmad et al. (1998) Ahmad I., Bonino G., Castagnoli G.C., et al., 1998, Physical Review Letters, 80, 2550
- Aoki et al. (1992) Aoki T., Dotani T., Ebisawa K., et al., 1992, PASJ, 44, 641
- Aschenbach (1998) Aschenbach B., 1998, Nature, 396, 141
- Aschenbach et al. (1999) Aschenbach B., Iyudin A.F., Schönfelder V., 1999, A&A, 350, 997
- Attié et al. (2003) Attié D., Cordier B., Gros M., et al., 2003, A&A, 411, L71
- Burgess & Zuber (2000) Burgess C.P., Zuber K., 2000, Astroparticle Physics, 14, 1
- Cha et al. (1999) Cha A.N., Sembach K.R., Danks A.C., 1999, ApJ, 515, L25
- Diehl & Timmes (1998) Diehl R., Timmes F.X., 1998, PASP, 110, 637
- Diehl et al. (2003) Diehl R., Baby N., Beckmann V., et al., 2003, A&A, 411, L117
- Dubath et al. (2004) Dubath P., Kreykenbohm I., Knödlseder J., et al., 2004, In: these proceedings
- Görres et al. (1998) Görres J., Meißner J., Schatz H., et al., 1998, Physical Review Letters, 80, 2554
- Hughes (2000) Hughes J.P., 2000, ApJ, 545, L53
- Iyudin (2002) Iyudin A., 2002, Journal of Atmospheric and Solar-Terrestrial Physics, 669–676, elsevier Science
- Iyudin et al. (1994) Iyudin A.F., Diehl R., Bloemen H., et al., 1994, A&A, 284, L1
- Iyudin et al. (1998) Iyudin A.F., Schönfelder V., Bennett K., et al., 1998, Nature, 396, 142
- Krivonos et al. (2003) Krivonos R., Produit N., Kreykenbohm I., et al., 2003, The Astronomer’s Telegram, 211, 1
- Laming (2001) Laming J.M., 2001, ApJ, 563, 828
- Lebrun et al. (2001) Lebrun F., Cordier B., Iyudin A., 2001, In: ESA SP-459: Exploring the Gamma-Ray Universe, 509
- Maurin et al. (2004) Maurin D., Schanne S., Sizun P., et al., 2004, In: these proceedings
- Mochizuki et al. (1999) Mochizuki Y., Takahashi K., Janka H.T., Hillebrandt W., Diehl R., 1999, A&A, 346, 831
- Nagataki et al. (1998) Nagataki S., Hashimoto M., Sato K., Yamada S., Mochizuki Y.S., 1998, ApJ, 492, L45
- Norman et al. (1998) Norman E.B., Browne E., Chan Y.D., et al., 1998, Phys. Rev. C, 57, 2010
- Prantzos & Diehl (1996) Prantzos N., Diehl R., 1996, Phys. Rep., 267, 1
- Renaud et al. (2004) Renaud M., Lebrun F., Terrier R., Ballet J., Decourchelle A., 2004, In: these proceedings
- Rood et al. (1979) Rood R.T., Sarazin C.L., Zeller E.J., Parker B.C., 1979, Nature, 282, 701
- Roques et al. (2003) Roques J.P., Schanne S., von Kienlin A., et al., 2003, A&A, 411, L91
- Schönfelder et al. (2000) Schönfelder V., Bloemen H., Collmar W., et al., 2000, In: American Institute of Physics Conference Series, vol. 510, 54
- Schanne et al. (2003) Schanne S., Cordier B., Gros M., et al., 2003, In: X-Ray and Gamma-Ray Telescopes and Instruments for Astronomy, eds. J. E. Trümper & H. D. Tananbaum, SPIE, 4851, 1132–1143
- Skinner & Connell (2003) Skinner G., Connell P., 2003, A&A, 411, L123
- Slane et al. (2001) Slane P., Hughes J.P., Edgar R.J., et al., 2001, ApJ, 548, 814
- Staubert et al. (2004) Staubert R., Kretschmar P., Pottschmidt K., et al., 2004, In: these proceedings
- Thielemann et al. (1996) Thielemann F., Nomoto K., Hashimoto M., 1996, ApJ, 460, 408
- Vedrenne et al. (2003) Vedrenne G., Roques J.P., Schönfelder V., et al., 2003, A&A, 411, L63
- Wietfeldt et al. (1999) Wietfeldt F.E., Schima F.J., Coursey B.M., Hoppes D.D., 1999, Phys. Rev. C, 59, 528
- Winkler et al. (2003) Winkler C., Courvoisier T.J.L., Di Cocco G., et al., 2003, A&A, 411, L1
- Woosley & Weaver (1995) Woosley S.E., Weaver T.A., 1995, ApJS, 101, 181