Clean optical spectrum of the radio jet of 3C 120
Abstract
We present integral field spectroscopy (IFS) of the central region of 3C 120. We have modeled the nuclear and host galaxy 3D spectra using techniques normally applied to imaging, decoupling both components, and obtained a residual datacube. Using this residual datacube, we detected the extended emission line region associated with the radio jet. We obtained, for the first time, a clean spectrum of this region and found compelling evidences of a jet-cloud interaction. The jet compresses and splits the gas cloud which is ionized by the AGN and/or by the strong local UV photon field generated by a shock process. We cannot confirm the detection of an extended emission line region associated with the counter-jet reported by Axon et al. (1989).
1 Introduction
3C 120 is a Seyfert 1 radio-galaxy at a redshift of 0.033 with a compact flat-spectrum radio core and a powerful X-ray emission (Halpern 1985). It has a one-side superluminal radio jet with two clear knots at 4 west and 25 north-west from the core (Walker et al. 1987, 1988; Walker 1997). Morphologically it is a bulge-dominated galaxy with several continuum and extended emission line regions (EELR, Baldwin et al. 1980; Wlerick et al. 1981; Pérez-Fournon et al. 1986; Hua 1988; Soubeyran et al. 1989), indicating a change of star formation history and a combination of different ionization mechanisms from region to region.
The radio-jet shows a continuum dominated optical counterpart, consistent with synchrotron radiation, that extends from 7 to 25 out of the nucleus, but without a clear counterpart at the location of the 4 knot (Hjorth et al. 1995). X-ray emission has been detected associated with the 25 knot (Harris et al. 1999). An EELR has been detected at 1 distance from the 4 knot, the so called E1 region (Soubeyran et al. 1989). This EELR has been detected using different spectroscopic and imaging techniques (e.g. Baldwin et al. 1980; Wlerick et al. 1981; Hua 1988; Soubeyran et al. 1989; Axon et al. 1989). Axon et al. (1989) showed that it comprises two kinematic components, separated by 150 km s-1, with a South-North gradient. This EELR does not originate in material that has been ejected with the radio-emitting plasma. It arises because of the interaction, most probably lateral expansion, of the radio jet with the interstellar medium (ISM) of the galaxy (Axon et al. 1989). Very little is known about the ionization conditions or the amount of dust in this area. Hua (1988) estimated roughly an [OIII]5007/H ratio of 17 for this cloud, based on the data from Baldwin et al. (1980), which contrasts with the value found for the nucleus (1). These values were derived without a proper deblending of the broad and narrow emission lines, and without decontaminating the spectrum of the E1 region from the contribution of the host galaxy.
2 Observations and Data Reduction
We obtained integral field spectroscopy (IFS) of the core of 3C 120 using INTEGRAL (Arribas et al. 1998) at the WHT telescope to derive a clean spectrum of the E1 region. The observations were done on the 26th of February 2003, under photometric conditions and an average seeing disk of 1.2 FWHM. We obtained 3 exposures of 1200s using the SB2 fiber bundle, which comprises 219 fibers (189 science+30 sky fibers) each one of 0.9 in diameter projected on the sky, covering a total field-of-view of 1612. We used the low-resolution V300 grating centered at 5500Å, with a nominal spectral resolution of 450 at the central wavelength, covering the range between 3500-9000Å with a final sampling of 3Å/pixel. A detailed explanation of the data reduction and calibration will be presented elsewhere (Garcia-Lorenzo et al. in prep.). It basically comprises the standard steps, including bias subtraction, spectra extraction, flat-fielding, wavelength and flux calibration. Finally, an interpolation routine was applied over each monochromatic slice using E3D (Sánchez 2004), to obtain a regular grid datacube with 0.3 pixel. For comparison purposes we obtained a WFC F555W-band image of the 3C 120, available in the archive of the Hubble Space Telescope (HST). This image has a 3 limiting surface brightness magnitude of 25.5 mag/arcsec2, deep enough for the proposes of this article. Due to the width of the F555W-band this image traces the morphology of the continuum emission in 3C 120.
3 Analysis and Results
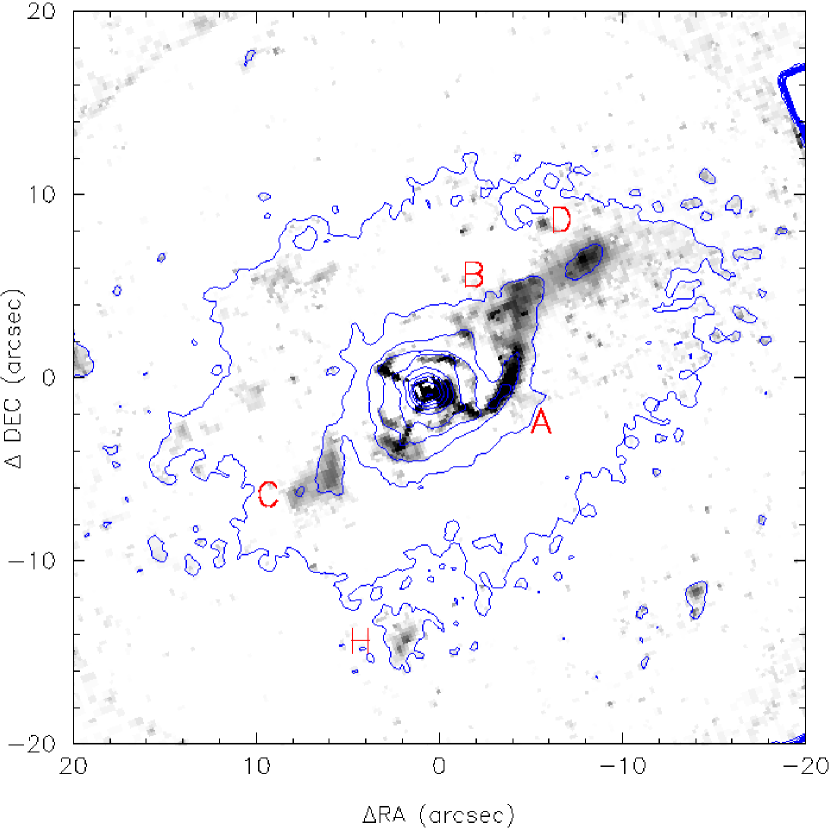
We create a model from the F555W-band image of the object using an isophotal surface brightness analysis, following the prescriptions described by Jedrzejewski (1987). The model was subtracted from the original image, obtaining a residual image. Hjorth et al. (1995) and Soubeyran et al. (1989) used this technique to detect the optical counterpart of the radio jet in 3C 120 and the EELRs, respectively. Figure 1 shows the resulting residual image in an arbitrary greyscale together with the contours of the original image. The different continuum-dominated substructures detected by Soubeyran et al. (1989) are indicated in the figure using their nomenclature. As expected, there is no trace of the emission-line dominated substructures.
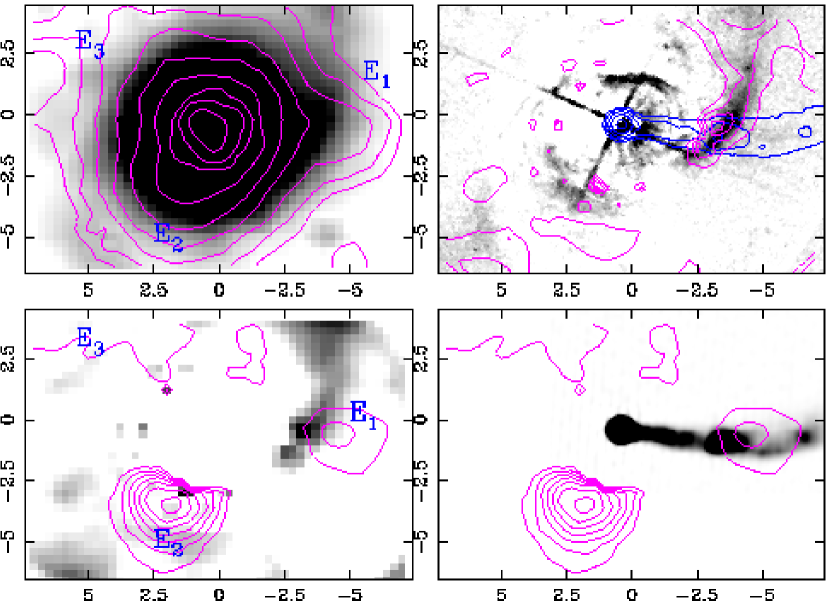
Figure 2, top-left panel, shows the intensity map of the [OIII]5007 emission line (contours) and the adjacent continuum (greyscale). These maps have been created coadding the intensities of the 5170-5200Å and 5204-5246Å wavelength ranges in the datacube, respectively, and subtracting the continuum from the emission line map. The emission line map is remarkably similar to the narrow-band image presented by Hua (1988), showing a strong gaseous emission extended through out the host galaxy. Despite the strong contamination from the nucleus and the hosts galaxy, it is possible to identify the [OIII] EELRs described by Soubeyran et al. (1989) (marked as E1, E2 and E3). To derive clean spectra of these substructures we create a galaxy+nucleus 3D template datacube and subtract it from the data.
First, we create for each wavelength a narrow band image of the width of one spectral pixel (Å) from the original datacube. Then, we model the object at each of these monochromatic images using two different techniques widely used the analysis of 2D images: (1) a 2D image modelling of the nucleus and the host and (2) an isophotal modelling based on a surface brightness analysis. The first method has the advantage that it also provides us with a decoupled spectra of the nucleus and the host galaxy (see Jahnke et al. 2004). Previous attempts of doing so have used long-slit spectrocopy, with the inherent limitations due to the loss of the 2D information (Jahnke 2002). A similar technique has been used successfully for the deblending of QSO lenses with IFS (Wisotzki et al. 2003). However, this method has the disadvantage that it requires a good estimation of the PSF, and it requires more assumptions about the morphology of the object (i.e., more parameters to fit). A more detailed description of the technique and its limitations will be presented elsewhere (Sánchez et al., in prep.).
The 2D image modelling of the nucleus and the host for each monochromatic image is performed using GALFIT (Peng et al. 2002). This program has been extensively tested in the image decomposition of QSO/hosts (Sanchez et al. 2004). The 2D model comprises a narrow gaussian function (to model the nucleus) and a de Vaucouleurs law (to model the galaxy) both convolved with a PSF. The PSF was obtained from a calibration star datacube, observed just before the object. The structural parameters of the host galaxy (PA, ellipticity and effective radius) were obtained by a 2D modelling of the F555W-band image. The fit over the datacube was performed twice: (1) leaving the centroid of the object and the intensities of both components free, and, (2) fixing the centroid by the result of a polynomial fitting as a function of the wavelength over the results of the first fit. This increases the accuracy of the recovered spectra (see Wisotzki et al. 2003). The final 3D datacube model is then subtracted from the original datacube to get a residual datacube.
As a second method, we perform a surface brightness analysis of each monochromatic image, using the same code that we used for the analysis of the F555W-band image (Fig. 1). This method provides us with a 2D model of the object, which we subtract from the original image to obtain a residual image for each wavelength. Like in the previous method, the technique was applied twice: (1) once to let the program look for the best elliptical isophote at each radii. The centroid, the PA, the ellipticity and the intensity are the free parameters; and (2), fixing all the parameters but the intensity to the values derived from a polynomial fitting as a function of the wavelength over the results of the first pass. We subtract the final 3D model from the original data to obtain a residual datacube.
The residual datacubes obtained using both techniques are quite similar. However, the residual produced by the first method shows a ring structure in the inner region at any wavelength. This structure, 1000 times fainter than the peak intensity of the nucleus, is not seen in the residual of the F555W-band image. Similar structures are normally found in this kind of 2D modelling due to inaccuracies in the determination of the PSF. This was our case, since we have clearly undersampled the PSF. Although it does not strongly affect the extracted spectra of the nucleus and the host, it introduces a non poissonian noise in the residual datacube. Due to that we restricted our analysis of the residuals to the datacube obtained with the second method, using the first method only for deblending the host and nucleus contributions.
It is important to note here that the PSF undersampling does not affect the accuracy of the centroid determination, fundamental to compare images taken with different instruments. The displacement of the object along the field-of-view at different wavelengths due to differential atmospheric refraction (Filippenko 1982) can be used to determine the centroid position with high precision (Mediavilla et al. 1998; Arribas et al. 1999; Wisotzki et al. 2003). The accuracy in the determination of the centroid in our IFS was better than 0.1, at any wavelength (Sánchez et al., in prep.).
Figure 2, top-right panel, shows a contour-plot of the narrow-band image at the continuum adjacent to the [OIII]5007 emission lines (5204-5246Å) extracted from the residual datacube. The grey-scale shows the residual of the continuum dominated F555W-band image. Both images were recentered by matching the peak of the central point-like source in the F555W-band image with the centroid of the object in the IFS data. The accuracy of the determination of the position of the peak in the HST image is a fraction of the pixel. Thus, the error in the recentering was dominated by the error in the determination of the centroid in the IFS data (, as quoted above). We used the rotator angle of the WHT and the WCS of the HST image to align both images in the sky. Despite the superior resolution of the HST image, the agreement between both maps is remarkable. There is an expected missmatch in the inner regions, where the arc structures seen in the HST image are not detected in the IFS map. This is a combined effect of the wider PSF and the worse sampling, that reduces the structural information in the inner regions. However, the A, B and C continuum dominated substructures (see Fig. 1) are clearly identified in the IFS residual map. This comparison demonstrates that the applied technique is valid to recover the substructures in this object. We overplotted the radio map at 4885 MHz, using its WCS to align them with the HST and the IFS data. The radio data were taken using the VLA in the A configuration, with a beam of 0.350.35 Walker (1997). There is no evident connection between the continuum structures and the radio jet. We will discuss elsewhere about the nature of these structures (García-Lorenzo, in prep.).
Figure 2, bottom-left panel, shows the contour-plot of the narrow-band image centred at the emission line [OIII]5007, at the redshift of the object (5170-5200Å), extracted from the residual datacube. The grey-scale shows the same narrow-band image of the continuum adjacent to this line as shown in the top-right panel. The EELRs are now clearly distiguished. There is no clear correspondence between the continuum-dominated substructures and these emission-line dominated ones. The bottom-right panel shows the same contour-plot together with a grey-scale representation of the radio map. The center of the E1 region is located at 1 north-west the radio knot at 4 (Soubeyran et al. 1989), just coincident with the bend in the radio jet, which passes across the EELR. Despite of the projection effects, this indicates most probably a physical connection between them (Axon et al. 1989; Soubeyran et al. 1989). We cannot confirm the detection reported by Axon et al. (1989) of an EELR associated with the undetected counter-jet, at 5 east from the nucleus.
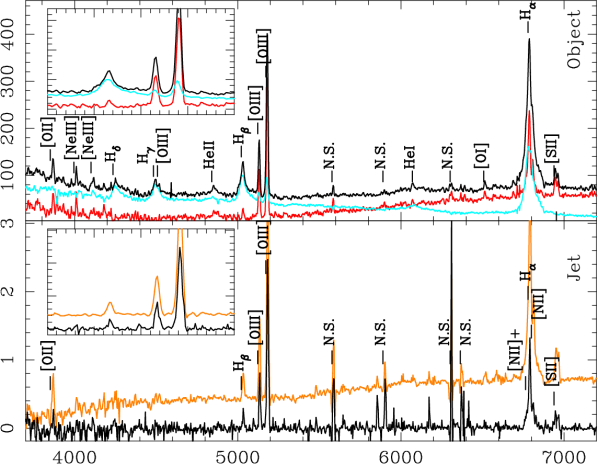
Figure 3, top panel, shows the integrated spectrum of 3C 120 in the wavelength range between 3700 and 7300 Å, together with the nucleus and host spectra obtained from the 2D fitting technique. The detected emission lines have been indicated with their corresponding names. A detail of the spectra in the [OIII]5007/H spectral region is also presented. The spectrum of the nucleus is clearly bluer than the host galaxy one. It contains all the broad emission lines, as expected. The narrow emission lines are considerably fainter than the broad emission lines. We only detected the [OIII] and [NII] lines (that blended with the broad H). The average host galaxy spectrum contains almost all the narrow emission lines. Recent results indicate that the ionized gas producing the observed narrow emission line in AGNs can extend throughout all the host galaxy (Jahnke 2002; Jahnke et al. 2004). There is no clear 4000Å break in the host spectrum, but a rise up in the blue-UV spectral range. This indicates most probably a large amount of star formation and/or a very young stellar population (Baldwin et al. 1980; Moles et al. 1988). However, the line ratios, log10([OIII]5007/H)=1.63 and log10([NII]/H)=0.39, indicate that the dominant ionization source of the gas in this galaxy is the AGN. The average dust content is high, with a Balmer ratio of H/H10 (4 mag). We cannot confirm the [OIII]5007/H values near to 1 in the nuclear regions, reported by Baldwin et al. (1980) and Hua (1988). Taking an average spectrum of the nucleus (1 aperture radius), once decontaminated from the broad emission line by a line-fitting deblending, we find a ratio remarkably similar to the average over the whole galaxy: log10([OIII]5007/H)=1.04.
Figure 3, bottom panel, shows the clean spectrum of the E1 region, obtained by coadding the spectra of the residual datacube in a 1 aperture centred in that region. For comparison, we plotted the spectrum of this area before decontamination (i.e., a non-clean spectrum). The differences between the spectra are clearly identified. The clean spectrum is an emission line dominated spectrum, as expected from pure ionized gas, with no significant continuum. On the other hand, the non-clean spectrum has a significant continuum contribution and its emission lines are 2.4 brighter, which indicates a strong contamination from the host galaxy. The Balmer ratio is H/H4 (1 mag) for the non-clean spectrum, in contrast with the H/H7 (3 mag) value for the clean one. The [OIII]5007/H and [NII]/H line ratios, and , are similar in the clean and non-clean spectra. They are also similar to the ratios found in the average host-galaxy spectrum.
Based on the above quoted line ratios the main mechanisms which might be involved in the emission line processes are: (1) photoionization by a hard UV continuum, emitted most probably by the AGN, and (2) high velocity radiative shocks which can influence the emission line processes due to the generation of a strong local UV photon field in the host post-shock zone. Both processes can generate the observed line ratios, under certain physical conditions (Veilleux & Osterbrock 1987; Dopita & Sutherland 1995). On the other hand, the line ratios exclude photoionization from a star-forming region (Veilleux & Osterbrock 1987).
In the case of photoionization by the AGN, there is a simple relation between the H and the nearby continuum luminosity (e.g., 4861Å), assuming a power-law for the ionizing continuum (Osterbrock 1989). Using the dust corrected H luminosity, the ionizing continuum should have an intensity of 10-16 erg s-1 cm-2 Å-1 at 4861Å. This intensity can be compared with the flux received by the E1 region from the AGN, using the spectrum of the nucleus described above. Assuming an isotropic emission and a decay of the flux, and considering that the E1 region has a diameter of 2 kpc (Axon et al. 1989), and it is at a distance of 10 kpc from the nucleus, this flux is 10-16 erg s-1 cm-2 Å-1. Under these assumptions, the amount of UV flux received by the E1 region from the AGN would be enough to photoionize it.
Assuming a photoionization mechanism we can derive the physical conditions in the cloud (Osterbrock 1989). Using the upper-limit to the flux of the undetected [OIII]4364 line, and the relation between the temperature and the ([OIII]5007+4959)/[OIII]4363 flux ratio, we obtain an upper limit to the effective temperature in the E1 region of 55000 K. We estimated the electron density, 160 cm-3, using the line ratio [SII]6716/6731 (1.3 for the clean spectrum) and the relation between this ratio and the density (assuming a temperature of 104K). These values are similar to those found in the EELRs associated with jet-cloud interactions in other radio galaxies (e.g. Villar-Martín et al. 1999; Solórzano-Iñarrea & Tadhunter 2003).
A post-shock zone can also give rise to the observed line ratios in the case of high shock velocities, 350-500 km s-1, and low magnetic fields, 0 cm3/2 (Dopita & Sutherland 1995). These velocities are in the range of the lateral expansion velocity estimated by Axon et al. (1989) for E1, 350-700 km s-1, assuming a projection angle 12-24°. However, such a low magnetic field implies a density lower than the previously derived from the [SII] line ratio. Dopita & Sutherland (1995) already noticed that under the effects of a shock the density derived from the [SII] line ratio is unreliable, due to the compression and the change of ionization stage in different regions. For low magnetic fields this ratio can be 1.3 for a pre-shock density of 1 cm-3. Dopita & Sutherland (1996) determined the relation between the H luminosity in the post-shock zone and the shock velocity and electron density. Using this relation it is required a shock velocity of 340 km s-1 to reproduce the observed luminosity of H. This velocity is similar to the estimated lateral expansion speed quoted above. Therefore, a shock process can also ionize the E1 region.
4 Conclusions
We developed a new technique for decoupling the spectra of different components in nearby galaxies and AGNs, using IFS. Using it we obtained, for the first time, the decoupled spectra of the nucleus and the host galaxy of 3C 120, and a clean spectrum of the EELR associated with its radio-jet. Two different mechanisms can cause the ionization of this region: direct photoionization by the AGN or by UV photons emitted by the gas cooling behind a shock front. In both cases, there are compelling evidences that the jet-cloud interaction plays a major role: (a) The lateral expansion of the jet and its interaction with the ISM is, most probably, the reason for the density enhancement in the E1 area (Axon et al. 1989); (b) In the case of direct photoionization the UV flux needs to reach the region without substantial absorption. The jet itself, which has associated high-energetic particles, can destroy the dust grains creating the observed dust decrease in this region; (c) In the case of a shock ionization, the lateral expansion of the jet produces the shock itself. Maybe the combined effect of a direct AGN and a shock induced photoionization has to be considered in order to understand the ionization of the E1 region.
5 Acknowledgments
This project is part of the Euro3D RTN on IFS, funded by the EC under contract No. HPRN-CT-2002-00305. The WHT is operated on the island of La Palma by the Isaac Newton Group in the Spanish Observatorio del Roque de los Muchachos of the IAC. This project has used images obtained from the HST archive, using the ESO archiving facilities. We would like to thank Dr.Walker that has kindly provided us with the radio maps of 3C 120. We would like to thank the anonymous referee that has helped us to improve the quality of this paper with his/her remarks.
References
- Arribas et al. (1998) Arribas, S., Carter, D., Cavaller, L., del Burgo, C., Edwards, R., Fuentes, F. J., Garcia, A. A., Herreros, J. M., Jones, L. R., Mediavilla, E., Pi, M., Pollacco, D., Rasilla, J. L., Rees, P. C., & Sosa, N. A. 1998, in Proc. SPIE Vol. 3355, p. 821-827, Optical Astronomical Instrumentation, Sandro D’Odorico; Ed., 821–827
- Arribas et al. (1999) Arribas, S., Mediavilla, E., García-Lorenzo, B., del Burgo, C., & Fuensalida, J. J. 1999, A&AS, 136, 189
- Axon et al. (1989) Axon, D. J., Pedlar, A., Unger, S. W., Meurs, E. J. A., & Whittle, D. M. 1989, Nature, 341, 631
- Baldwin et al. (1980) Baldwin, J. A., Carswell, R. F., Wampler, E. J., Boksenberg, A., Smith, H. E., & Burbidge, E. M. 1980, ApJ, 236, 388
- Dopita & Sutherland (1995) Dopita, M. A. & Sutherland, R. S. 1995, ApJ, 455, 468
- Dopita & Sutherland (1996) —. 1996, ApJS, 102, 161
- Filippenko (1982) Filippenko, A. V. 1982, PASP, 94, 715
- Halpern (1985) Halpern, J. P. 1985, ApJ, 290, 130
- Harris et al. (1999) Harris, D. E., Hjorth, J., Sadun, A. C., Silverman, J. D., & Vestergaard, M. 1999, ApJ, 518, 213
- Hjorth et al. (1995) Hjorth, J., Vestergaard, M., Sorensen, A. N., & Grundahl, F. 1995, ApJ, 452, L17+
- Hua (1988) Hua, C. T. 1988, A&A, 199, 105
- Jahnke (2002) Jahnke, K. 2002, PhD thesis, University of Hamburg, http://www.sub.uni-hamburg.de/disse/726/dissertation.pdf
- Jahnke et al. (2004) Jahnke, K., Wisotzki, L., Sánchez, S., Christensen, L., Becker, T., Kelz, A., & Roth, M. 2004, AN, 325, 128
- Jedrzejewski (1987) Jedrzejewski, R. I. 1987, MNRAS, 226, 747
- Mediavilla et al. (1998) Mediavilla, E., Arribas, S., del Burgo, C., et al., 1998, ApJ, 503, L27+
- Moles et al. (1988) Moles, M., del Olmo, A., Masegosa, J., & Perea, J. D. 1988, A&A, 197, 1
- Osterbrock (1989) Osterbrock, D. E. 1989, Astrophysics of gaseous nebulae and active galactic nuclei (University Science Books, 1989, 422 p.)
- Pérez-Fournon et al. (1986) Pérez-Fournon, I., Colina, L., Biermann, P., & Marcaide, J. M. 1986, in IAU Symp. 119: Quasars, 127
- Peng et al. (2002) Peng, C. Y., Ho, L. C., Impey, C. D., & Rix, H. 2002, AJ, 124, 266
- Sánchez (2004) Sánchez, S. 2004, AN, 325, 167
- Sanchez et al. (2004) Sanchez, S. F., Jahnke, K., Wisotzki, L., & et al. 2004, ApJ, (accepted) (astro-ph/0403645)
- Solórzano-Iñarrea & Tadhunter (2003) Solórzano-Iñarrea, C. & Tadhunter, C. N. 2003, MNRAS, 340, 705
- Soubeyran et al. (1989) Soubeyran, A., Wlerick, G., Bijaoui, A., Lelievre, G., Bouchet, P., Horville, D., Renard, L., & Servan, B. 1989, A&A, 222, 27
- Veilleux & Osterbrock (1987) Veilleux, S. & Osterbrock, D. E. 1987, ApJS, 63, 295
- Villar-Martín et al. (1999) Villar-Martín, M., Tadhunter, C., Morganti, R., Axon, D., & Koekemoer, A. 1999, MNRAS, 307, 24
- Walker (1997) Walker, R. C. 1997, ApJ, 488, 675
- Walker et al. (1987) Walker, R. C., Benson, J. M., & Unwin, S. C. 1987, ApJ, 316, 546
- Walker et al. (1988) Walker, R. C., Walker, M. A., & Benson, J. M. 1988, ApJ, 335, 668
- Wisotzki et al. (2003) Wisotzki, L., Becker, T., Christensen, L., Helms, A., Jahnke, K., Kelz, A., Roth, M. M., & Sanchez, S. F. 2003, A&A, 408, 455
- Wlerick et al. (1981) Wlerick, G., Cayatte, V., Michet, D., & Bouchet, P. 1981, A&A, 102, L17