7323
R. Della Ceca \mail
The broad-band properties of the XMM-Newton Bright Serendipitous Sources ††thanks: The XMM-Newton Bright Serendipitous Survey is part of the follow-up program being conducted by the XMM-Newton Survey Science Center (SSC), an international collaboration involving a consortium of 10 institutions, appointed by ESA to help the SOC in developing the software analysis system, to pipeline process all the XMM-Newton data, and to exploit the XMM serendipitous detections, see http://xmmssc-www.star.le.ac.uk. The OABrera is one of the Consortium Institutes.
Abstract
We present here “The XMM-Newton Bright Serendipitous Survey”, a survey program conducted by the XMM-Newton Survey Science Center. In particular we discuss the main goals of this project, we present the sample(s) and the current optical breakdown and we discuss some broad band spectral properties as derived from an hardness ratio analysis of the single sources. Finally we report the 4.5–7.5 keV Log(NS)-LogS for type 1 and type 2 AGN.
keywords:
Diffuse X-ray background – X-ray surveys – active galactic nuclei1 Introduction
Deep Chandra and XMM–Newton observations (Brandt et al., 2001; Rosati et al., 2002; Moretti et al., 2003; Hasinger et al., 2001; Alexander et al., 2003) have recently resolved % of the 2–10 keV cosmic X-ray background (CXB) into discrete sources down to 10-16 erg cm-2 s-1. The X–ray data (stacked spectra and hardness ratios) of these faint samples are consistent with AGN being the dominant contributors of the CXB and, as inferred by the X–ray colors, a significant fraction of these sources have hard, presumably obscured, X–ray spectra, in agreement with the predictions of CXB synthesis models (Setti and Woltjer, 1989; Comastri et al., 2001; Gilli et al., 2001; Ueda et al., 2003).
However, the majority of the sources found in these medium to deep fields are too faint to provide good X–ray spectral information. Furthermore, the extremely faint magnitudes of a large number of their optical counterparts make the spectroscopic identifications very difficult, or even impossible, with the present day ground–based optical telescopes. Thus, notwithstanding the remarkable results obtained by reaching very faint X–ray fluxes, the broad–band physical properties (e.g. the relationship between optical absorption and X-ray obscuration and the reason why AGN with similar X-ray properties have completely different optical appearance) are not yet completely understood. In the medium flux regime ( between and erg cm-2 s-1) a step forward towards the solution of some of these problems has been undertaken by Manieri et al., 2002; Piconcelli et al., 2003, Perola et al., 2004 and Mateos et al., 2004.
With the aim of complementing the results obtained by medium to deep X-ray surveys, we have built the “The XMM-Newton Bright Serendipitous Source Sample”. We describe below the main characteristics of this sample and discuss some of the results obtained so far. The contribution of this project to the solution of some critical open (and “hot”) questions like the relationship between optical absorption and X-ray obscuration and the physical nature of the “X-ray bright optically normal galaxies” have been already discussed in Caccianiga et al. (2004) and Severgnini et al. (2003), respectively. We stress that many of these issues are investigated with difficulties using the fainter X-ray samples because of their typical poor counts statistics for each source.
2 The XMM-Newton Bright Serendipitous Source Sample
The XMM Bright Serendipitous Source Sample, a project coordinted by the Osservatorio Astronomico di Brera, consists of two flux-limited samples: the XMM BSS and the XMM HBSS sample having a flux limit of erg cm-2 s-1 in the 0.5-4.5 keV and 4.5-7.5 keV energy band, respectively. This approach was dictated by the need of studying the composition of the source population as a function of the selection band and of reducing the strong bias against absorbed sources which occurs when selecting in soft X-rays.
Two hundred and thirty-seven suitable XMM fields (211 for the HBSS) at deg (see Della Ceca et al., 2004) were analyzed and a sample of 400 sources was selected (see Table 1 for details).
| BSS | HBSS | |
| Objects1 | 389 | 67 |
| Area Covered (deg2) | 28.10 | 25.17 |
| Identified: | 278 | 60 |
| Identification rate | 71% | 90% |
| AGN-1 | 180 | 39 |
| AGN-2 | 26 | 16 |
| Galaxies2 | 7 | 1 |
| Clusters of Galaxies 3 | 4 | 1 |
| BL Lacs | 5 | 1 |
| Stars4 | 56 | 2 |
1 Fifty-six sources are in common between the BSS and HBSS samples; 2 We stress that some of the sources classified as “Optical Normal Galaxy” could indeed host an optically elusive AGN (see Severgnini et al., 2003); 3 The source detection algorithm is optimized for point-like objects, so the sample of clusters of galaxies is not statistically complete nor representative of the cluster population; 4 All but one of the sources classified as stars are coronal emitters.
The majority of the X-ray sources have enough statistics (hundreds to thousands of counts when the data from the three EPIC detectors are considered) to allow X-ray studies in terms of energy distributions, absorption properties, source extent and flux variability. Moreover the optical counterpart of % of the X-ray sources has a magnitude brighter than the POSS II limit (R 21mag), thus allowing spectroscopic identification at a 2-4 meter class telescope; this fact, combined with the positional accuracy of XMM for bright sources (90% error circle of 4′′) implies that, in the large majority of the cases, only one object needs to be observed to secure the optical identification.
Up to now 285 X-ray sources have been spectroscopically identified (either from the literature or from our own observations) leading to a 71% and 90% identification rate for the BSS and HBSS samples respectively (see Table 1 for a summary).
3 The broad band X-ray spectral properties
A “complete” spectral analysis for all the sources in the BSS and HBSS samples (using data from the two EPIC MOSs and the EPIC pn) is in progress. In the meantime, and in order to extract first order X-ray spectral information we report here a “Hardness Ratio” analysis of the single sources using only EPIC MOS2 data. However we note that a “Hardness Ratio” is often the only X-ray spectral information available for the faintest sources in the XMM-Newton catalogue, and thus, a “calibration” in the parameter space is needed to select “clean” and well-defined samples.
We have used the hardness ratios as defined from the pipeline processing:
and
where C(0.52 keV), C(24.5 keV) and C(4.57.5 keV) are the “PSF and vignetting corrected” count rates in the 0.52, 24.5 and 4.57.5 keV energy bands, respectively.
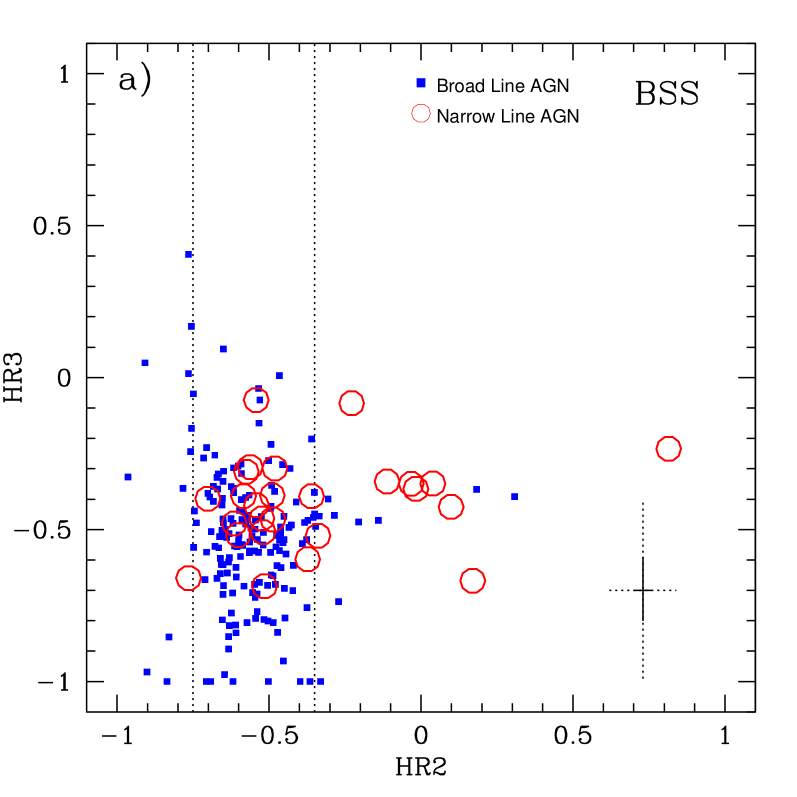
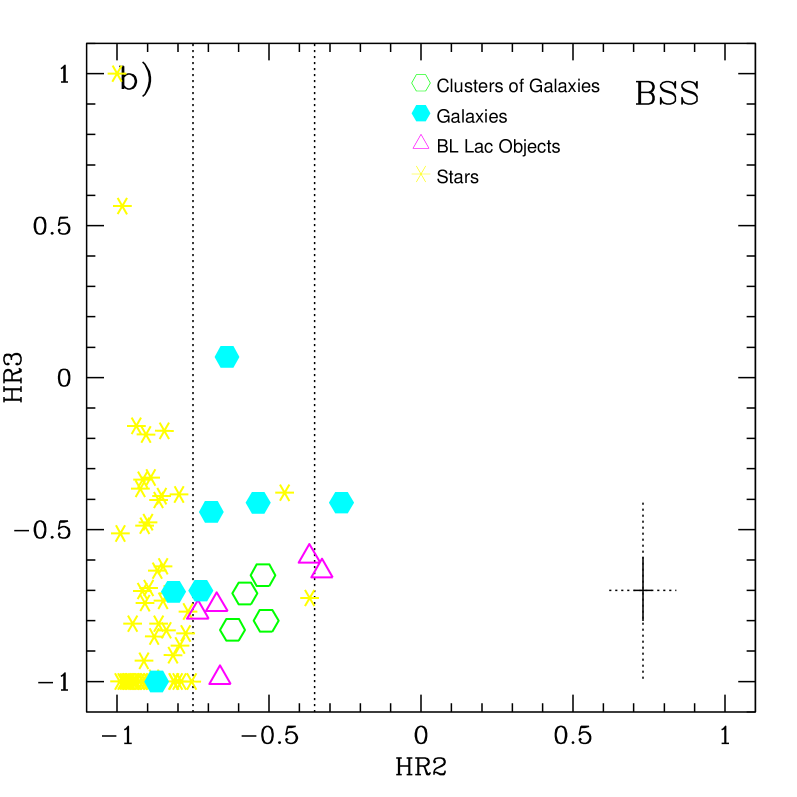
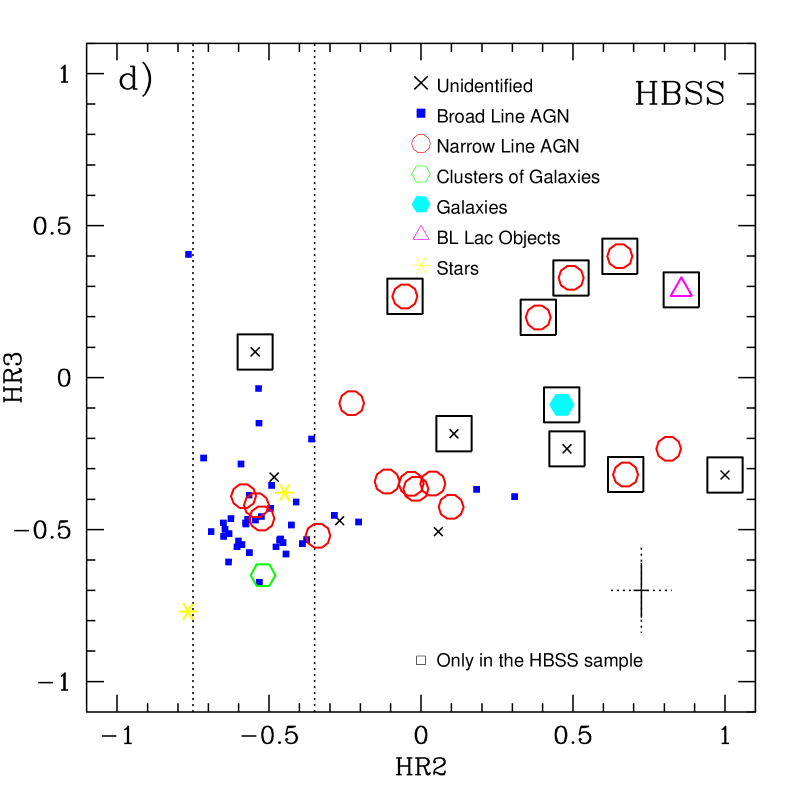
Combining the information on HR2 and HR3 (see figure 1) we can investigate the broad band spectral properties of the sample(s) as well as the selection function(s) of the BSS and HBSS. From figure 1 it is worth noting that:
the “bulk” of the sources optically identified as broad line AGNs (both in the BSS and HBSS sample) are strongly clustered in a narrow HR2 region between and (corresponding to a photon index in the range between and if we assume a simple power-law spectral model);
all but 2 ( %) of the sources classified as stars in the BSS sample have an HR2 less than . If we assume a simple Raymond-Smith thermal model, HR20.75 corresponds to temperatures below keV, in very good agreement with the identification as coronal emitters;
contrary to broad line AGNs and stars, narrow line AGNs seem to be distributed over a larger area in the HR2-HR3 plane with a well visible difference in the source position between the Type 2 AGNs in BSS and those in the HBSS sample (e.g. the large majority of the type 2 AGN in the HBSS have HR2 );
although many of the narrow line AGN have the hardest spectra amongst the identified objects, highly suggestive of intrinsic absorption (see Caccianiga et al., 2004), there is an indication from this study that a significant number of narrow line AGN in the BSS sample occupy the locus typical of X-ray unabsorbed broad line AGN. A deeper investigation of these sources is in progress;
the eleven objects belonging only to the HBSS sample are amongst the hardest X-ray sources in the sample. Among these sources there are 5 Type 2 AGN, one optically normal galaxy, one BLLac object and 4 unidentified sources.

4 The X-ray to optical flux ratios
A useful parameter to discriminate between different classes of X-ray sources is the X-ray to optical flux ratio. Previous investigations (e.g. Maccacaro et al., 1988; Fiore et al., 2003 and references therein) have shown that standard X-ray selected AGN (both type 1 and type 2) have an X/O flux ratio typically in the range between 0.1 and 10; X/O flux ratios below 0.1 are typical of stars, normal galaxies (both early type and star-forming) and nearby heavly absorbed (Compton thick) AGN; finally, at high X/O flux ratios (above 10), we can find broad and narrow line AGN as well as high-z high-luminosity obscured AGN (type 2 QSOs), high-z clusters of galaxies, and extreme BL Lac objects.
In figure 2 we have plotted the X/O flux ratio versus the HR2 value for each source in the BSS or HBSS sample.
The bulk of coronal emitting stars is well separated from the bulk of extragalactic sources. Some of the AGN (both broad and narrow line) have an X/O flux ratio typical of stars but HR2 values typical of AGN. Similarly some AGN with an HR2 typical of stars can be distinguished from stars thanks to their X/O flux ratio. Therefore the combined use of X/O flux ratio and HR2 allows us to distinguish almost unequivocally galactic sources from the extragalactic ones, prior to optical spectroscopy.
Around 10% of the extragalactic population have an X/O flux ratio 10. If we consider the 2–10 keV fluxes instead of the 0.5–4.5 keV fluxes this fraction increases to %, in good agreement with the results obtained by Fiore et al. (2003) at fainter fluxes. Amongst the sources with X/O flux ratio 10 identified so far there are some broad line and a few narrow line AGN but the large majority of the X-ray sources in this part of the X/O diagram is still unidentified. According to Fiore et al. (2003) some type 2 QSOs are expected among these objects.
The opposite side of the extragalactic X/O flux ratio distribution (X/O ) seems to be populated by optically normal galaxies, Type 2 AGNs and a few broad line AGN.
![[Uncaptioned image]](/html/astro-ph/0407127/assets/x5.png)
![[Uncaptioned image]](/html/astro-ph/0407127/assets/x6.png)
![[Uncaptioned image]](/html/astro-ph/0407127/assets/x7.png)
|
5 The number densities of broad and narrow line AGN
The spectroscopic identification rate of the HBSS sample is %, allowing us to investigate for the first time the X-ray Log(NS)-LogS of broad and narrow line AGN in the same sample; these Log(NS)-LogS have been reported in figure 3.
At the 4.5–7.5 keV flux limit of erg cm-2 s-1 the surface densities of type 1 AGN and type 2 AGN are deg-2 and deg-2, respectively. Type 2 AGN represent ()% of the AGN population shining in the 4.5–7.5 keV energy band above erg cm-2 s-1; finally, at the same flux limit, type 2 QSOs are % of the type 2 AGN population (using a surface density of type 2 QSOs of deg-2 as measured by Caccianiga et al., 2004).

6 Conclusions
We have presented results of a survey project started few years ago. Full details of the results presented here, along with the basic information on the complete sample of 400 sources, can be found in Della Ceca et al. (2004). Other results have been also discussed in Severgnini et al. (2003) and Caccianiga et al. (2004).
Since the investigated sample is a fair representation of the high galactic latitude X-ray sky, the results from this project will help with the candidates selection of interesting classes of sources from the XMM-Newton catalogue prior to spectroscopic observations, making the existing and incoming XMM-Newton catalogs 111see http://xmmssc-www.star.le.ac.uk an unique resource for astrophysical studies.
Acknowledgements.
RDC, TM, AC, PS, VB acknowledge partial financial support by the Italian Space Agency (ASI grants: I/R/037/01, I/R/062/02 and I/R/071/02), by the MURST (Cofin-03-02-23) and by INAF. We thank the TNG Time Allocation Committee for a generous and continuos allocation of observing time.References
- (1) Alexander, D. M., et al. 2003, A.J., 126, 539
- (2) Brandt, W.N., et al. 2001, AJ, 122, 2810
- (3) Caccianiga, A., et al. 2004, A&A, 416, 901
- (4) Comastri, A. et al. 2001, MNRAS, 327, 781
- (5) Della Ceca, R., et al. 2004, A&A, submitted
- (6) Fiore, F., et al. 2003, A&A, 409, 79
- (7) Gilli, R., et al. 2001, A&A, 366, 407
- (8) Hasinger, G., et al. 2001, A&A, 365, L45
- (9) Maccacaro, T., et al. 1988, ApJ, 326, 680
- (10) Mainieri, V., et al. 2002, A&A, 393, 425
- (11) Mateos, S., et al. 2004, A&A, submitted
- (12) Moretti, A., et al. 2003, ApJ, 588, 696
- (13) Perola, G.C., et al. 2004, A&A, in press, astro-ph/0404044.
- (14) Piconcelli, E., et al. 2003, A&A, 412, 689
- (15) Rosati, P., et al. 2002, ApJ, 566, 667
- (16) Severgnini, P., et al. 2003, A&A, 406, 483
- (17) Setti, G & Woltjer, L. 1989, A&A, 224, 21
- (18) Ueda, Y., et al 2003, ApJ, 598, 886