Cataclysmic Variables from SDSS III. The Third Year1
Abstract
This paper continues the series that identifies new cataclysmic variables found in the Sloan Digital Sky Survey. We present 36 cataclysmic variables and one possible symbiotic star from Sloan spectra obtained during 2002, of which 34 are new discoveries, 2 are known dwarf novae (BC UMa, KS UMa) and one is a known CV identified from the 2dF survey. The positions, colors and spectra of all 37 systems are presented, along with follow-up spectroscopic/photometric observations of 10 systems. As in the past 2 years of data, the new SDSS systems show a large variety of characteristics based on their inclination and magnetic fields, including 3 eclipsing systems, 4 with prominent He II emission, and 15 systems showing features of the underlying stars.
Subject headings:
binaries: eclipsing — binaries: spectroscopic — cataclysmic variables — stars: dwarf novae1. Introduction
At the present time, the Sloan Digital Sky Survey (SDSS) data have been released to the public as the Early Data Release (EDR; Stoughton et al. 2002), Data Release 1 (DR1; Abazajian et al. 2003, see http://www.sdss.org), and Data Release 2 (DR2; Abazajian et al. 2004). Mining the database for cataclysmic variables (CVs) has resulted in the discovery of 19 new CVs from the SDSS spectra obtained through 2000 December 31 (Szkody et al. 2002; Paper I) and an additional 35 from spectra through 2001 December 31 (Szkody et al. 2003b; Paper II). This paper continues the series that is reporting CVs on a yearly basis with 36 systems (and one possible symbiotic star) that were found among the SDSS spectra obtained during the year 2002. Three of these objects were previously known from past X-ray or optical surveys, whereas the rest are new discoveries. Follow-up photometric and spectroscopic observations of the new systems, providing light and radial velocity curves, can allow a determination of their orbital period, which is a fundamental parameter in identifying CVs (see Warner 1995 for a comprehensive review of all types of CVs).
2. Observations and Reductions
The details of the SDSS imaging and spectroscopic instrumentation and reductions are explained in Paper I and in the papers by Fukugita et al. (1996), Gunn et al. (1998), Lupton, Gunn, & Szalay (1999), York et al. (2000), Hogg et al. (2001), Lupton et al. (2001), Smith et al. (2002), and Pier et al. (2003). Briefly, SDSS photometry in 5 filters () is used to select objects by color for later spectroscopy in the range of 3900-6200Å (blue beam) and 5800-9200Å (red beam) at a resolving power of 1800. The spectra are calibrated for wavelength and flux and then classified as stars, galaxies and quasars. As explained in Papers I and II, cataclysmic variables have spectra obtained through several color selection algorithms, since their colors overlap with those of hot stars, quasars, white dwarf and M stars, depending on how much the accretion disk or accretion column contributes to the optical light over that of the underlying white dwarf and late-type secondary star. The only difference in the procedures used in this paper over those in the past 2 papers is that we have automated the identification process with a computer script that finds all spectra with Balmer absorption or emission lines on a given plate (instead of inspecting all spectra on a plate by hand). The resulting spectra are then hand-identified as white dwarfs or CVs. As a cross-check on the accuracy of the computer identification, all the DR1 plates were run through the algorithm and all the previous CVs identified in Papers 1 and 2 were recovered.
The list of 36 CVs (and the possible symbiotic) found in SDSS spectra taken in 2002 is presented in Table 1. As in the previous listings, the magnitudes and colors are from the point-spread function photometry with no correction for interstellar reddening. To make it easier to locate objects in the spectral database, we give the plate, fiber and MJD of each spectrum in the Table. For convenience, we will refer to these objects throughout the rest of this paper as SDSS Jhhmm, except for 2 objects which have identical RA coordinates, so we add the first 2 digits of declination to discriminate.
. We were able to conduct follow-up observations on several systems to refine their characteristics (predominantly an estimate of their orbital period and whether they were at a high enough inclination to be eclipsing). Photometry was accomplished with the US Naval Observatory Flagstaff Station (NOFS) 1m telescope with a 1024 1024 SITe/Tektronix CCD. Differential photometry with respect to stars in the field was used to obtain light curves. With one exception, no filter was used to maximize the S/N, but nights of calibrated all-sky photometry with Landolt standards were used to calibrate the comparison stars so that the photometry could be placed onto the Johnson magnitude system. For the brightest system (SDSS J0808), a filter was used for the observation.
| SDSS J | MJD-P-FbbLast 5 digits of Modified Julian Date of Spectrum-Plate-Fiber | (hr)ccPeriods marked with : are estimates based on single-night observations | CommentsddDN is a dwarf nova, ec is eclipsing, NP is not polarized, symb is symbiotic | |||||
|---|---|---|---|---|---|---|---|---|
| 004335.14003729.8 | 52531-1085-175 | 19.84 | 0.37 | 0.01 | –0.23 | 0.18 | 1.3: | |
| 074813.54290509.2eeObject is southeastern star of a close pair | 52618-1059-407 | 18.62 | –0.08 | –0.16 | 0.01 | –0.05 | 2.5: | HeII NP |
| 080846.19313106.0* | 52318-861-352 | 19.43 | –0.29 | 0.68 | 0.62 | 0.40 | DN | |
| 090016.56430118.2* | 52294-831-435 | 18.88 | –0.22 | 0.68 | 0.69 | 0.49 | 5.3: | |
| 090403.48035501.2* | 52238-566-380 | 19.24 | 0.26 | –0.09 | –0.18 | 0.04 | 1.4 | ec |
| 090452.09440255.4* | 52294-831-410 | 19.38 | 0.29 | –0.11 | –0.23 | –0.07 | ||
| 093249.57472523.0* | 52316-834-431 | 17.81 | 0.22 | –0.03 | –0.08 | 0.05 | 1.7: | HeII |
| 094325.90520128.8* | 52281-768-13 | 16.45 | 0.15 | –0.10 | –0.15 | –0.16 | ||
| 095135.21602939.6* | 52282-770-358 | 20.02 | –0.12 | 0.03 | –0.21 | 0.16 | ||
| 101323.64455858.9 | 52614-944-397 | 18.86 | –0.33 | –0.03 | 0.15 | 0.29 | ||
| 102026.53530433.1* | 52381-904-147 | 17.44 | –0.08 | 0.24 | –0.04 | 0.28 | 1.6 | KS UMa |
| 113215.50624900.4* | 52319-776-381 | 18.49 | –0.30 | 0.16 | 0.08 | –0.06 | ||
| 115215.83491441.9 | 52412-968-280 | 18.51 | 0.14 | –0.10 | –0.09 | 0.31 | 1.5 | BC UMa |
| 115639.48630907.7* | 52320-777-574 | 20.73 | 0.38 | 1.79 | 0.22 | –0.04 | ||
| 121607.03052013.9* | 52378-844-423 | 20.12 | 0.21 | 0.12 | –0.29 | 0.00 | ||
| 124426.26613514.6* | 52373-781-93 | 18.76 | –0.04 | –0.11 | 0.07 | 0.35 | ||
| 124959.76035726.6* | 52426-847-46 | 16.63 | –0.35 | –0.05 | 0.38 | 0.28 | ||
| 130236.21060148.0* | 52439-849-419 | 21.59 | 2.33 | 1.62 | 2.26 | 1.25 | symb-like | |
| 130514.73582856.3* | 52410-958-297 | 19.27 | –0.17 | –0.04 | 0.19 | 0.05 | ||
| 132411.57032050.5* | 52342-527-323 | 22.12 | 1.21 | 1.63 | 0.26 | 0.79 | 2.6 | Polar |
| 133540.76050722.7* | 52374-853-498 | 18.46 | –0.02 | –0.17 | –0.16 | –0.20 | ||
| 142256.31022108.1* | 52404-918-301 | 19.84 | –0.35 | 0.50 | 0.36 | 0.27 | 2dF, HeII | |
| 150137.22550123.4* | 52353-792-44 | 19.40 | 0.24 | 0.02 | –0.21 | 0.01 | 1.3 | ec |
| 153817.35512338.0* | 52401-796-388 | 18.61 | –0.23 | –0.28 | –0.14 | 0.21 | 1.6: | |
| 155037.27405440.0* | 52468-1053-14 | 18.58 | –0.34 | 0.21 | 0.11 | –0.17 | ||
| 161030.35445901.7* | 52443-814-280 | 19.81 | 0.08 | –0.06 | –0.47 | 0.14 | ||
| 162212.45341147.3 | 52522-1057-203 | 19.15 | 0.19 | 0.43 | 0.30 | 0.40 | HeII | |
| 162608.16332827.8 | 52520-1058-433 | 18.38 | 0.08 | –0.21 | –0.21 | –0.07 | HeII | |
| 170213.26322954.1* | 52426-973-144 | 17.92 | –0.60 | 0.10 | 0.40 | 0.60 | 2.5 | ec |
| 170324.09320953.2* | 52426-973-97 | 18.17 | –0.77 | 0.56 | 0.36 | 0.56 | ||
| 170542.54313240.8* | 52411-975-400 | 19.67 | 0.12 | 0.48 | 0.48 | 0.25 | ||
| 171145.08301320.0* | 52410-977-402 | 20.25 | 0.20 | 0.05 | –0.09 | –0.09 | ||
| 204720.76000007.7* | 52466-982-477 | 19.40 | –0.12 | 0.15 | 0.02 | 0.02 | ||
| 210014.12004446.0* | 52442-984-533 | 18.78 | –0.19 | 0.10 | 0.07 | 0.03 | 1.9 | DN |
| 210241.09004408.3* | 52438-984-52 | 17.22 | 1.29 | 0.10 | 0.07 | 0.02 | ||
| 211605.43113407.5* | 52468-729-363 | 15.31 | 0.04 | –0.26 | –0.16 | –0.20 | ||
| 223252.35140353.0 | 52521-738-509 | 17.69 | 0.14 | –0.15 | –0.08 | –0.09 | DN |
Time-resolved spectroscopy was accomplished at the Apache Point Observatory (APO) 3.5m telescope with the Double Imaging Spectrograph in high resolution mode (resolution about 3Å) and a 1.5 arcsec slit. The reductions were identical to those of Papers I and II. Velocities were measured with either the “e” (which determines the centroid of the line) or “k” (which fits a Gaussian to the line) in the IRAF 111IRAF (Image Reduction and Analysis Facility) is distributed by the National Optical Astronomy Observatories, which are operated by AURA, Inc., under cooperative agreement with the National Science Foundation. package (for simple or narrow line structure) or with a double-Gaussian method (Shafter 1983) for lines with central absorption or narrow emission components within the broad emission. Least-squares fitting of sinusoids to the velocities was then performed to determine (systemic velocity), K (semi-amplitude), P (orbital period) and (phase of crossing from redshift to blueshift). Note that since the spectroscopic solutions from APO data are based on a single night of data, the periods are only estimates which need to be fully determined with longer datasets. The estimates are designated in Table 1 with a colon following the period.
Circular polarization measurements were obtained for SDSS J0748, using the CCD Spectropolarimeter SPOL with a low resolution grating on the 6.5m MMT at Mt. Hopkins (MH). The dates and types of follow-up observations are summarized in Table 2.
| SDSS J | UT Date | Site | Time (UT) | Exp (s) | Data Obtained |
|---|---|---|---|---|---|
| 0043 | 2003 Sep 27 | APO | 06:22–09:05 | 900 | 10 spectra |
| 0748 | 2003 Sep 27 | APO | 09:28–12:04 | 600/900 | 10 spectra |
| 0748 | 2003 Nov 1 | MMT | 09:52–10:32 | 2400 | spectropolarimetry |
| 0748 | 2004 Jan 28 | NOFS | 02:04–06:16 | 180 | photometry |
| 0808 | 2003 Nov 27 | APO | 09:04–09:24 | 1200 | 1 spectrum |
| 0808 | 2004 Jan 26 | NOFS | 03:04–12:10 | 90 | V photometry |
| 0900 | 2002 Feb 22 | APO | 02:41–06:41 | 600 | 21 spectra |
| 0900 | 2004 Jan 29 | NOFS | 02:14–11:44 | 180 | photometry |
| 0932 | 2002 Jan 4 | APO | 05:38–09:26 | 900 | 14 spectra |
| 1501 | 2003 Jun 25 | NOFS | 04:05–09:22 | 240 | photometry |
| 1538 | 2002 Jun 26 | APO | 04:54–06:40 | 900/600 | 9 spectra |
| 1702 | 2002 Oct 3 | APO | 02:29–03:29 | 600 | 6 spectra |
| 1702 | 2003 Apr 27 | APO | 10:37–11:34 | 600/900 | 4 spectra |
| 1702 | 2003 Jun 26 | APO | 06:52–10:10 | 600 | 16 spectra |
| 1702 | 2003 Jul 3 | NOFS | 03:34–10:48 | 180 | photometry |
| 2102 | 2003 Dec 21 | APO | 01:19–02:14 | 600 | 5 spectra |
| 2232 | 2003 Oct 20 | NOFS | 01:33–08:34 | 240 | photometry |
3. Results
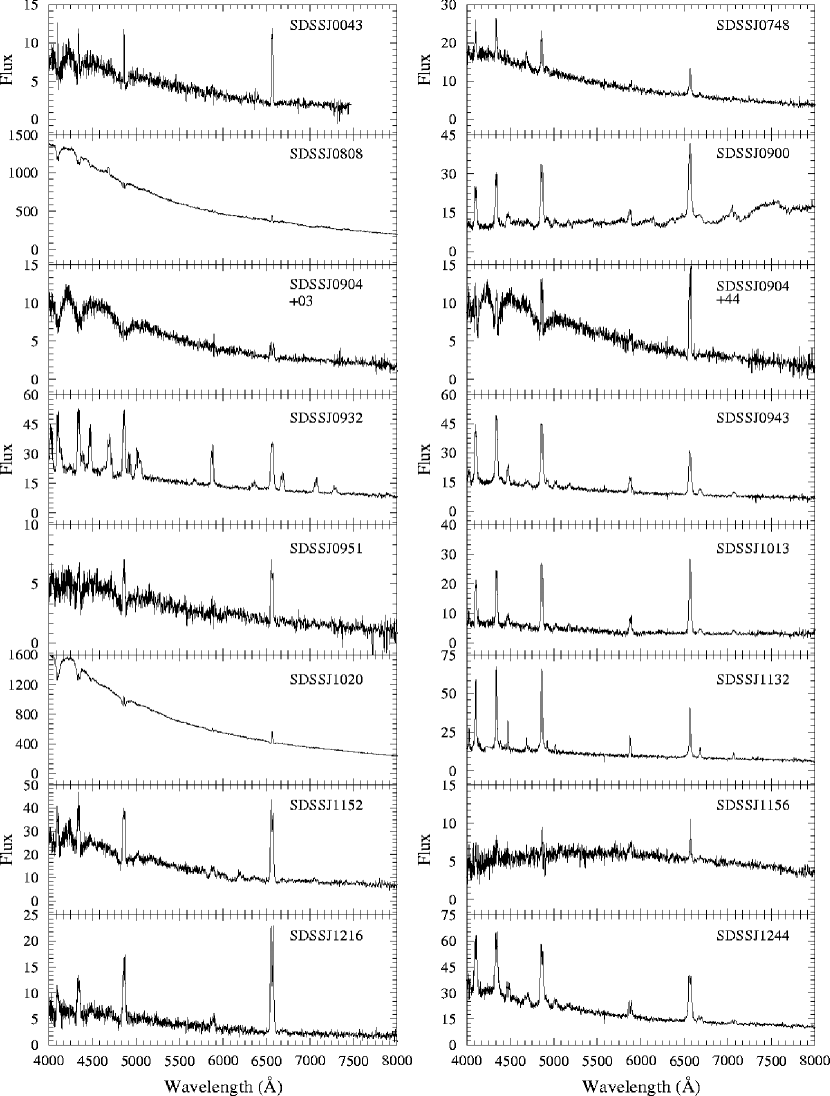
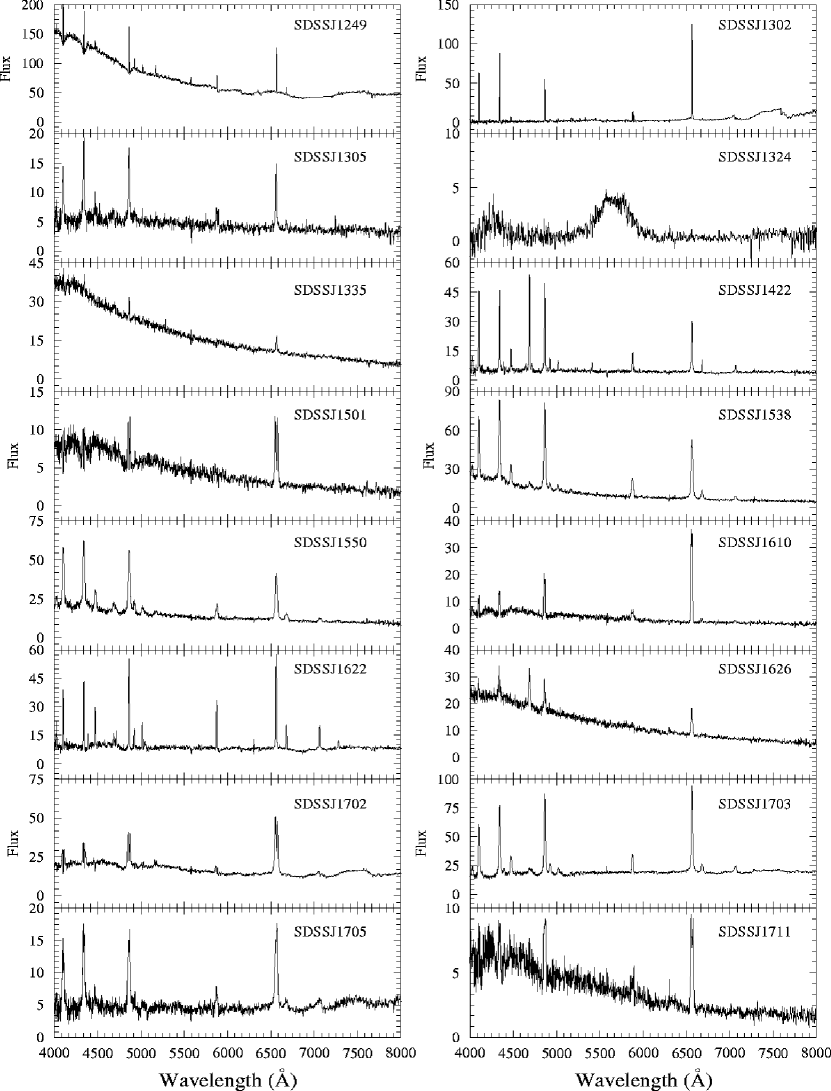
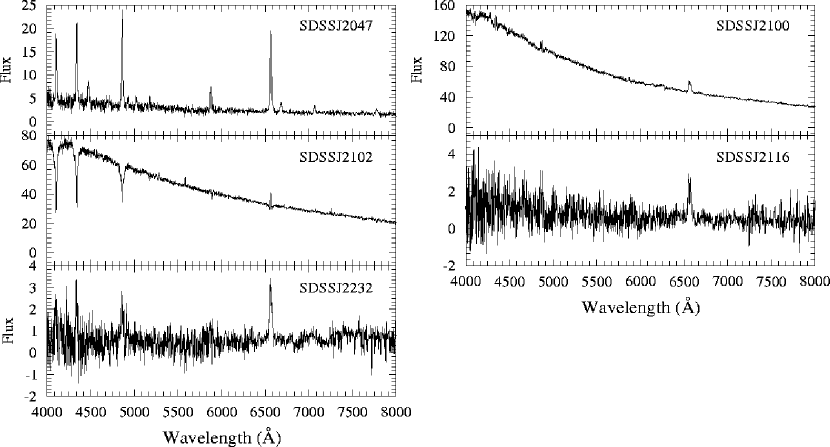
Figure 1 shows the SDSS spectra for all 37 systems, while Table 3 lists the equivalent widths and fluxes of the prominent hydrogen Balmer and helium emission lines. Using the appearance of the spectra and the follow-up data when available, we can separate the objects into various categories as described below.
| SDSS J | H | H | He4471 | HeII4686 | ||||
|---|---|---|---|---|---|---|---|---|
| EW | EW | EW | EW | |||||
| 0043 | 1.0 | 23 | 1.8 | 91 | ||||
| 0748 | 1.7 | 13 | 1.7 | 27 | 0.12 | 1.0 | 0.5 | 4 |
| 0808 | 5.9 | 1.0 | 8.4 | 1.0 | ||||
| 0900 | 6.9 | 61 | 10 | 75 | 1.1 | 10 | ||
| 0904+03 | 0.2 | 3.0 | 0.7 | 26 | ||||
| 0904+44 | 1.4 | 23 | 2.9 | 93 | ||||
| 0932 | 8.9 | 43 | 9.2 | 74 | 5.3 | 23 | 5.8 | 26 |
| 0943 | 8.9 | 60 | 7.8 | 87 | 2.3 | 15 | 0.6 | 4 |
| 0951 | 1.2 | 46 | 1.6 | 89 | ||||
| 1013 | 5.4 | 96 | 7.0 | 176 | 0.8 | 12 | ||
| 1020 | 16 | 2 | 19 | 5 | ||||
| 1132 | 9.9 | 70 | 6.7 | 71 | 2.0 | 13 | 1.3 | 10 |
| 1152 | 7.4 | 46 | 11.3 | 127 | 0.4 | 2 | ||
| 1156 | 0.5 | 9 | 0.6 | 12 | ||||
| 1216 | 3.6 | 73 | 7.0 | 245 | ||||
| 1244 | 14.9 | 64 | 12.4 | 92 | 2.4 | 9 | 1.4 | 6 |
| 1249 | 2.5 | 3 | 4.3 | 8 | ||||
| 1302 | 2.5 | 104 | 8.9 | 153 | 0.3 | 18 | ||
| 1305 | 2.1 | 38 | 2.0 | 51 | 0.5 | 8 | 0.1 | 2 |
| 1335 | 0.6 | 2 | 0.9 | 8 | ||||
| 1422 | 4.6 | 97 | 3.5 | 73 | 1.0 | 19 | 3.9 | 63 |
| 1501 | 1.6 | 33 | 2.9 | 101 | ||||
| 1538 | 13.5 | 84 | 12.7 | 167 | 2.4 | 12 | 0.8 | 5 |
| 1550 | 9.5 | 49 | 9.3 | 79 | 3.5 | 19 | 1.6 | 9 |
| 1610 | 2.0 | 53 | 5.5 | 320 | ||||
| 1622 | 4.8 | 57 | 6.3 | 73 | 1.8 | 17 | 0.6 | 6 |
| 1626 | 2 | 11 | 1.9 | 22 | 1.9 | 10 | ||
| 1702 | 6.4 | 33 | 13.1 | 88 | ||||
| 1703 | 11.6 | 56 | 14.7 | 73 | 3.1 | 17 | 1.3 | 7 |
| 1705 | 3.8 | 83 | 4.4 | 90 | 0.4 | 7 | ||
| 1711 | 1.3 | 31 | 2.4 | 97 | ||||
| 2047 | 3.5 | 102 | 3.6 | 173 | 1.1 | 30 | 0.2 | 6 |
| 2100 | 0.4 | 2 | 0.9 | 8 | ||||
| 2102 | 1.2 | 4 | ||||||
| 2116 | 0.4 | 38 | 0.8 | 143 | ||||
| 2232 | 0.7 | 187 | 0.9 | 167 | ||||
3.1. Previously Known Systems
As SDSS makes no attempt to screen out previously known sources in the selection for objects that will receive fibers, known CVs are observed as well as new systems. In 2002, the spectra of the known dwarf novae BC UMa (SDSS J1152) and KS UMa (SDSS J1020), as well at that of the 2dF source (SDSS J1422) = 2QZ J142256.3-022108 (Croom et al. 2001) were obtained. Information on all three sources is available from the on-line CV catalog of Downes (http://icarus.stsci.edu/downes/cvcat/). The detailed characteristics of SDSS J1324 as an unusual low accretion rate Polar have already been published by Szkody et al. (2003a).
The SDSS spectrum of KS UMa was obtained during an outburst so it shows a typical disk-dominated spectrum. A spectrum of KS UMa at quiescence is shown by Jiang et al. (2000). BC UMa shows the broad absorption features surrounding the emission that is indicative of the prominence of the white dwarf (as previously noted by Mukai et al. 1990). SDSS J1422, on the other hand, has prominent He II emission and is a likely candidate for a system containing a magnetic white dwarf.
3.2. High Inclination Systems
Generally, high inclination CVs have very prominent central absorption in the Balmer lines (giving a double-peaked appearance), with increasing absorption up the Balmer series. Figure 1 shows that SDSS J0904, 1501 and 1702, are good candidates for high inclination, eclipsing systems. Follow-up data on these 3 systems have confirmed that all 3 eclipse. SDSS J0904+03 shows a partial eclipse with a period of 86 min and will be discussed in detail in a separate paper (Woudt et al. 2004).

Photometry of SDSS J1501 (Figure 2) reveals deep (1.6 mag) eclipses with a period of 78 min. Note from Figure 2, that the 4 min sampling does not resolve the eclipses very well since they are of very short duration (15 min). The light curve is relatively flat between eclipses, indicating the lack of a prominent hot spot where the mass transfer stream impacts the disk.
| SDSS J | Line | |||||
|---|---|---|---|---|---|---|
| (hr) | (km s-1) | (km s-1) | (JD 2,452,000) | |||
| 0043 | H | 1.5 | 909.830 | 28 | ||
| 0043 | H | 1.2 | 909.783 | 27 | ||
| 0748 | H | 2.5 | 909.965 | 42 | ||
| 0748 | H | 2.5 | 909.958 | 85 | ||
| 0900 | H | 4.7 | 327.706 | 36 | ||
| 0900 | H | 5.3 | 327.707 | 39 | ||
| 0900 | H | 4.5 | 327.707 | 38 | ||
| 0932 | H | 1.7 | 278.752 | 61 | ||
| 0932 | H | 1.7 | 278.755 | 76 | ||
| 0932 | H | 1.6 | 278.755 | 83 | ||
| 1538 | H | 1.7 | 451.744 | 9 | ||
| 1538 | H | 1.5 | 451.743 | 24 | ||
| 1538 | H | 1.6 | 451.748 | 11 | ||
| 1702 | H | 2.5 | 451.855 | 23 | ||
| 1702 | H | 2.5 | 451.856 | 31 |

The light curve of SDSS J1702 (Figure 3) is particularly interesting. It shows deep (1.5 mag) eclipses with a period of 2.5 hrs, a secondary eclipse of 0.2 mag depth at phase 0.5, and a large (0.2 mag) hump preceding eclipse which is likely the hot spot coming into view. Using the double-Gaussian method on the emission line wings and fixing the period at 2.5 hrs gives the radial velocity solutions listed in Table 4. Figure 4 shows the best fits to the H and H lines. Note that the points near phase 0.9 (which are not included in the fit) show the usual large displacement to positive then to negative velocity that is typical for accretion disks undergoing an eclipse.

SDSS J1702 is an excellent candidate for further follow-up observations with a large telescope; better time-resolution for the light curve should be able to resolve the eclipse structure, which may show the white dwarf ingress and egress. The width of the eclipse combined with the radial velocity curve may provide an estimate of the white dwarf mass. In addition, Figure 1 shows that the M star is visible. Matching the 7050 TiO band to the spectral index defined by Reid, Hawley & Gizis (1995) for M stars yields a spectral type of M1.51.1. Then, using the absolute magnitude vs spectral type relations from Hawley et al. (2002) with the and magnitudes listed in Table 1 yields a distance of 610 pc from the magnitude, 580 pc from the magnitude, and 570 pc using the magnitude from the 2MASS database (=15.630.05). With the uncertainties in the spectral type, the total range of distances allowed is between 460-650 pc.
An attempt was made to determine the velocity of the M dwarf by using the IRAF routine to cross-correlate the red spectra against the one in eclipse, but the individual spectra were too noisy to derive a believable result. Time-resolved higher S/N data should be able to determine the velocity curve of the secondary, thus leading to a good determination of the mass ratio. SDSS J1702 is potentially very useful, as it is one of the very few double-lined, eclipsing CVs, from which masses can be found. A mass measurement for this system would be particularly interesting, as its period is squarely in the period gap (a region between 2-3 hrs that is rarely occupied by dwarf novae). SDSS J1702 can provide a good test of the evolution models of Howell, Nelson & Rappaport (2001), which make predictions for the masses above and below the gap.
3.3. Dwarf Novae

The SDSS spectrum of SDSS J0808 was obtained during a likely dwarf nova outburst and is similar to the SDSS outburst spectrum of KS UMa (SDSS J1020). Both the SDSS image and the Digitized Sky Survey (DSS) show SDSS J0808 as a fainter object than implied by the spectrum in Figure 1. An APO spectrum obtained on 2003 Nov 27 (Figure 5) shows the typical strong emission lines of a quiescent dwarf nova. It is likely that this object has fairly frequent oubursts, as follow-up photometry at USNO also caught SDSS J0808 during outburst (at =14.5). The outbursts are fairly long as an observation a week after the first one showed the system still at 14.7. The 9 hours of observation at that time (Figure 6) shows a modulation with amplitude of 0.04 mag on a timescale of 6 hrs superimposed on a declining brightness trend throughout the observation. However, since it is usually not possible to determine an orbital period from outburst photometry and a radial velocity curve is not yet available, futher data will be needed to determine if the 6 hr timescale is related to the orbital period of this system, or merely transient fluctuations in the mass accretion as the system returned to quiescence.

The SDSS spectrum of SDSS J2100 (Figure 1) also looks similar to an outbursting dwarf nova and the SDSS image and photometry (Table 1) is fainter as well. Optical photometry over several nights and during different accretion states revealed a large amplitude (0.2-0.5 mag) periodic modulation at 1.9 hrs (or a possible alias at 2.1 hrs); the detailed results are discussed in a separate paper (Tramposch et al. 2004).
SDSS J2232 was found in ouburst during the SDSS imaging (Table 1) while it was in quiescence during the SDSS spectrum (Figure 1). USNO photometry during quiescence on 2003 January 8 and 12 showed V=22.4, B=22.80.5 mag while an outburst (V=18.45) was caught on 2003 Oct 20 (Table 2). The time series during outburst did not reveal any modulation.
Lastly, SDSS J2102 has the appearance of a dwarf nova during outburst, but with exceptionally strong Balmer absorption. Additional spectra obtained at APO in 2003 December showed a similar appearance and the SDSS and DSS images show comparable brightness. Thus, it is more likely that this is a system with a prominent white dwarf. It is possible that this could be a detached system, although H is broader than a typical line caused by irradiation of the secondary by the white dwarf. Time-resolved spectroscopy can reveal if this is a long period, widely separated binary.
3.4. Nova-likes with Strong He II
Strong He II emission lines usually indicate either a magnetic white dwarf, where the EUV continuum from an accretion shock ionizes the plasma, or a novalike system with a high level of mass transfer, often a type of system termed an SW Sex star. These types are ultimately differentiated by polarimetry, although time-resolved photometry and spectroscopy can yield distinct clues. An object that has a large circular polarization and a strong modulation of the lines and continuum at the orbital period is classified as a spin-orbit synchronized AM Her system, or Polar (see review of Polars in Wickramasinghe & Ferrario 2000). One that has little or no polarization and is observed to have a periodicity at a spin timescale of the white dwarf (minutes), is considered an Intermediate Polar (IP), while one with an orbital period between 3-4 hrs and single-peaked emission lines is likely an SW Sex star (see Warner 1995 for a review of all types).
The systems SDSS J0748, 0932, 1422, and 1626 clearly show He II. Of these, SDSS J1422 (the 2dF source) and SDSS J1626 are the best candidates for Polars, as they have He II greater than H. Spectropolarimetry was accomplished for SDSS J0748 but no polarization was seen to a level of 0.04%, so a Polar nature is ruled out for this object. Spectroscopy suggests that the orbital period could be on the order of 2.5 hrs (Figure 7 and Table 4), but the dataset is only 2.6 hrs long so further spectroscopy is needed for a correct determination.
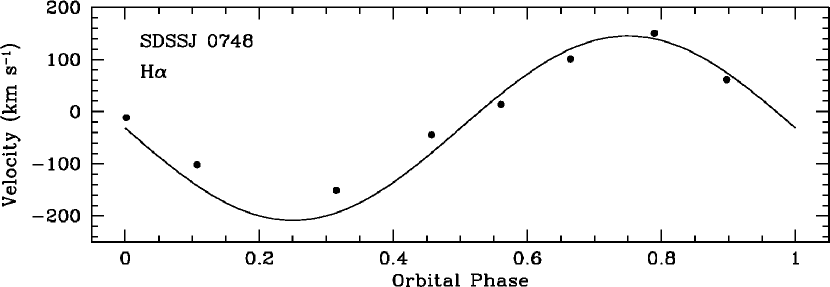
While He II emission was present in the APO spectra, the poor S/N due to high airmass at the time of observations prevented any determination of the velocities or period from the lines in the blue portion of the spectrum. Due to the proximity of a close companion on the sky, the photometry of this object was accomplished with an aperture that included both stars.

The light curve (Figure 8) shows no clear modulation at the 2.5 hr period. However, the (epoch folding) period search method available in IRAF reveals a prominent minimum at a period of 70 min. Since the light curve is only 4 hrs long, further photometric data is also needed to determine if this is merely active flickering or a stable period that could be identified with the spin of the white dwarf (which would indicate this system could be an IP).

SDSS J0932: This object was discovered as US 691 in the Usher survey of faint blue objects at high galactic latitude (Usher, Mattson & Warnock 1982). Its spectrum is very unusual in that it shows very strong doubled helium emission lines as well as the Balmer hydrogen lines. This doubling implies an origin in a disk. Neither Polars nor SW Sex stars show this behavior. The unusual strength and structure in the He lines in SDSS J0932 is reminiscent of the SDSS-discovered CV SDSS J102347.67+003841.2 (Bond et al. 2002; Szkody et al. 2003b). It is not clear why these 2 systems have such strong and doubled He lines in comparison to normal novalikes. While SDSS J1023 is a FIRST radio source, implying a magnetic nature, there is no radio source within 30 arcsec of SDSS J0932. However, observations have shown that these radio sources can be highly variable (P. Mason, 2004, private communication). Our radial velocity data (Figure 9 and Table 4) give a best fit to a sine curve suggesting a period near 1.7 hrs, but the overall errors are large for the brightness level of this system, so further data are definitely needed. It would be useful to obtain a longer set of time-resolved spectra with higher time resolution in order to construct tomograms that could help to locate the He II emission. Usually, this line is produced close to the white dwarf and provides the best velocity measurement value for the white dwarf. If the inner disk is disrupted, the line may originate further out in the disk (giving a doubled appearance), but must still be close enough to receive the excitation provided by high energy photons.
3.5. Systems Showing the Underlying Stars
Generally, the systems with the lowest mass transfer rates have accretion disks that are so tenuous that they contribute little light in comparison to the primary and secondary stars. In these systems, the broad Balmer absorption lines from the white dwarf are observed flanking the emission lines from the disk. TiO bands from the secondary star can also be present, as well as an upturn in the flux longward of 7000Å. In the SDSS spectra obtained during 2002, there are many more such systems present than in the previous 2 years of data. The 15 systems showing one or both of the underlying stars include SDSS J0043, 0900, 0904+03, 0904+44, 0951, 1152 (BC UMa), 1249, 1302, 1324, 1501, 1610, 1702, 1705, 1711 and 2232. Three of these systems are the eclipsing objects discussed in section 3.2, since a disk viewed edge-on (i.e. high inclination) is not as luminous as a disk seen face-on (Warner 1987). It is notable that several of the white dwarfs in the systems showing prominent absorption lines have been shown to be pulsating during follow-up studies conducted by Woudt & Warner (2004) and Warner & Woudt (2004).
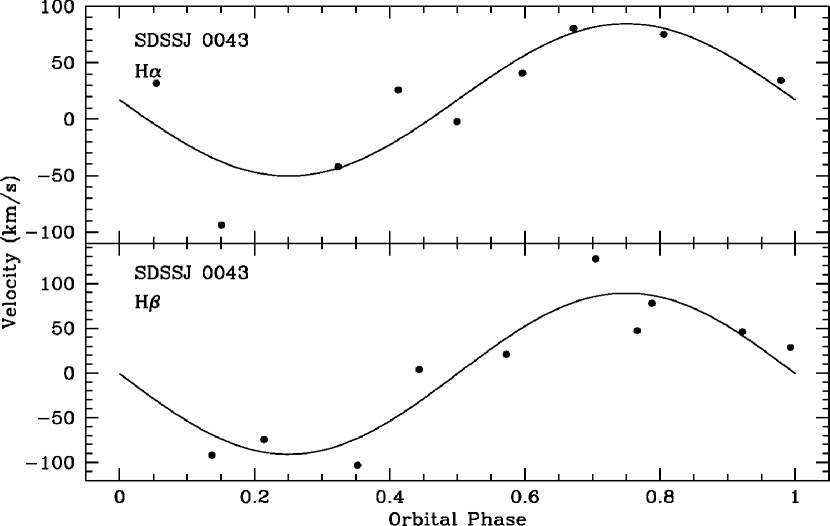
SDSS J0043: Using the emission lines of H and H, our 2.7 hrs of data suggest a period near 1.5 hrs from H and near 1.2 hrs from H (Table 4). Since H is a stronger line and is not affected by the surrounding absorption of the higher Balmer series, it represents the best solution, but a longer time series of observations is needed to accurately pin down the period. Figure 10 shows the best-fit radial velocity curves for both lines.

SDSS J0900: This object is unusual in that it shows a prominent M star but does not show any evidence for the white dwarf. Either the white dwarf is very cool, the M star is evolved, or the accretion rate is relatively high in this system so that it obscures the white dwarf. The light curve shows a modulation of 2.6 hrs (Figure 11), whereas the radial velocity solution (Table 4 and Figure 12) suggests the period is twice this value.

The most logical interpretation is that the light curve is showing the ellipsoidal variation due to the prominent secondary.
SDSS J1249: While this object is listed in the catalog of Kilkenny, Heber & Drilling (1988) as a hot sub-dwarf, the SDSS spectrum clearly shows the presence of an M star. The Balmer lines all have narrow, strong emission line cores. Thus, this system appears to have a hot star in close proximity to a highly irradiated M star. While there may not be mass transfer going on, this system may be a pre-CV or a system undergoing a time of low mass transfer.
SDSS J1302: This system’s spectrum resembles that of a symbiotic star (not strictly a CV), with a prominent M companion and very strong narrow emission lines with a recombination decrement. However, this object lacks the high excitation lines (e.g. He II) typical of symbiotics (see reviews of symbiotic stars by Corradi, Mikolajewska & Mahoney 2003).
3.6. Undetermined Objects
The object SDSS J1156 defies ready classification. While it has strong Balmer emission, the lines are very narrow for a CV and the continuum turns over in the blue. It also appears to have an emission line of He I 5876 that is unusually strong. Since this object is quite faint, it could be an accreting system in a low state, such as a Polar. Further observations will be needed to sort out its correct identification.
APO spectra suggest a period near 1.6 hr for SDSS J1538 (Table 4 and Figure 13).

The spectral appearance (Figure 1) and short period are typical for a normal dwarf nova. Long term photometric monitoring can reveal if this system shows typical dwarf nova outbursts and monitoring during an outburst can reveal if it shows the superhump phenomena typical of those systems with periods less than 2 hrs (SU UMa systems).
3.7. ROSAT Correlations
| SDSS J | ROSAT | Exp | 1RXS J |
|---|---|---|---|
| (counts s-1)aaFor a 2 keV bremsstrahlung spectrum, 1 c/s corresponds to a 0.1-2.4 keV flux of about 7 ergs cm-2 s-1 | (s) | ||
| 0943 | 544 | 094327.7+520139 | |
| 1020 | 560 | 102027.1+530439 = KS UMa | |
| 1132 | 576 | 113213.3+624903 | |
| 1244 | 533 | 124424.5+613511 | |
| 1538 | 735 | 153818.5+512348 |
Matching the coordinates of the CVs in Table 1 with the X-ray ROSAT All Sky Survey (RASS; Voges et al. 1999, 2000) reveals that 5 have X-ray detections (2.5) within the positional errors of the RASS. Table 5 presents the X-ray count rates for the 5 sources. The previously known dwarf nova KS UMa is included in this list. The low flux levels are typical for faint CVs with accretion disks. Surprisingly, none of the candidates for magnetic systems, which usually have larger X-ray fluxes than disk systems, appear in this list.
4. Conclusions
The 36 CVs described here, combined with the 64 from Papers I and II provide substantial additions to the database of low luminosity, short orbital period CVs that are postulated to comprise the true population of CVs (Howell, Nelson & Rappaport 2001). While the overall detection rate (0.03/square degree) is comparable to that in Papers I and II, this latest set of CVs has fewer magnetic candidates (4) but many more systems (15) showing the underlying stars than in the past papers. Of the 12 systems with periods estimated (listed in Table 1), 8 are less than 2 hrs, 3 are in the period gap between 2-3 hrs and only one is above 3 hrs. If the period estimates are confirmed and are representative of the rest of the group, the proportion of systems with short periods in the SDSS data will be larger than that from brighter surveys such as the Palomar-Green (Green et al. 1982; online Downes CV catalog gives periods) or the recent Hamburg Quasar Survey (Gänsicke, Hagen & Engels 2002). This would be consistent with the population models that predict most CVs should have evolved to short orbital periods and low mass transfer rates.
This sample highlights several interesting candidates for further study. Of the 3 eclipsing systems found, SDSS J1702 is especially important in that the secondary M1.5 star is evident so that the masses may be determined with a large telescope. Further photometry of SDSS J0748 is needed to determine if it could be an IP. The exact nature of systems such as SDSS J1156, 1335 and 2102 remain to be explored. In addition, fitting of the underlying stars in the 15 systems that show them can reveal the temperatures and distances of this sample, yielding some estimate of age and heating effects from the ongoing accretion.
References
- (1)
- (2) Abazajian, K. et al. 2003, AJ, 126, 2081 (DR1)
- (3)
- (4) Abazajian, K. et al. 2004, AJ, in press (DR2)
- (5)
- (6) Bond, H. E., White, R. L., Becker, R. H. & O’Brien, M. S. 2002, PASP, 114, 1359
- (7)
- (8) Corradi, R. L. M., Mikolajewska, J. & Mahoney, T. J. 2003, in ASP Conf. Ser. 303, Symbiotic Stars Probing Stellar Evolution, ed. R. L. M. Corradi, J. Mikolajewska & T. J. Mahoney
- (9)
- (10) Croom, S. M., Smith, R. J., Boyle, B. J., Shanks, T., Loaring, N. S., Miller, L. & Lewis, I. J. 2001, MNRAS, 322, L29
- (11)
- (12) Fukugita, M., Ichikawa, T., Gunn, J. E., Doi, M., Shimasaku, K. & Schneider, D. P. 1996, AJ, 111, 1748
- (13)
- (14) Gänsicke, B. T., Hagen, H.-J. & Engels, D. 2002, in ASP Conf. Ser. 261, The Physics of Cataclysmic Variables and Related Objects, ed. B. T. Gänsicke, K. Beuermann & K. Reinsch, 190
- (15)
- (16) Green, R. F., Ferguson, D. H., Liebert, J. & Schmidt, M. 1982, PASP, 94, 560
- (17)
- (18) Gunn, J. E. et al. 1998, AJ, 116, 3040
- (19)
- (20) Hawley, S. L. et al. 2002, AJ, 123, 3409
- (21)
- (22) Hogg, D. W., Finkbeiner, D. P., Schlegel, D. J. & Gunn, J. E. 2001, AJ, 122, 2129
- (23)
- (24) Howell, S. B., Nelson, & Rappaport, S. 2001, ApJ, 550, 897
- (25)
- (26) Jiang, X. J., Engels, D., Wei, J. Y., Tesch, F. & Hu, J. Y. 2000, A&A, 362, 263
- (27)
- (28) Kilkenny, D., Heber, U. & Drilling, J. S. 1988, SAAOC, 12, 1
- (29)
- (30) Lupton, R. H., Gunn, J. E. & Szalay, A. 1999, AJ, 118, 1406
- (31)
- (32) Lupton, R. H., Gunn, J. E., Ivezic, Z., Knapp, G. R., Kent, S. M. & Yasuda, N. 2001, ASP Conf. Ser. 238, p. 269
- (33)
- (34) Mukai, K. et al. 1990, MNRAS, 245, 385
- (35)
- (36) Pier, J. R., Munn, J. A., Hindsley, R. B., Hennessy, G. S., Kent, S. M., Lupton, R. H., & Ivezic, Z. 2003, AJ, 125, 1559
- (37)
- (38) Reid, I. N., Hawley, S. L. & Gizis, J. E. 1995, AJ, 110, 1838
- (39)
- (40) Shafter, A. W. 1983, ApJ, 267, 222
- (41)
- (42) Smith, J. A. et al. 2002, AJ, 123, 485
- (43)
- (44) Stoughton, C. et al. 2002, AJ, 123, 485
- (45)
- (46) Szkody, P. et al. 2002, AJ, 123, 430 (Paper I)
- (47)
- (48) Szkody, P. et al. 2003a, ApJ, 583, 902
- (49)
- (50) Szkody, P. et al. 2003b, AJ, 126, 1499 (Paper II)
- (51)
- (52) Tramposch, J. et al. 2004, in preparation
- (53)
- (54) Usher, P. D., Mattson, D. & Warnock, A. 1982, ApJS, 48, 51
- (55)
- (56) Voges, W. et al. 1999, A&A, 349, 389
- (57)
- (58) Voges, W. et al. 2000, IAU Circ., No. 7432
- (59)
- (60) Warner, B. 1987, MNRAS, 227, 23
- (61)
- (62) Warner, B. 1995, in Cataclysmic Variable Stars, CUP
- (63)
- (64) Warner, B. & Woudt, P. 2004, MNRAS, in press
- (65)
- (66) Wickramasinghe, D. T. & Ferrario, L. 2000, PASP, 112, 873
- (67)
- (68) Woudt, P. & Warner, B. 2004, in Variable Stars in the Local Group, eds. D. Kurtz & K. Pollard, in press
- (69)
- (70) Woudt, P. et al. 2004, in preparation
- (71)
- (72) York, D. G. et al. 2000, AJ, 120, 1579