The abundance of 36S in IRC+10216 and its production in the Galaxy
The and rotational lines of the rare
isotopomer C36S and the and transitions of Si36S were detected in the carbon
star IRC+10216 (CW Leo). These are the first detections of 36S bearing molecules in a star and the first spectroscopic
detection of Si36S. From a comparison of 34S and 36S bearing
isotopomers, the
34S/36S isotopic ratio is 107(). This value is comparable to values
in the interstellar medium of the inner Galactic disk (115)
but is smaller than the solar value of 288 (Ding et al. ding2001 (2001)). The increase of the
36S abundance relative to 34S only qualitatively follows
model predictions of a low mass AGB star. Quantitative agreement of the observed 34S/36S ratio
with the stellar models can be reached if the age of IRC+10216 and Galactic chemical evolution are taken into
account. Other less likely possibilities are the presence of
considerable inhomogeneities
in the interstellar medium and either
IRC+10216 or the Sun started with a peculiar 36S abundance. Other production mechanisms potentially
capable of enhancing the Galactic interstellar medium are
discussed. From the observed line density toward IRC+10216 and toward Galactic star forming regions,
we estimate the confusion limit toward those sources.
Key Words.:
nuclear reactions, nucleosynthesis, abundances – stars: abundances – stars: AGB and post-AGB-stars: individual: IRC+10216 – ISM: abundances – radiolines: stars1 Introduction
Heavy elements are formed in stars of medium or high mass. At the end of their lifetimes, these stars recycle, via winds or via explosions, a fraction of these metals back into the interstellar medium (ISM). Over the aeons, interstellar abundances of such heavy elements have been increasing and isotopic compositions have been changing, as can be seen by comparing the composition of the present day ISM with that of Damped Lyman- systems (Rauch rauch98 (1998)). Not only elemental but also isotopic abundances, which are mainly determined in the radio range, are powerful tools to investigate stellar production sites and the star forming history of galaxies (Wilson & Matteucci wilson92 (1992); Henkel & Mauersberger henkel93 (1993); Henkel et al. henkel94 (1994); Wilson & Rood wilson94 (1994); Kahane kahane95 (1995); Prantzos et al. prantzos96 (1996); Bieging bieging97 (1997); Henkel et al. henkel98 (1998)).
Being one of the ten most abundant elements and possessing four stable isotopes, sulfur is of particular interest for such studies. Relative abundances of stable sulfur isotopes have been determined for meteorites (e.g. Gao & Thiemens gao1991 (1991)), the Moon (Thode & Rees thode71 (1971)), the Galactic ISM (e.g. Chin et al. chin96 (1996)), Cosmic Rays (Thayer thayer97 (1997)) and late type stars (e.g. Kahane et al. kahane88 (1988)). Even in external galaxies 32S/34S ratios could be measured (Mauersberger & Henkel mauersberger89 (1989); Johansson et al. johansson94 (1994)). Small isotopic variations of sulfur in terrestrial, meteoric and planetary samples have been proposed to be powerful indicators of chemical, geophysical and biological processes (Canfield Canfield01 (2001); Farquhar & Wing farquhar2003 (2003))
Mauersberger et al. (mauersberger96 (1996)) presented the first interstellar detections of a 36S bearing molecule toward a number of Galactic hot cores. While the solar 34S/36S ratio is 288, an interstellar ratio of 115() was found. This supported the notion that unlike other S isotopes, 36S is a secondary-like nucleus, predominantly synthesized via the s-process in massive stars. Most interstellar 34S/36S ratios were determined, however, for sources with galactocentric distances kpc. A positive 34S/36S gradient with increasing , i.e. a ratio between 115 and in the solar neighborhood, is not completely ruled out by the data of Mauersberger et al. (mauersberger96 (1996)).
In order to further constrain the production site of 36S in the Galaxy, we conducted a search for rotational lines of C36S and Si36S toward the prototypical carbon star IRC+10216, where all other stable S isotopes have been detected previously (Kahane et al. kahane88 (1988)).

2 Line frequencies
The rest frequencies of the C36S and lines are 95.0167 and 142.5228 GHz (V. Ahrens, pers. comm.), and 96.4130 and 144.6171 GHz for the corresponding C34S lines (Lovas Lovas92 (1992)).
The frequencies of Si36S have not been measured in the laboratory. However, it is straightforward to derive the rotational constants of Si36S from those of SiS (see, e.g., Frum et al. Frum (1990)) using the isotopic relation for diatomic molecules (e.g. Townes & Schawlow townesandschawlow (1975)). For Si36S, we derived =8607.47 MHz and =5.4 10-3 MHz. The computed frequencies are =86071.984 MHz and =103284.96 MHz. The expected relative error for the rotational constants is and the resulting expected uncertainty for the and lines of Si36S is MHz. We have checked the precision of those relations for the different isotopes of SiS that have been measured in the laboratory and we find that the quoted uncertainties are rather conservative. Recently, Sanz et al. (Sanz (2003)) measured the rotational constants of several isotopes of SiS and have provided a fit, taking into account the breakdown of the Born-Oppenheimer approximation, to the data of all isotopes of SiS. From their constants we infer those of Si36S to be =8607.495 MHz, =5.364 10-3 MHz, = 86072.27 MHz and =103285.31 MHz, i.e, 0.3 MHz of difference with respect to our early calculations. Hence, we are confident that the calculated frequencies have an error well below 1 MHz.
3 Observations
The and lines of C34S and C36S were observed between October 1999 and September 2003 with the IRAM 30 m radiotelescope on Pico Veleta (Southern Spain) toward IRC+10216. The Si36S observations were carried out between 1996 and 2003 at the same telescope. Several spectra at different frequency settings were observed for each line of Si36S to ensure that the observed lines are coming from the signal side band. The observations were conducted under good weather conditions. SIS receivers were used with image sideband rejections of 20—25 dB. An antenna temperature () scale was established by a chopper wheel method. The forward efficiency of the telescope was 0.94 and the beam efficiencies were 0.80 at 3 mm and 0.65 at 2 mm. The beamwidth (full width at half maximum) of the 30 m antenna was 26′′ and 17′′ for the and transitions of the isotopomers of CS; for the and transitions of SiS, beamwidths were 28′′ and 24′′. From scans of continuum sources, we estimate the pointing to be correct within 5′′.
As backends, we employed filterbanks with 256 channels and a channel spacing of 1 MHz corresponding to for the 3 mm transitions and 2.1 km s-1 for the 2 mm transitions. Two receivers were employed simultaneously, either observing orthogonal polarizations at the same wavelength or measuring one line at 2 mm and the other at 3 mm using just one polarization for each wavelength.
All spectral lines were measured using the wobbling secondary mirror with a beam throw of 200′′ in azimuth. The phase time was 2 seconds and the on-source integration of each subscan was 30 seconds. Subscans obtained by wobbling to the left and to the right of our source were added to eliminate baseline ripples caused by the asymmetry in the beam path (symmetric switching).
4 Results
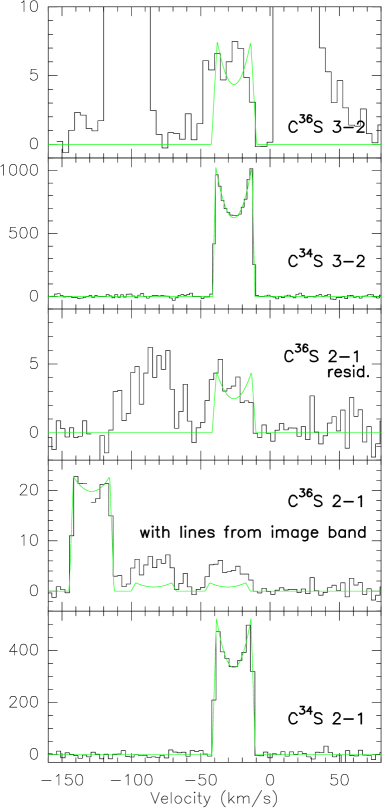
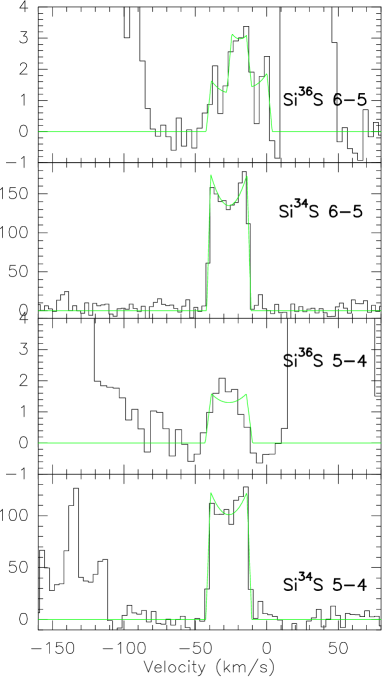
Fig. 1 displays the entire spectral range measured at the frequencies of the C36S lines. Figs. 2 and 3 show the C34S, C36S, Si34S and Si36S spectra that are discussed in Sect. 5.2 in more detail. An inspection of Fig. 1 shows that a main source of uncertainty in the identification of weak lines and also in the definition of spectral baselines comes from the presence of many weak line features, in particular at 2 mm. In Appendix A, we list the line parameters of all features together with possible identifications. The Si36S data, showing a statistical behavior that is similar to the C36S data, will be analyzed elsewhere (Cernicharo et al., in prep.).

From the spectra, we subtracted baselines of first order. For the line of C36S, almost the entire frequency range is covered with line features near or above the detection threshold making the identification of a region free of emission a difficult task. We chose spectral regions with particularly low emission for the definition of a baseline.
| Transition | a | |||
| mK km s-1 | km s-1 | km s-1 | ||
| CS | ||||
| C34S | 11600(100) | 26.2 | 14.0 | 0.55 |
| C36S | 96(21) | 26.2b | 14.0b | 0.55b |
| C36S/C34S | 8.3(1.8) 10-3 d | |||
| CS | ||||
| C34S | 22190(93) | 26.0 | 14.5 | 0.64 |
| C36S | 170(81) | 26.0b | 14.5b | 0.64b |
| C36S/C34S | 7.7(3.7) 10-3 d | |||
| SiS | ||||
| Si34S | 3180(80) | 26.4 | 14.4 | 0.82 |
| Si36S | 41(9) | 26.4b | 14.4b | 0.82b |
| Si36S/Si34S | 12.9(2.8) 10-3 d | |||
| SiS | ||||
| Si34S | 4280(70) | 14.1 | 0.76 | |
| Si36Sc | 40(18) | 26.5b | 14.1b | 0.76b |
| Si36S/Si34S | 9.3(4.2) 10-3 d | |||
a) the ratio between the intensities at the central velocity of the line and at the velocity of the horns (i.e. maximum blue or red shifted emission); b) fixed to values obtained for the C34S or Si34S lines; c) simultaneous fit with a blended, unidentified line at GHz and an intensity of 46(18) K km s-1; d) from the integrated intensities yielded by the fits to the lines of 34S and 36S bearing species. The error given is the 1 error from the fit and does not contain an estimate of systematic errors, e.g. due to baseline uncertainties.
5 Discussion
5.1 Where is the confusion limit toward IRC+10216?
As it can be seen in Fig. 1 showing the total spectral range of 2256 MHz toward IRC+10216, we have detected a large number of spectral line features, many of them unidentified. There are more lines at 2 mm than at 3 mm although the rms of the data is similar. The spectral line density in our 2 mm spectrum is 15 lines per 256 MHz. Since each line has a width of about 14.5 MHz, about 85% of the spectral range observed would be covered with detectable line emission if there were no overlap. The weakest feature we identified in Table 3 at =2 mm has =3.5 mK, although the rms noise of our 2 mm spectrum is about 0.5 mK for 4 km s-1 wide velocity channels. Apparently lines weaker than about 3.5 mK have escaped detection not because of lacking signal-to-noise but because their number is so high that they are all blended and therefore cannot be easily distinguished.
At mm, 6 lines have been detected from the signal band in a 256 MHz wide range. Since each line has a width of 9 MHz, 21% of the spectral range observed is covered by detected lines. The weakest of those have a of about 1.5 mK, which corresponds to the 3 noise level at a velocity resolution of 10 km s-1. In contrast to the situation at 2 mm, we have not yet reached the 3 mm confusion limit. Nevertheless, at 3 mm we also see signs of weak blended lines at a level of 1 mK. Weaker lines, on the order of 0.5 mK, have been identified recently (Cernicharo et al. cerni2004 (2004)) making use of the characteristic line shapes of IRC+10216.
To summarize, at the IRAM 30-m telescope the confusion limit toward IRC+10216 is reached at =2 mm after integrating down to a system noise of about 1 mK, while at 3 mm one has to integrate down to 0.3 mK. For other well known molecular sources, confusion limits are given in Appendix B.
5.2 The identification of C36S and Si36S
As already mentioned in Sect. 4 there are emission features at the rest frequencies of both the and the lines of C36S. These clearly peak above the limits of line confusion. It turns out, however, that at 3 mm there are two emission lines of linear C3H from the image sideband, one of which coincides with the location of the expected C36S feature. Also in the band is the image of the strong CS line. From a well calibrated spectrum of these three lines (Mauersberger et al. mauetal89 (1989)) we obtained their relative intensities. According to Cernicharo et al. (cerni2000 (2000)) there is no hint for variability in time, except for some very highly excited lines or maser lines. In our spectrum of C36S (Fig. 2) we could therefore apply a fit to the CS line and the two C3H lines from the image band fixing the line shape and the relative intensities. When removing this composite fit from the spectrum, the residual still shows emission at the expected frequency of C36S (Fig. 2). This residual spectrum was used to determine the isotopic ratios given below.
We cannot exclude that the residual line is contaminated since a fit with fixed line shape and rest frequency to the line feature (to the values obtained for C34S) shows some excess emission toward lower velocities. A possible contaminant of the line of C36S is a series of lines of the transition of CH3CCCN (methyl cyanoacetylene; Lovas Lovas84 (1984)), which were detected toward a number of Galactic hot cores (Mauersberger et al. mauersberger96 (1996)). This is, however, unlikely, since this molecule is not yet identified toward IRC+10216 (e.g. Cernicharo et al. cerni2000 (2000)).
We have used the procedure from the CLASS data reduction package to fit shell type circumstellar lines. In order to obtain more reliable values for the integrated intensities, we fixed some of the line parameters of 36S bearing species to the values obtained from the more intense 34S bearing isotopomers. Fit results are given in Table 1. In the fit to the C36S line feature there is a hint for excess emission toward lower velocities. At that frequency, the only previously observed interstellar line in the Lovas (Lovas84 (1984)) catalog is a transition of CH2CHCN (vinyl cyanide, GHz). This complex molecule has never been detected before in IRC+10216 and the line strength is very low. It seems plausible that if there is contamination it comes from a transition of a molecule abundant in late type carbon stars but not in the ISM, such as C7H and/or H2C6 (Guélin et al. guelin 97 (1997)).
The Si36S line can be well fitted, with the determination of the baseline being the major source of uncertainty. The Si36S line is also clearly detected, although it seems to be blended with a weak, unidentified feature (Fig. 3). The parameters of the C34S, C36S, Si34S, and Si36S, lines and the derived C34S/C36S and Si34S/Si36S intensity ratios are given in Table 1. We can summarize that we have clearly detected C36S and Si36S in IRC+10216. These are the first detections of 36S bearing molecules in a stellar atmosphere and the first detection of Si36S outside the solar system.
5.3 The 34S/36S abundance ratio
The characteristic line profiles of spherically expanding molecular shells can be explained in terms of line opacity, expansion velocity and the relative sizes of the telescope beam and the stellar envelope (e.g. Kuiper et al. kuiper76 (1976); Olofsson et al. olofsson82 (1982)). The slightly U-shaped profiles seen in C34S and Si34S can be explained by optically thin and spatially resolved emission. Optically thin lines are expected because the main isotopic lines are only moderately optically thick and because 34S is a factor less abundant than the main isotope (Kahane et al. kahane88 (1988); Cernicharo et al. cerni2000 (2000)). Interferometric observations (Guélin et al. guelin93 (1993); Lucas et al. lucas95 (1995), for maps see Grewing grewing94 (1994)) confirm a compact condensation of about 10′′ diameter for main isotopic CS. SiS is even more compact (Lucas et al. lucas95 (1995)), which is also apparent by a comparison of C34S and Si34S line shapes (Figs. 2 and 3). It is safe to assume that also C36S and Si36S emission is optically thin and it is plausible that the distributions of 34S and 36S bearing isotopomers are similar. Chemical fractionation, as discussed in Chin et al. (chin96 (1996)), should be negligible in the warm (50 K, Cernicharo et al. cerni2000 (2000)) environment of the inner shell of IRC+10216. Since the isotopomers have very similar transition frequencies we can assume that the intensity ratios of corresponding transitions reflect the abundance ratios (for a discussion, see Kahane et al. kahane88 (1988)).
From Table 1 it is evident that the relative errors of the integrated line intensities of the 36S bearing molecules are of the order of 20% or more, while the relative errors for the 34S bearing species are much smaller. While it is relatively straightforward to determine the X36S/X34S ratios from fitted line profiles (as summarized in Table 1), it is much more difficult to estimate the X34S/X36S ratios since the simple rules for error propagation apply only if the relative errors are small. In addition, if we assume that the error distribution of the X36S/X34S ratios is Gaussian, the distribution of the inverse ratio is not such a simple and symmetric function, making the determination of the variance difficult (see Chapter 3.3.3 in Wall & Jenkins wall03 (2003)).
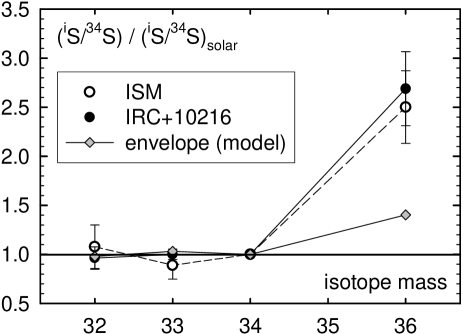
The errors as quoted have been calculated from the formal errors of the fits to the line profiles. From these four ratios, and using as weights the inverse squares of the formal errors of the individual ratios, we have determined the weighted mean of the 36S/34S abundance ratio and its error to be 0.0094() (see e.g. Bevington & Robinson bevington92 (1992)). From a graphical representation of the individual values and their mean (see Fig. 5) the only transition whose abundance ratio deviates from the mean value is the SiS line. This might be an additional hint that for this line there is, in addition to the statistic uncertainty, also a systematic effect, for example a blend with an unidentified line (see the discussion above). Since the relative error of the average 36S/34S abundance ratio is only 14%, the expectation value of the 34S/36S ratio and its error can be easily determined. In the following we will use a 34S/36S ratio of 107() for IRC+10216 to ease a comparison with values published in the literature.
5.4 The origin of 36S
| Ratio | solar | ISM | C.R. | IRC+10216 |
|---|---|---|---|---|
| system | ||||
| 32S/34S | 22.64(0.00) | 24.4(5)b | 16(5,+11) | 21.8(2.6) |
| 32S/33S | 126.95(0.05) | 150 | 38(18,+500) | 121(15) |
| 32S/36S | 6519(20) | 3280(760) | 2700(600) | |
| 34S/33S | 5.606(0.002) | 6.3(1) | 5.6(.3) | |
| 34S/36S | 288(1) | 115(17) | 107(15) |
a) References: solar system data: Canyon Diablo troilite (CDT),
Ding et al. ding2001 (2001); ISM data: Chin et al.
(chin96 (1996)), Mauersberger et al. (mauersberger96 (1996)), most
ISM data are from the inner Galaxy; Cosmic Rays: these are
“source abundances”, Thayer (thayer97 (1997)); IRC+10216: Kahane
et al. (Kahane00 (2000)), this paper.
b) the average value for
sources at various galactocentric radii; the data by Chin et al.
(chin96 (1996)) indicate a possible galactocentric
32S/34S abundance gradient, which would correspond to a
value of 32() at the solar circle.
5.4.1 Solar abundance and nucleosynthesis of 36S
36S is one of the more enigmatic stable nuclei in nature. Partly because of its rarity (solar system isotopic abundance 0.015% relative to 32S), and partly because it is rarely employed in mass spectrometric studies of sulfur isotopes, up to very recently even its solar system abundance was quite uncertain. The often used Anders & Grevesse (andersandgrevesse89 (1989)) abundance table lists the S isotopes with a 34S/36S ratio of 211 (no errors given). An updated value is recommended in the 1998 compilation of isotopic abundances of the International Union of Pure and Applied Chemistry, (Rosman & Taylor rosman1998 (1998)), where a ratio 34S/36S = 248 is listed as the “best measurement from a single terrestrial source”; this composition has also been used by Lodders (lodders03 (2003)) for her Solar System abundance table. Sulfur isotope ratios measured in the laboratory are commonly reported as permill deviations from the Canyon Diablo Troilite (V-CDT) standard, which has an S isotopic composition fairly representative for Solar system materials (IUPAC 2003 compilation; de Laeter et al., delaeter03 (2003)). Its composition has recently been precisely redetermined, with a 34S/36S ratio of 288 (Ding et al., ding2001 (2001)). Another modification with respect to Anders & Grevesse (andersandgrevesse89 (1989)) comes from a lower sulfur elemental abundance by a factor 0.86, as first deduced by Palme & Beer (palme93 (1993)) and quoted in Lodders (lodders03 (2003)) for the solar system. All in all, the solar abundance of 36S is lower than the commonly used Anders & Grevesse (andersandgrevesse89 (1989)) value by a factor 1.6.
The former uncertainty on this isotope extends to its nucleosynthetic origin. The synthesis of the major isotopes of sulfur, similar as for other elements between Si and Fe, can mostly be assigned to charged particle reactions during hydrostatic and explosive burning stages in massive stars: 32S and 34S to hydrostatic and explosive oxygen burning, 33S to explosive oxygen and neon burning (Chin et al. 1996; Woosley et al. 2002). For some exceptionally rare neutron-rich isotopes in this mass range including 36S, however, the situation may be different. 36S has a closed neutron shell, hence a small neutron capture cross section, and in an s-process it could, in principle, act as a bottleneck building up a significant abundance relative to neighboring nuclides. For this reason, the weak s-process taking place during core He burning and convective shell C (Ne) burning in massive stars has been suggested as a major source of the 36S abundance in the Solar System (Schatz et al. schatz95 (1995); Woosley et al. woosley02 (2002)), and according to first network calculations by Schatz et al. (schatz95 (1995)) it seemed to be able to fulfill that role. However, re-assessment by Reifarth et al. (reifarth2000 (2000)) with updated nuclear input data indicates a more complex situation. The unexpectedly low neutron capture cross section of 34S causes this nuclide to restrict the flow towards 36S. With rare 35Cl being the main seed nucleus rather than abundant 28Si and 32S, the weak s-process, while actually making 36S, falls short by more than an order of magnitude in quantity in their assessment. Here, a further complication arises because in all recent calculations the abundance of the major seed, 35Cl, which in the s-process zone is given by its original abundance, has been taken from Table 3 of Anders and Grevesse (andersandgrevesse89 (1989)). Actually, there is disagreement for Cl between the nuclide abundances in their Table 3 and the 39% higher elemental abundance given in their Table 1; the latter agrees with other previous and more recent compilations. The predicted 35Cl/37Cl ratio is not affected by these changes, but there is a significant effect on the 36S overproduction factor, which is increased by a factor of 1.4.
According to current models, in massive stars most 36S is produced in a large mass zone where convective shell C-burning operates in hydrostatic conditions before the SN II explosion (Woosley & Weaver woosley1995 (1995)). Owing to the high neutron density in the first phase of carbon consumption (Raiteri et al. raiteri92 (1992)), more 36S is fed through the neutron channel of the unstable 35S than would be inferred by the occurence of the classical weak s-process. The nucleosynthesis yields of the most recent massive star calculations, made with solar initial composition and with a full network included (Woosley et al. woosley02 (2002); Rauscher et al. rauscher02 (2002); Limongi & Chieffi Limongi03 (2003)), are all based on the Bao et al. (bao2000 (2000)) compilation of neutron capture cross sections (where the new and much lower cross section for 34S is included). These results show a production factor of 36S that is typically low by a factor of 2 with respect to the mean of the most abundant nuclides. Taken at face value, this factor of 2 may be reconciled using the new solar 36S abundance as well as the correct 35Cl abundance. However, this does not completely solve the problem of the reproduction of solar 36S, since one would expect the weak s-process products to decline with decreasing metallicity, i.e. earlier generations of massive stars to have been less effective producers of 36S. In addition, there are uncertainties related to the nuclear input data. In particular, the rate of the major channel 36Cl(n,p)36S may be subject to further refinements in the future owing to the much better energy resolution obtained in the new measurements of Wagemans et al. (wagemans (2003)). On the other hand, recent investigations of n-induced reactions on 37Ar and 39Ar (Goeminne et al. Goeminne2000 (2000), goeminne2002 (2002)) seem not to affect the 36S production in a significant manner.
A complementary, though probably less important, source to the weak s-process is the main s-process taking place in the He burning shell of low mass AGB stars. According to calculations partially published in Travaglio et al. (travaglio04 (2004)), the Galactic contribution to 36S at the epoch of Solar System formation by all previous generations of AGB stars is about 4%; this may reach 10% once the revised lower 36S and higher 35Cl solar abundances are taken into account.
5.4.2 Stellar mass of IRC+10216
In Fig. 5 we show the S isotopic data for IRC+10216 (from this work and Kahane et al. Kahane00 (2000)) normalized to 34S and solar system ratios. The data clearly show a more than a factor of 2 enhancement of 36S/34S in IRC+10216 while the other ratios are solar within error. An s-process enhancement of 37Cl in IRC+10216 was found by Kahane et al. (Kahane00 (2000)). These authors were able to match the observation with the predictions of a low mass (1.5 M AGB star model of solar metallicity. The enhancement predicted for the envelope after the 15th thermal pulse just corresponded to the observed Cl isotope ratio. Re-analysis, using the updated solar abundances, confirms the agreement, which persists for the last three thermal pulses with dredge-up (#15 to #17). Included in Fig. 5 are the corresponding predictions for the sulfur isotopes (assuming, as in the case of Cl, the updated solar starting composition). It is obvious in Fig. 5 that qualitatively there is agreement between model and observations in that in IRC+10216 an enhancement of only 36S/34S is seen. However, our observed enhancement of 170% in this ratio is more than a factor of 4 higher than even the new prediction, which already is about twice as high (40 % instead of 20 %) than that in Kahane et al. (Kahane00 (2000)).
It has been argued in the past that the central star of IRC+10216 might correspond to an AGB star of intermediate mass, of around 5 M⊙, instead of the low mass model discussed here. This possibility was at the upper limit of the range of uncertainty of the available distance estimates of 110 — 170 pc (Winters et al. winters94 (1994); Crosas & Menten Crosas97 (1997); Le Bertre lebertre97 (1997); Groenewegen et al. groenewegen98 (1998); Weigelt et al. weigelt98 (1998)). An intermediate mass was inferred by Guélin et al. (guelin95 (1995)) on the basis of older estimates of some isotope ratios (see the discussion in Kahane et al. Kahane00 (2000)). We have computed a series of AGB models of different initial mass using updated network of neutron capture cross sections and solar abundances. These confirm the conclusions already reached by Kahane et al. (Kahane00 (2000)) that an intermediate mass of 5 M⊙ is excluded by the almost solar Mg isotope ratios observed. Indeed, in intermediate mass stars the 22Ne(,n)25Mg and 22Ne(,)26Mg reactions would be more efficiently activated by the higher temperature in the convective He flashes, providing a clear excess of both neutron-rich Mg isotopes. Supporting evidence derives from the observed 37Cl/35Cl ratio, which would be much higher in an intermediate mass star. The resulting 34S/36S ratio, in any case, does not depend much on the initial mass.
While the enhancement of the observed 36S/34S ratio with respect to the 1.5 M⊙ models could, in principle, be due to some unrecognized problems with the AGB models or assumptions on nuclear parameters involved with it, we believe this to be highly unlikely and the main s-process in IRC+10216 to be not the main source of its (relative to solar) enhanced 36S/34S ratio. Alternative explanations are briefly discussed below.
5.4.3 Chemical evolution
One clue may be the close agreement between the value for IRC+10216 and the one reported for the ISM (also shown in Fig. 5) by Mauersberger et al. (mauersberger96 (1996)), which at first glance is puzzling. A possible solution may be afforded by Galactic chemical evolution (GCE) and the different times when IRC+10216 and the Solar System formed, i.e. assuming a starting composition different from solar. Based mostly on the 12C/13C ratio and limits to C/O, Kahane et al. (Kahane00 (2000)) derived an upper limit of 2 M⊙ for IRC+10216, which nevertheless still allows the object to be as young as 1.5 Ga. Assuming a correspondingly evolved starting composition, observations might then be compatible (within errors) with model predictions. Indeed, first, there is no need for a large intrinsic contribution to 36S from IRC+10216 (in agreement with the relatively small effect predicted by the AGB star model; Fig. 5). And second, the large difference between the current ISM (and IRC+10216) and the Solar System, is compatible with massive star model predictions, where the 36S Galactic contribution increases with metallicity (as already pointed out by Mauersberger et al., mauersberger96 (1996)). This would require a rather different evolution of the Cl and S isotopic ratios during the last few Ga, since the observed 35Cl/37Cl ratio in IRC+10216 is matched by AGB model predictions using solar as the starting composition. Indeed, both Cl isotopes are thought to be synthesized in massive stars in a primary way during explosive Ne and O burning (Weaver & Woosley 1995). Only 4% of the solar abundance of 37Cl is contributed by the main s-component in low mass AGB stars, while 35Cl gets actually depleted by neutron captures, according to the GCE calculations by Travaglio et al. (travaglio04 (2004)). On the observational side, 35Cl/37Cl in Orion has been found to be enhanced relative to solar (Salez et al., salez96 (1996)), but the errors are too large to reach a firm conclusion.
A further possibility is that IRC+10216 simply started with a 36S abundance that was unusually high for its time of formation and location, i.e. invoke inhomogeneity in the ISM. Of course, it could as well be the Solar System rather than IRC+10216 that started out with an unusual composition. Both suggestions are not purely ad hoc. Already Lugaro et al. (Lugaro99 (1999)), in order to explain isotopic variations in the Si isotopes of single presolar silicon carbide grains from primitive meteorites, called for small local inhomogeneities in the ISM at the time of parent star formation of the grains as an alternative to Galactic chemical evolution. And, as has been known for quite some time already, oxygen isotopic ratios in the Solar System seem to be quite peculiar (e.g., Wilson & Rood, wilson94 (1994); Prantzos et al., prantzos96 (1996)). In addition, the interstellar Rb isotope ratio 85Rb/87Rb determined toward Ophiuchi A (Federman et al. federman04 (2004)) indicates a higher ratio of r- to s-process nuclides in the Solar System as compared to the local ISM.
Reifarth et al. (reifarth2000 (2000)) discussed various other possible nucleosynthesis scenarios besides the s-process. Accepting Galactic chemical evolution as the reason for the difference between the Solar System and the ISM 34S/36S ratios, those that involve core collapse supernovae (SN) (other than the s-process) face the problem of how to account for the large increase during the last 4.6 Ga. This probably includes the r-process. To some extent this also includes the “neutron burst”, intermediate between s- and r-process and thought to occur during passage of a shock wave through the He shell of type II SN, which Meyer et al. (meyer2000 (2000)) modelled to explain specific types of isotope abundance anomalies found in supernova grains preserved in meteorites. Note, however, that the efficiency of the process depends on previous s-process seeds and that its effects are included in the SN II yields calculated by the authors cited above. Low-entropy scenarios associated with supernovae type Ia that can account for production of neutron-rich isotopes such as 48Ca and 50Ti (Meyer et al. meyer96 (1996); Kratz et al. Kratz2001 (2001)) would be qualitatively compatible with the trend in GCE, but again existing information on production yields for 36S is not encouraging (Reifarth et al. reifarth2000 (2000); Kratz et al. Kratz2001 (2001)).
In summary, while it appears we have observationally identified a stellar source with enhanced 36S and there are some reasonable ideas about how Galactic 36S is produced, we are left with a number of open questions. Further studies of other objects and/or regions in the ISM, especially when correlated with other isotopic systems such as the carbon, oxygen, and chlorine isotopes, may turn out to be helpful. The same holds true for continued study of the relevant stellar physics and nucleosynthesis processes.
6 Conclusions
The main conclusions of this paper are:
-
1.
Measuring the rare isotopic species of CS and SiS in IRC+10216, the abundance ratio of 34S/36S in IRC+10216 is 107(), comparable to values in the Galactic interstellar medium (115), but smaller than the solar value (288).
-
2.
The increase of the 36S abundance relative to 34S only qualitatively follows the prediction of a low mass AGB star model. Quantitative agreement of the observed 34S/36S ratio with the stellar models can be reached if the age of IRC+10216 and Galactic Chemical evolution are taken into account or if there are considerable inhomogeneities in the interstellar medium, and either IRC+10216 or the Sun started with an unusual 36S abundance.
-
3.
From the observed line density toward IRC+10216 and toward Galactic star forming regions, confusion limits toward these sources are estimated.
Appendix A Line identifications
| Nr. | Freq.a | Im.-Freqa | Identification | |
|---|---|---|---|---|
| mK | MHz | MHz | ||
| 1 | 4 | 94903 | 98126 | HCCC13CN |
| 2 | 3.5 | 94913 | 98155 | SiC4 (im.) |
| 3 | 5.5 | 95018 | 98011 | l-C3Hb (im.) |
| 4 | 6 | 95035 | 97095 | C36S; l-C3Hb (im.) |
| 5 | 21 | 95049 | 97980 | CS(2-1) (im.) |
| 6 | 20 | 95087 | 97942 | SiC4 |
| 7 | 1.5 | U95115 | 97914 | |
| 8 | 1.5 | 95126 | 97903 | SiCCC13C |
| 9 | 20 | 142297 | 151263 | H2C4 |
| 10 | 23 | 142321 | 151235 | Al37Cl |
| 11 | 3.5 | 142345 | 151215 | HCCC13CN |
| 12 | 5 | 142402 | 151158 | SiS ? |
| 13 | 29 | 142410 | 151150 | NaCN |
| 14 | 5 | U142489 | 151071 | |
| 15 | 40 | 142502 | 151058 | CCS |
| 16 | 7 | 142525 | 151035 | C36S |
| 17 | 460 | 142560 | 151000 | 29SiS |
| 18 | 4 | U142594 | 150966 | |
| 19 | 12 | U142622 | 150940 | |
| 20 | 7 | 142675 | 150885 | SiCCC13C |
| 21 | 9 | 142695 | 150865 | artefact |
| 22 | 850 | 142730 | 150831 | C4H |
| 23 | 9 | 142755 | 150805 | C4H ? |
| 24 | 850 | 142768 | 150793 | C4H |
a) The band from which the line probably originates is given in
bold face; for information, the frequency of the corresponding
image band is also given. b) Thaddeus et al. (thaddeus85 (1985)).
c) Cernicharo et al. (cerni2000 (2000)) and references therein. d)
The SiS line is at 142399.8 MHz. A shift of
MHz could be possible if the
line is produced in the acceleration region (blue).
In Table 3 we list the observed spectral line features seen in Fig. 1, and the approximate values for , the rest frequency and the rest frequency in the image band (assuming an LSR velocity of ). The final column contains some identifications from the literature. In the 256 MHz wide spectrum of the C36S line we have identified 8 spectral line features. Of those, three can be identified with transitions from the image sideband. In the 256 MHz around the frequency of the C36S line we have detected 16 spectral line features, none of which can be assigned to a line from the image band. Six lines can be identified with known transitions from the Cernicharo et al. (cerni2000 (2000)) line survey, and the other identifications were made with the catalog of the Instituto de la Estructura de la Materia (Madrid) containing species described by the authors. There is a clearly detected feature at the frequency of the C36S line; another feature at 142.755 GHz is tentatively assigned to emission from C4S. Eight further lines have not been identified. The emission at 142.695 GHz is an artefact due to some bad spectrometer channels.
Appendix B The confusion limit toward astronomical molecular line sources
| Source | weakest | Ref.b | ||
| detect. Lines | ||||
| mm | mK | h | ||
| IRC+10216 | 3 | 1.5 | 28 | 1) |
| 28 km s-1 | 2 | 3.5 | 10 | 1, 2) |
| 1.3 | 80 | 2) | ||
| Orion-KL | 3 | 20 | 0.8 | 3) |
| 5 km s-1 | 2 | 50 | 0.3 | 4) |
| 1.3 | 70 | 0.4 | 3) | |
| SgrB2(N) | 3 | 0.4 | 3) | |
| 17 km s-1 | 2 | 0.4 | 3) | |
| 1.3 | 0.5 | 3) |
a) integration time (on+off) with present receivers at the IRAM 30-m telescope under normal winter conditions (good summer conditions), one polarization to obtain an rms of 1/3 with a velocity resolution of 1/5 the line width (one polarization receiver only); b)References: 1) this paper 2) Ziurys et al. (ziurys2002 (2002)); 3) unpublished data; 4) Mauersberger et al. (mau88 (1988)); c) weaker lines can be identified if one makes use of the unique line shapes of the spectra of this source (Cernicharo et al. cerni2004 (2004)).
It is evident from Sect. 5.1 that in our 2 and 3 mm spectra of IRC+10216 we are close to the confusion limit, where an increase of integration time does not yield much further information. It is interesting to investigate where line confusion begins to play a role for other favorites of molecule hunters such as the Orion Hot Core, Sgr B2 or the starburst galaxy NGC 253. We limit our discussion to the IRAM-30m telescope. If one wants to extrapolate our results to other telescopes with a higher or lower resolution one has to take into account the detailed source structure chemical and physical conditions within the regions observed (Comito & Schilke comito02 (2002)).
The definition of the useful observing time or rms to be reached is by no means unique and depends on whether one is interested in a mere detection of a line or whether one also wants to obtain some detailed information on the line shape. Here we try to be pragmatic: we have investigated spectra of several molecular line sources made with the IRAM 30-m telescope at 3 mm, 2 mm and 1.3 mm wavelength made with such a long integration that of the spectral range observed is covered with features. We have determined the antenna temperature of the weakest unequivocal line features (knowing the typical line width and shape in the sources studied). The results are given in Table 5.1. We also give an indication of the necessary rms for a 3 detection with a velocity resolution 1/5 the full line widths typical for these sources and the corresponding necessary integration time with the 30-m telescope and its present receivers (including all observing overheads, using one polarization only). In Orion, part of the confusion arises because of the large line widths observed in the outflow source. This can e.g. be prevented by observing at a carefully selected position offset from the outflow source (Combes et al. combes96 (1996)).
Acknowledgements.
V. Ahrens from the I. Physikalisches Institut der Universität Köln gave us fits to the line frequencies of C36S prior to publication. R.G. acknowledges support by the Italian MIUR-Cofin2002 Project “Nucleosynthesis in the Early Phases of the Universe”.References
- (1) Anders, E. & Grevesse, N., 1989, Geochim. Cosmochim. Acta, 53, 197
- (2) Bao, Z.-Y., Beer, H., Käppeler, F., Voss, F., & Wisshak, K. 2000, Atomic. Nucl. Data Tables, 76, 70
- (3) Bevington, P.R., Robinson, D.K., 1992, “Data reduction and error analysis for the physical sciences”, McGraw-Hill
- (4) Bieging, J. H. 1997, Astrophysical Implications of the Laboratory Study of Presolar Materials, eds: T. J. Bernatowicz & E. Zinner, American Institute of Physics, p. 265
- (5) Canfield, D.E. 2001, Rev. Mineral. Geochem., 43, 607
- (6) Cernicharo, J., Guélin, M., & Kahane, C. 2000, A&AS, 142, 181
- (7) Cernicharo, J., Pardo, J.R., Guélin, M. 2004, ApJ Letters, submitted
- (8) Chin, Y.-N., Henkel, C., Whiteoak, J. B., Langer, N., & Churchwell, E. B. 1996, A&A, 305, 960
- (9) Combes, F., Nguyen-Q-Rieu, & Wlodarczak, G. 1996, A&A, 308, 618
- (10) Comito, C., & Schilke 2002, A&A, 395, 357
- (11) Crosas, M. & Menten, K. M. 1997, ApJ, 483, 913
- (12) De Laeter, J. R., Böhlke, J. K., De Bièvre, P., et al. 2003, Pure Appl. Chem., 75, 683
- (13) Ding, T., Valkiers, S., Kipphardt, H., et al. 2001, Geochim. Cosmochim. Acta, 54, 2433
- (14) Farquhar, J. & Wing, B.A. 2003, Earth and Planetary Sci. Letters, 213, 1
- (15) Federman, S.R., Knauth, D.C., & Lambert, D.L. 2004, ApJ 603, L105
- (16) Frum C.I., Engleman Jr., R., Bernath, P.F., 1990, J. Chem. Phys., 93, 5457
- (17) Gao, X. & Thiemens, M. H. 1991, Geochim. et Cosmochim. Acta, 55, 2671
- (18) Goeminne, G., Wagemans, C., Wagemans, J., et al. 2000, Nucl. Phys. A, 678, 11
- (19) Goeminne, G., Wagemans, C., Wagemans, J., et al. 2002, Nucl. Instr. Meth. Phys. Res. A, 489, 577
- (20) Grewing, M. 1994, IRAM Annual Report 1994, p. 17
- (21) Groenewegen, M. A. T., van der Veen, W. E. C. J., & Matthews, H. E. 1998, A&A, 338, 491
- (22) Guélin, M., Lucas, R., & Cernicharo, J. 1993, A&A, 280, L19
- (23) Guélin, M., Forestini, M., Valiron, P., Ziurys, L.M., & Anderson, M.A. 1995, A&A, 297, 183
- (24) Guélin, M., Cernicharo, J., Travers, M.J., et al. 1997, A&A, 317, L1
- (25) Henkel, C. & Mauersberger, R. 1993, A&A, 274, 730
- (26) Henkel, C., Wilson, T.L., Langer, N., Chin, Y.-N.,& Mauersberger, R. 1994, The Structure and Content of Molecular Clouds, Lecture Notes in Physics 439, eds.: T.L. Wilson, K.J. Johnston, Springer Verlag, Heidelberg, p. 72
- (27) Henkel, C., Chin, Y.-N., Mauersberger, R., & Whiteoak, J. B. 1998, A&A, 329, 443
- (28) Johansson, L.E.B., Olofsson, H., Hjalmarson, Å, Gredel, R., & Black J.H. 1994, A&A, 291, 89
- (29) Kahane, C. 1995, AIP Conf. Proc. 327: Nuclei in the Cosmos III, 19
- (30) Kahane, C., Gómez-González, J., Cernicharo, J., & Guélin, M. 1988, A&A, 190, 167
- (31) Kahane, C., Dufour, E., Busso, M., et al. 2000, A&A, 357, 669
- (32) Kratz, K.-L., Böhmer, W., Freiburghaus, et al. 2001, Mem. S. A. It., 72, 453
- (33) Kuiper, T.B.H., Knapp, G.R., Knapp, S.L., & Brown, R.L. 1976, ApJ, 204, 408
- (34) Le Bertre, T. 1997, A&A, 324, 1059
- (35) Limongi, M. & Chieffi, A. 2003, ApJ 592, 404
- (36) Lodders, K. 2003, ApJ, 591, 1220
- (37) Lovas, F.J., SLAIM Magnetic tape version T84, priv. comm.
- (38) Lovas, F. J. 1992, J. Phys. Chem. Ref. Data, 21, 181
- (39) Lucas, R., Guélin, M., Kahane, C., Audinos, P., & Cernicharo, J. 1995, Ap&SS, 224, 293
- (40) Lugaro, M., Zinner, E., Gallino, R., & Amari, S. 1999, ApJ, 527, 369
- (41) Mauersberger, R. & Henkel, C. 1989, A&A, 223, 79
- (42) Mauersberger, R., Henkel, C., & Wilson, T. L. 1988, A&A, 205, 235
- (43) Mauersberger, R., Guélin, M., Martín-Pintado, J., et al. 1989, A&AS, 79, 217
- (44) Mauersberger, R., Henkel, C., Langer, N., & Chin, Y.-N. 1996, A&A, 313, L1
- (45) Meyer, B.S., Krishnan, T.D., & Clayton, D.D. 1996, ApJ, 462, 825
- (46) Meyer, B.S., Clayton, D.D., & The, L.-S. 2000, ApJ, 540, L49
- (47) Olofsson, H., Johansson, L.E.B., Hjalmarsson, A., & Nguyen-Q-Rieu 1982, A&A, 107, 128
- (48) Palme, H. & Beer, H. 1993, in: Landolt Börnstein Group VI, Astronomy and Astrophysics, Vol 2A, ed. H.H. Voigt (Berlin, Springer), p.196
- (49) Prantzos, N., Aubert, O., & Audouze, J. 1996, A&A, 309, 760
- (50) Raiteri, C. M., Gallino, R., & Busso, M. 1992, ApJ, 387, 263
- (51) Rauch, M. 1998, ARA&A, 36, 267
- (52) Rauscher, T., Heger, A., Hoffman, R.D., & Woosley, S.E. 2002, ApJ, 576, 323
- (53) Reifarth, R., Schwarz, K., & Käppeler, F. 2000, ApJ, 528, 573
- (54) Rosman, K.J.R. & Taylor, P.D.P 1998, Pure Appl. Chem., 70, 217
- (55) Salez, M., Frerking, M. A., & Langer, W.D. 1996, ApJ, 467, 708
- (56) Sanz, M.E., McCarthy, M.C., Thaddeus ,P. 2003, J. Chem. Phys., 119, 11715
- (57) Schatz, H., Jaag, S., Linker, G., et al. 1995, Phys. Rev., C51, 379
- (58) Thayer, M. R. 1997, ApJ 482, 792
- (59) Thaddeus, P., Gottlieb, C.A., Hjalmarson, Å., et al. 1985, ApJ, 294, L49
- (60) Thode, H.G. & Rees, C.E., 1971, Earth and Planetary Sci. Letters, 12, 434
- (61) Townes, C.H. & Schawlow, A.L. 1975, Microwave Spectroscopy, Dover Publ., New York
- (62) Travaglio, C., Gallino, R., Arnone, E., Cowan, J., Jordan, F., & Sneden, C. 2004, ApJ, 601, 864
- (63) Wagemans, C., Goeminne, G., De Smet L., & Wagemans, J. 2003, Nucl. Phys., A719, 127c
- (64) Wall, J.V. & Jenkins, C.R. 2003, “Practical Statistics for Astronomers”, Cambridge University Press, Cambridge
- (65) Weigelt, G., Balega, Y., Blöcker, T., et al. 1998, A&A, 333, L51
- (66) Wilson, T. L. & Matteucci, F. 1992, A&A Rev., 4, 1
- (67) Wilson, T. L. & Rood, R. 1994, Ann. Rev. A&A, 32, 191
- (68) Winters, J.M., Dominik, C., Sedlmayr, E. 1994, A&A, 288, 255
- (69) Woosley, S. E. & Weaver, T. A. 1995, ApJS, 101, 181
- (70) Woosley, S.E., Heger, A., & Weaver, T.A. 2002, Rev. Mod. Phys.,74, 1015
- (71) Ziurys, L. M., Savage, C., Highberger, J. L., et al. 2002, ApJ, 564, L45