INTEGRAL and XMM-Newton Spectral Studies of NGC 4388
Abstract
We present first INTEGRAL and XMM-Newton observations of a Seyfert galaxy, the type 2 AGN NGC 4388. Several INTEGRAL observations performed in 2003 allow us to study the spectrum in the 20 - 300 keV range. In addition two XMM-Newton observations give detailed insight into the 0.2 - 10 keV emission. The measurements presented here and comparison with previous observations by BeppoSAX, SIGMA and CGRO/OSSE show that the overall spectrum from soft X-rays up to the gamma-rays can be described by a highly absorbed () and variable non-thermal component in addition to constant non-absorbed thermal emission () of low abundance (), plus a constant Fe K and K line. The hard X-ray component is well described by a simple power law with a mean photon index of . During the INTEGRAL observations the 20 – 100 keV flux increased by a factor of 1.4. The analysis of XMM-Newton data implies that the emission below 3 keV is decoupled from the AGN and probably due to extended emission as seen in Chandra observations. The constant iron line emission is apparently also decoupled from the direct emission of the central engine and likely to be generated in the obscuring material, e.g. in the molecular torus.
1 Introduction
Seyfert 2 galaxies are among the optically faintest Active Galactic Nuclei (AGN) seen in the Universe. This is believed to be due to a geometrical effect. The emission of the super massive black hole at the AGN core is probably absorbed by a surrounding torus. The torus not only hides the broad line region, causing the characteristic Seyfert 2 optical spectra with narrow emission lines, but also absorbs most of the low energy X-ray emission. As the soft X-ray region is very sensitive to absorption in the line of sight, the study of the hard X-ray emission above is a powerful tool to investigate the central engine of Seyfert 2 (Ghisellini, Haardt & Matt 1994). In addition to this the variation of the Fe K line seems to vary differently with respect to the continuum in several cases (Iwasawa et al., 2003; Fabian, 1977; Malzac & Petrucci, 2002), which might be caused by the interaction of the core emission with the absorbing and reflecting material.
At higher energies absorption becomes less important revealing the emission from the close environment of the central black hole. This energy range could be dominated by comptonized hard X-ray radiation from a hot () plasma presumably forming an accretion disk corona Haardt et al. (1994), and Compton reflection of these hard X-rays on a cool accretion disk (George & Fabian, 1991; Magdziarz & Zdziarski, 1995). In Seyfert 2 galaxies, reflection of the central radiation on the molecular torus often leads to an additional, possibly dominant, reflection component (Ghisellini, Haardt & Matt 1994).
NGC 4388 (; Phillips & Malin 1982) is a good probe to test these scenarios, as it is one of the brightest Seyfert 2 galaxies at hard X-rays. The energy range up to has been studied with X-ray missions like ROSAT Antonelli et al. (1997), ASCA (Iwasawa et al., 1997; Forster et al., 1999), BeppoSAX Risaliti (2002), RXTE (Sazonov & Revnivtsev 2004), and lately with Chandra (Iwasawa et al. 2003). Spectral studies of NGC 4388 of the hardest X-ray energies up to several hundreds of keV have been performed by SIGMA Paul et al. (1991), by the OSSE experiment (Johnson et al. 1993) on the Compton Gamma Ray Observatory (CGRO; Gehrels et al. 1993), and up to by the Phoswich Detector System (PDS; Frontera et al. 1997) on-board BeppoSAX (Butler & Scarsi, 1990; Boella et al., 1997). The two BeppoSAX observations in 1999 and 2000 showed a high energy spectrum with a power law of and 1.5, respectively. Due to the energy range covered by the PDS it was only possible to give a lower limit for a possible high energy cut-off (). The INTEGRAL mission Winkler et al. (2003), launched in October 2002, offers the unique opportunity to study the entire spectrum from 3 keV up to several MeV simultaneously. NGC 4388 was the first Seyfert 2 galaxy detected by INTEGRAL in January 2003 (Beckmann et al. 2004). In this paper we present data from several INTEGRAL observations and compare the results with previous SIGMA, OSSE, and BeppoSAX measurements. With a detection significance of and in the INTEGRAL/ISGRI energy bands and , respectively, the data also allow us to study spectral variations between the 2003 observations. In addition XMM-Newton data are presented to study the connection with soft X-rays.
2 Simultaneous X-ray and gamma-ray observations
NGC 4388 was detected by INTEGRAL in the course of the 3C273 observation (Courvoisier et al. 2003a). Though NGC 4388 lies 10.4 degrees north of the quasar 3C273, valuable data for the Seyfert 2 galaxy were obtained due to the large field of view (FOV) of IBIS (, partially coded FOV) and SPI (, partially coded FOV), and because of the dithering observation strategy which is optimized for the spectrometer in order to allow a proper background determination. Observations were performed during seven INTEGRAL revolutions in January, June and July 2003 (Tab. 1). The total amount of exposure time is 512 ksec with 274 ksec and 238 ksec in the January and June/July campaign, respectively. Most of the observations were carried out in a dithering mode. 36 ksec of observation were carried out in staring mode, and are therefore only partly useful for SPI analysis, but they allow a more precise flux extraction from the ISGRI data. Due to the smaller FOV of the two X-ray monitors (JEM-X) and of the optical monitor (OMC) on-board INTEGRAL, NGC 4388 has not been observed by those instruments. We will discuss the INTEGRAL data mainly in terms of the two observation campaigns in January 2003 (JAN03) and June/July 2003 (JUN03).
2.1 IBIS
The ISGRI spectrum has been extracted from ISGRI mosaics of the field created in 20 energy bands. The count rate and statistical error were extracted from the mosaic intensity and variance images for the ISGRI source position derived from the highest significant pixel of the mosaic in all energy bands. The mosaic image fully redistributes the pixel values of the sky images of individual science windows that were created using version 3.0 ot the Offline Science Analysis (OSA) software distributed by the ISDC Courvoisier et al. 2003b . Pixel values are weighted according to vigneting and variance. Finally we add a systematic error of 10% to the spectra.
NGC 4388 was too faint to be seen by IBIS/PICsIT. Summing all available IBIS/ISGRI data together shows that NGC 4388 is detected up to 200 keV, though the data above 150 keV are consistent with zero flux on a level. A fit to a single power law gives a photon index of (25 – 300 keV) and a flux of in the 20 - 40 keV energy band. Analysing the data according to the JAN03 and JUN03 campaign shows that the source was in a lower flux state in January 2003 with a harder spectral slope (), while the June spectrum is steeper () but has a higher flux. Note however that the spectral shape is still consistent with the model on a level. For details see Table 2.
2.2 SPI
In order to reduce the noise in the data reduction process of the SPI data, only those pointings were considered where NGC 4388 was less than 15 degrees off axis. This decreases the total amount of usable pointings to 122 with an exposure time of 178 ksec in JAN03 and 134 ksec in JUN03. OSA 3.0 has been applied, except for some updates. In the binning of the data SPIHIST 3.1.2 was used in order to avoid a known problem with the earlier version. In the case of the image reconstruction program SPIROS Skinner & Connell (2003), we used the more recent version 6.0.1, and also a response function which takes into account the results from the in-flight calibration on the Crab (instrument response function spi_irf_rsp_0015 and redistribution matrix spi_rmf_grp_0002). For details of the SPI analysis procedures see Diehl et al. (2003). The SPI spectrum for the combined data of JAN03 and JUN03 is well described by a single power law with photon index (20 – 500 keV) and a flux of in the energy band, which is consistent with the ISGRI results. Analysing the JAN03 and JUN03 subset it turned out that the source strength is not sufficient for SPI to achieve a reasonable signal to noise spectrum for the individual epochs. In case of marginal detection the SPIROS software tends to overestimate the flux. This naturally leads also to a hardening of spectra, as the higher energy bins have a lower signal-to-noise. The results are shown in Table 2. It can be clearly seen that while the flux value of the combined spectrum is similar to that of ISGRI, the subsets with the lower signal-to-noise show higher flux values, and this trend is stronger at higher energies. Although the trend in flux is similar to the one observed by ISGRI, the spectral evolution is reversed. But the large error bars on the SPI results have to be taken into account and the results are therefore still consistent with each other. For a detailed discussion of cross-calibration issues of the INTEGRAL instruments see Lubiński et al. (2004).
2.3 RXTE
The All Sky Monitor (ASM) on board the Rossi X-ray Timing Explorer (RXTE) scans about 80% of the sky every orbit. This offers an unique way to monitor the emission of bright X-ray sources like NGC 4388 in the energy range. We extracted fluxes from the RXTE/ASM data base. The fluxes have been averaged over the same time periods as the JAN03 and JUN03 INTEGRAL observations in order to have comparable results. The weighted mean of the JAN03 data was , while during the JUN03 campaign the flux was . Due to low statistics the analysis in the three different ASM bands did not give further information about the flux variability.
3 XMM-Newton observations
Two observations with XMM-Newton (Jansen et al. 2001) were performed in July and December 2002 as described in Table 3. Concerning the connection between the soft and hard X-ray emission, the most interesting data for our study come from the two MOS cameras Turner et al. (2001) and from the PN detector Strüder et al. (2001), as they cover the energy range . The data have been reduced using the XMM-Newton Science Analysis Software version 5.4.1 and the model fitting using XSPEC 11.3 was done simultaneously for the PN and MOS data. Both observations are well represented by a Raymond-Smith model Raymond & Smith (1977) at energies below with low abundance (7% solar) and a temperature of about , applying only Galactic absorption (). The so-called mekal model in XSPEC, developed by Mewe & Kaastra, gives the same results (, ).
Around 2.5 keV another additional component is seen in the data. This can be modeled by allowing the abundances of the single elements involved to vary. It turns out that this part of the spectrum is best modeled when the sulfur abundance is about solar, thus being 20 times higher than the relative abundances of the other elements.
The data do not allow to verify the more complex model of a photoionized gas applied by Iwasawa et al. (2003) to the Chandra data. This model avoids the (unrealistic) low abundance, and therefore seems to be more appropriate from a physical point of view.
At harder X-rays, the spectrum is dominated by an absorbed power law. The column density of the cold absorber is . The power-law index is not well constrained by the XMM-Newton data, so the photon index of measured at hard X-rays, has been applied. In addition, a gaussian line at is apparent in both observations. Details of the fit are listed in Table 4. This is consistent with a recent measurement by Chandra, which showed an Fe line of centroid in 6.36 keV Iwasawa et al. (2003). Another weak line is detectable at (probably Fe K) with a flux about ten times lower than the Fe K line. In both XMM spectra there was no sign of a further line at , as reported from Chandra data by Iwasawa et al. (2003). However, due to the lower resolution of the XMM in this energy region, a contribution from a line might be included in the wing of the Fe K line.
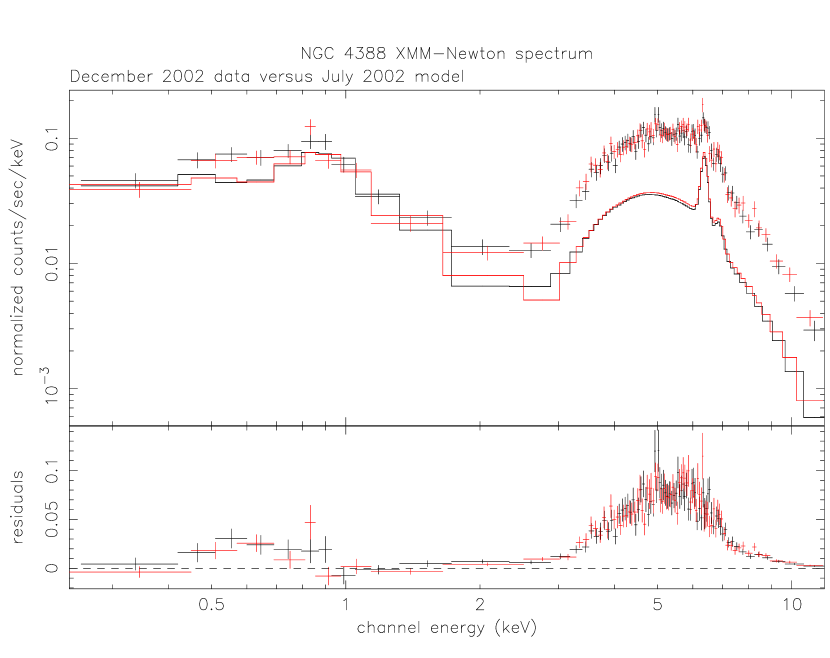
The variation between the July and December data occurs mainly in the high energy part. This is clearly seen when comparing the December data with the model for the July data (Fig. 1). While there are little or no changes below , the spectrum varied significantly at higher energies. The iron fluorescence line at was not affected by the variations.
Sazonov & Revnivtsev (2004) studied the RXTE/PCA slew data of AGN in the energy band. This resulted for NGC 4388 in a luminosity of , which is inside the range of that observed by XMM-Newton in 2002 (extrapolated , for the July and December 2002 observation, respectively).
4 X-ray to Gamma-ray spectrum
The INTEGRAL data alone do not allow us to reconstruct the complete X-ray spectrum of NGC 4388, mainly because the statistics of the ISGRI and SPI data do not constrain existing models.
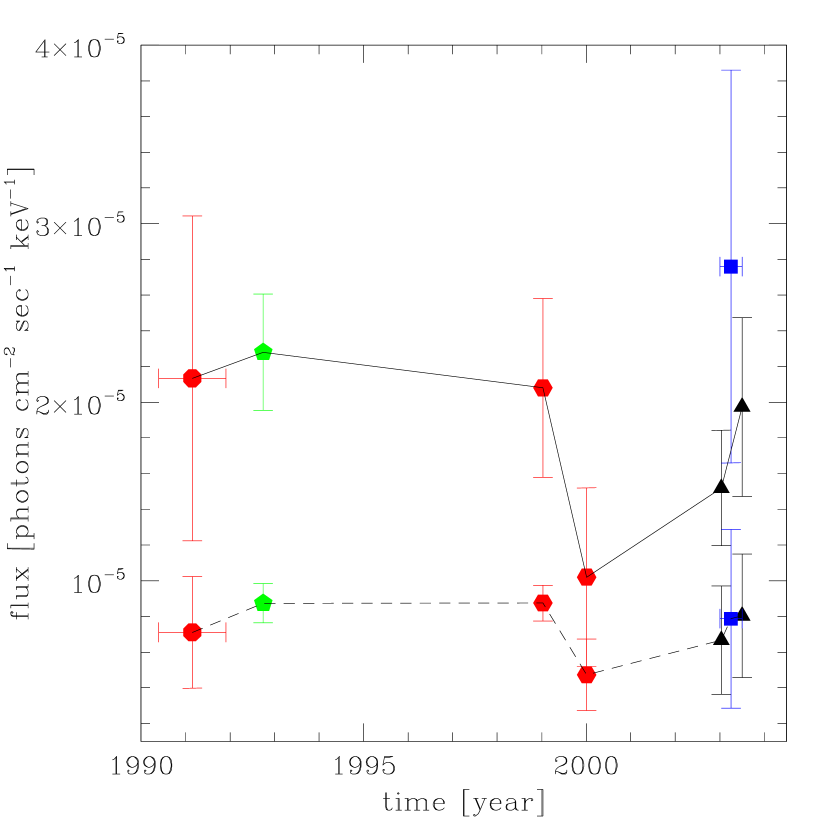
Comparison with former observations by SIGMA Lebrun et al. (1992), OSSE (Johnson et al. 1994), and BeppoSAX/PDS Risaliti (2002) shows a similar spectrum at hardest X-rays as observed with INTEGRAL. Measurements by BATSE gave a flux of , compared with an INTEGRAL value of . This indicates that the soft gamma-ray spectrum does not vary dramatically as shown in the lightcurves for the 60 keV and 100 keV flux in Fig. 2. The large error in the SPI flux at 60 keV is mainly based on the fact that a strong detector background line complex is apparent in the 53 – 67 keV energy range resulting from 73Ge (Weidenspointner et al. 2003), which makes source flux extraction difficult. The flux varied by a factor and the spectral shape is conserved during the 13 years of various observations.
In order to extend the spectrum into the energy range below 20 keV we added the two XMM-Newton EPIC data sets, described in the previous section.
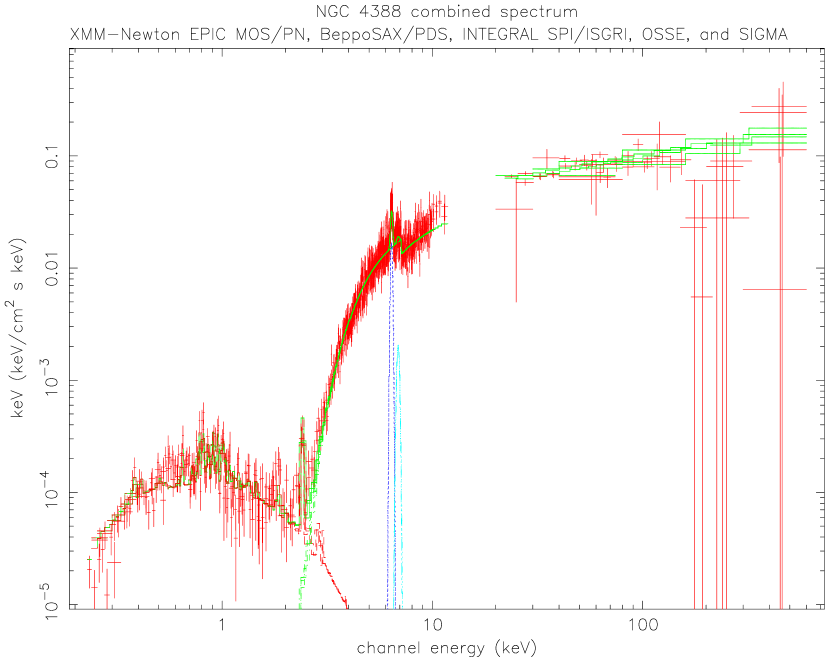
The data were fit simultaneously in XSPEC 11.3 applying the same model as for the XMM data alone: a Raymond-Smith model for a hot plasma with Galactic absorption, an absorbed power law, plus two Gaussian emission lines, representing the K and K line. Figure 3 shows the combined spectrum of NGC 4388. The fit, which allowed for flux variations between the various non-simultaneous observations (see Sect. 5), gave a for 1431 degrees of freedom. The normalization factors are in the range 2.5 to 4.2 relative to the XMM-Newton July 2002 data, which apparently represents the lowest flux level reported so far. The power law, dominating the emission above , has a photon index of and an absorption of .
Using a more complicate model with a cut-off power law plus reflection from cold material (the so-called PEXRAV model; Magdziarz & Zdziarski 1995) instead of the simple power law, does not improve the fit significantly. The data do not constrain the power law and the reflection component: Fixing the photon index to results in a folding energy of , indicating that a cut-off is possible but cannot be confirmed.
Applying a single-power law plus an unresolved set of lines, represented by a broad Gaussian line around 1 keV, instead of the Raymond-Smith component does not give acceptable fit results ().
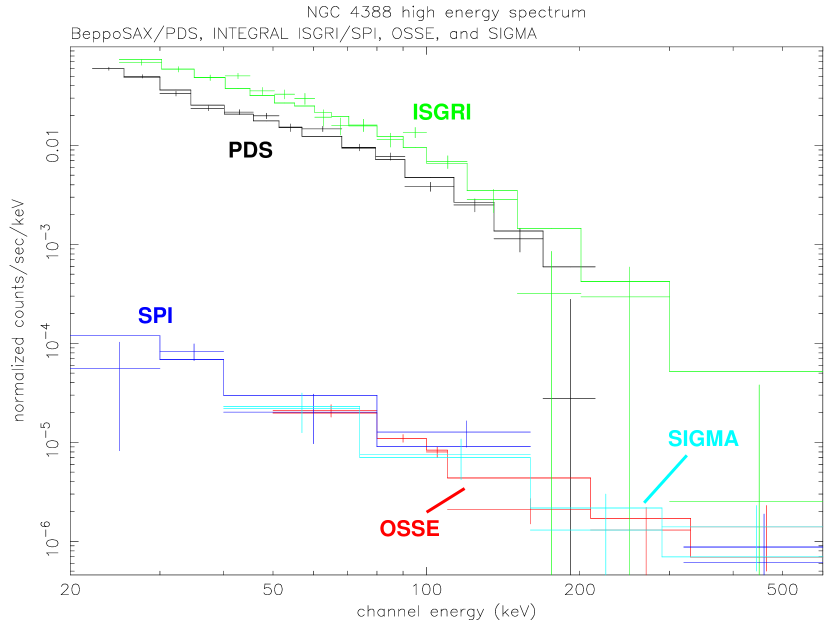
Using only the high energy () data gives a single power law with with (Fig. 4). Also in this energy region alone the more complex PEXRAV model does not give a significantly better fit. Statistics do not allow us to distinguish between a single power law and a PEXRAV model. The differences are smaller than the error bars of the spectra as seen in Fig. 4 and Fig. 3.
5 Discussion
The combination of the INTEGRAL data with previous observations by XMM-Newton, BeppoSAX, CGRO, and SIGMA shows that the spectrum from 0.2 keV up to several hundred keV is well represented by a thermal Raymond-Smith model with only Galactic absorption applied, plus a highly absorbed () power law like emission (), and two Gaussian lines to model the iron fluorescence line at and , respectively. The results are consistent with previous studies of NGC 4388 using subsets of these data (Risaliti, 2002; Lebrun et al., 1992). Also observations with Chandra Iwasawa et al. (2003) and ASCA (Iwasawa et al., 1997; Forster et al., 1999) show a similar spectral behavior.
The fact that the data of the different missions give an acceptable fit using the same normalization is based on the fact that the error bars in the high energy domain are still rather large. The acceptable correspondence between the ISGRI and SPI data leads to the assumption that the INTEGRAL calibration is reasonable and that normalization problems as reported e.g. in Courvoisier et al. (2003a) are not as important anymore. But large error bars on the high energy flux measurements (Fig. 2) still leave open the possibility of some errors in the calibration (Lubiński et al. 2004).
The spectral data of NGC 4388 do not drop drastically above 200 keV, but are not of high enough significance to distinguish whether there is a cut-off, as expected from Comptonisation models Petrucci et al. (2001). On the other hand the absence of a cut-off would be in agreement with Deluit & Courvoisier (2003), who find a cut-off in the BeppoSAX/PDS spectra of Seyfert 1, but not in Seyfert 2. The XMM-Newton data show variability only in the energy region above . This variability cannot be explained by a change in the absorption column density. But using the same model parameters of the July observation (Tab. 4) for the December 2002 data and allowing the normalization of the single power-law to vary, shows that a flux increase by a factor of is sufficient to model the December data (; Fig. 1). The spectral shape of the power law, which describes the hard X-rays, the Fe K line strength, and the soft X-ray component do not seem to vary.
The observed spectrum can be compared to the one derived by Ghisellini, Haardt, & Matt (1994) based on Monte-Carlo simulations for a Seyfert galaxy with inclination , column density of and a torus with half-opening angle of . Based on these assumptions, an equivalent width of the iron fluorescence line of the order of would be expected, which would also mean a parallel evolution of the line flux with respect to the continuum. But the Fe K does not show variability, while the underlying continuum varies by a factor of in the line region (see Fig. 5). The line flux of and for the July and December measurement is also consistent with the one measured by Chandra () Iwasawa et al. (2003). The equivalent width therefore varied strongly (). The exception from this rule is the 1993 ASCA observation, which revealed a high continuum flux with simultaneous high iron line flux. But the rather stable line flux over several years with simultaneous strong variations of the underlying continuum implies that the line emitting region is separated from the continuum source of the object by several light years. A similar behavior has been observed in RXTE spectra of some Seyfert 1 galaxies, where the Fe K line also varies less strongly than the broadband continuum (Markowitz, Edelson, & Vaughan 2003).
Another difference of the spectrum observed here to the simulated one by Ghisellini, Haardt, & Matt (1994) is the fact that the spectrum of NGC 4388 does not seem to have a strong cut-off in the hard X-rays. This could be caused by a higher temperature of the corona () in the case of NGC 4388. If the non-detection of a reflection hump in the hard X-rays is real, this might be a hint for a non isotropic radiation or, generally speaking, a more complex geometry (see e.g. George & Fabian 1991). Apparently there is no scattering of the hard X-rays away from the line of sight, except for the iron K flourescence line. This indicates that in the case of NGC 4388 we indeed observe the unscattered emission of the central engine at hard X-rays. Also no significant decline due to Klein-Nishina processes appears above can be detected in the present data.
Most Seyfert galaxies show a softening of the X-ray continuum as sources brighten (Markowitz, Edelson, & Vaughan 2003; Nandra et al. 1997). The fact that the change in luminosity of NGC 4388 in the hard X-rays, and therefore most probably a change in the accretion rate of the central engine, is not accompanied by variations of the spectral shape remains enigmatic. One explanation might be a generally different radiation processing in Seyfert 1 and Seyfert 2, as indicated in e.g. Deluit & Courvoisier (2003). Matt et al. (2003) argue that absorption in Seyfert 2 galaxies can be caused by several circumnuclear regions and favour a model with a possible temporary switching-off of the nuclear radiation to explain observed variability. Their model predicts an iron K equivalent width of for a Compton thick case with , which is signifcantly lower than the EW measured in NGC 4388 with a similar absorption column density.
The constant soft X-ray emission is most likely not linked to the AGN. This is also supported by the fact, that this emission is extended, as has been reported from ROSAT/HRI measurements Matt et al. (1994) and lately from Chandra Iwasawa et al. (2003). The low abundance in the extended emission has been seen already in the ASCA observations, though with much larger uncertainties (; Iwasawa et al. 1997). Iwasawa et al. (2003) argue that the extended emission at low energies is more likely to origin from photoionized plasma. Even though it is not possible, based on the XMM-Newton data presented here alone, to give a preference to a thermal or photoionized plasma, the latter one has the advantage of avoiding the low abundance in the vicinity (within several kpc) of the AGN core. We therefore refer to the more simple model, applied to the data presented here, which gives sufficient good fit results, even though it might be less meaningful in a physical context. The Chandra data also allowed a space resolved study at soft X-rays, which was not possible with XMM, and found that the AGN core itself apparently contributes less than 10% to the soft X-ray flux (0.5 – 2.0 keV) compared to the surrounding gas.
The INTEGRAL/ISGRI measurements indicate that a lower flux in the soft gamma-ray region is accompanied by a harder spectrum, but the errors on the spectral slope measurement are too large to be statistically significant. Since the SPI data at the same time show the contrary spectral evolution, it is likely that the spectral slope did not change and that there is only a change in flux () by a factor of .
This variation is not seen in the RXTE/ASM data, which cover the softer energy range (1.5 – 12 keV). Note also the large error values, which are consistent with no flux variation for both, the INTEGRAL and the RXTE data.
6 Conclusion
The complex X-ray spectrum of NGC 4388 is composed out of three major components, which originate from different regions:
-
•
Hot plasma component: Emission below is dominated by emission of a hot ( ), optically thin plasma with low abundance (about 7 % solar). This component does not seem to be variable. In ROSAT/HRI and Chandra observations this emission appeared to be an extended X-ray nebula out to several kpc from the AGN. Chandra observations imply that this component might be due to photoionized gas.
-
•
Hard X-ray emission: Emission above follows a highly absorbed () power law with photon index and is related directly to the AGN. While the flux of this component varied by a factor over the past ten years, the spectral shape has been constant within the error bars. No reflection component or cut-off is detectable in the data so far.
-
•
Iron line emission: The Fe K fluorescence line at and K at are both consistent with the redshift of the AGN. The former had a constant flux of from 1995 to 2002. The iron line emission is decoupled from the broadband continuum, similar to the behavior observed in several Seyfert 1 galaxies (Markowitz, Edelson, & Vaughan 2003) and NELG (e.g. NGC 5506; Bianchi et al. 2003). Also the fact that no line broadening is seen supports that it is probably generated several light years away from the AGN core, for example in the molecular torus.
The INTEGRAL data do not allow to constrain the model on the high energy emission, i.e. there is no sign (except the iron fluorescence line) of a Compton reflection component or a cutoff at higher energies but its existence can also not be ruled out.
Following the observations reported here, NGC 4388 was studied in a dedicated INTEGRAL observation, which was performed in staring mode in July 2003. Though staring mode observations usually do not produce useful SPI spectra for sources as faint as NGC 4388, the combination of ISGRI and JEM-X data might show in more detail the connection between the hard and soft X-rays, as seen in this work from simultaneous INTEGRAL and RXTE data. Another 100 ksec TOO observation in June 2004 and 500 ksec open time observation of 3C273 in INTEGRAL’s AO-2 might give further insights into the cut-off of the NGC 4388 spectrum at high energies, e.g. when combined with the already existing data presented here.
References
- Antonelli et al. (1997) Antonelli, L. A., Matt, G., & Piro, L. 1997, A&A, 317, 686
- Beckmann et al. (2004) Beckmann, V., Gehrels, N., Favre, P., Courvoisier, T. J.-L., Walter, R., Malzac, J., Petrucci, P.-O. 2004, in: Proc. 5th INTEGRAL Workshop, ESA SP-552
- Bianchi et al. (2003) Bianchi, S., Balestra, I., Matt, G., Guainazzi, M., Perola, G. C. 2003, A&A, 402, 141
- Boella et al. (1997) Boella, G., Butler, R. C., Perola, G.C., Piro, L., Scarsi, L., Bleeker, J. A. M. 1997, A&AS, 122, 299
- Butler & Scarsi (1990) Butler, C., & Scarsi, L. 1990, SPIE, 1344, 46
- (6) Courvoisier, T.J.-L., Beckmann, V., Bourban, G., et al. 2003a, A&A, 411, L343
- (7) Courvoisier, T.J.-L., Walter, R., Beckmann, V., et al. 2003b, A&A, 411, L53
- Deluit & Courvoisier (2003) Deluit, S., & Courvoisier, T. J.-L. 2003, A&A, 399, 77
- Diehl et al. (2003) Diehl, R., Baby, N., Beckmann, V., et al. 2003, A&A, 411, L117
- Fabian (1977) Fabian, A. C. 1977, Nature, 269, 672
- Forster et al. (1999) Forster, K., Leighly, K. M., & Kay, L. E. 1999, ApJ, 523, 521
- Frontera et al. (1997) Frontera, F., Costa, E., & Dal Fiume, D. 1997, A&AS, 122, 357
- Gehrels et al. (1993) Gehrels, N., Chipman, E., & Kniffen, D. A. 1993, A&AS, 97, 5
- George & Fabian (1991) George, I. M., & Fabian, A. C. 1991, MNRAS, 249, 352
- Ghisellini, Haardt & Matt (1994) Ghisellini, G., Haardt, F., & Matt, G. 1994, MNRAS, 267, 743
- Haardt et al. (1994) Haardt, F., Maraschi, L., & Ghisellini, G. 1994, ApJ, 432, L95
- Hanson et al. (1990) Hanson, C. G., Skinner, G. K., Eyles, C. J., & Willmore, A. P. 1990, MNRAS, 242, 262
- Iwasawa et al. (1997) Iwasawa, K., Fabian, A. C., Ueno, S., Awaki, H., Fukazawa, Y., Matsushita, K., & Makishima, K. 1997, MNRAS, 285, 683
- Iwasawa et al. (2003) Iwasawa, K., Wilson, A. S., Fabian, A. C., Young, A. J. 2003, MNRAS, 345, 369
- Jansen et al. (2001) Jansen, F., Lumb, D., Altieri, B., et al. 2001, A&A, 365, L1
- Johnson et al. (1993) Johnson, W. N., Kinzer, R. L., Kurfess, J. D., et al. 1993, ApJS, 86, 693
- Johnson et al. (1994) Johnson, W.N., et al. 1994, in The 2nd Compton Observatory Symposium, C.E. Fichtel et al. (eds.) New York: AIP, p. 515
- Lebrun et al. (1992) Lebrun, F., Ballet, J., Paul, J., et al. 1992, A&A 264, L22
- Lubiński et al. (2004) Lubiński, P., Dubath, P., Kretschmar, P., Pottschmidt, K., Walter, R. 2004, in: ESA SP-552: Proc. 5th INTEGRAL Science Workshop, astro-ph/0405460
- Magdziarz & Zdziarski (1995) Magdziarz, P., & Zdziarski, A. A. 1995, MNRAS, 273, 837
- Malzac & Petrucci (2002) Malzac, J., & Petrucci, P.-O. 2002, MNRAS, 336, 1209
- Markowitz, Edelson, & Vaughan (2003) Markowitz, A., Edelson, R., & Vaughan, S. 2003, ApJ, 598, 935
- Matt et al. (1994) Matt, G., Piro, L., Antonelli, L. A., Fink, H. H., Meurs, E. J. A., & Perola, G. C. 1994, A&A, 292, L13
- Matt, Guainazzi, & Maiolino (2003) Matt, G., Guainazzi, M., & Maiolino, R. 2003, MNRAS, 342, 422
- Nandra et al. (1997) Nandra, K., George, I. M., Mushotzky, R., Turner, T. J., & Yaqoob, T. 1997, ApJ, 476, 70
- Paul et al. (1991) Paul, J., Ballet, J., Cantin, M., et al. 1991, Adv.Sp.Res. 11, 8, 289
- Petrucci et al. (2001) Petrucci, P.-O., Haardt, F., Maraschi, L., et al. 2001, ApJ, 556, 716
- Phillips & Malin (1982) Phillips, M. M., & Malin, D. F. 1982, MNRAS, 199, 905
- Raymond & Smith (1977) Raymond, J. C., & Smith, B. W. 1977, ApJS, 35, 419
- Risaliti (2002) Risaliti, G. 2002, A&A, 386, 379
- Sazonov & Revnivtsev (2004) Sazonov, S., & Revnivtsev, M. 2004, A&A in press, astro-ph/0402415
- Skinner & Connell (2003) Skinner, G., & Connell, P. 2003, A&A, 411, L123
- Strüder et al. (2001) Strüder, L., Briel, U., Dennerl, K., et al. 2001, A&A, 365, L18
- Turner et al. (2001) Turner, M.J.L., Abbey, A., Arnaud, M., et al. 2001, A&A, 365, L27
- Weidenspointner et al. (2003) Weidenspointner, G., Kiener, J., Gros, M., et al. 2003, A&A, 411, L113
- Winkler et al. (2003) Winkler, C., Courvoisier, T.J.-L., Di Cocco, G., et al. 2003, A&A, 411, L1

| obs. date | INTEGRAL | SPI | number of | observation |
|---|---|---|---|---|
| start | revolution | exp. time [sec] | pointings | mode |
| 05/01/03 | 28 | 80520 | 39 | |
| 11/01/03 | 30 | 10558 | 2 | staring |
| 17/01/03 | 32 | 182643 | 43 | |
| 16/06/03 | 82 | 20000 | 1 | staring |
| 06/07/03 | 89 | 152950 | 47 | |
| 09/07/03 | 90 | 59989 | 17 | |
| 18/07/03 | 93 | 5283 | 2 | staring |
| Observation | Photon | ||||
|---|---|---|---|---|---|
| Index | 20-40 keV | 40-100 keV | 100-200 keV | ||
| Jan.03 / ISGRI | 1.61 | 1.16 (8) | |||
| Jan.03 / SPI | 1.56 | 0.78 (2) | |||
| Jun.03 / ISGRI | 1.76 | 1.42 (8) | |||
| Jun.03 / SPI | 1.29 | 0.70 (5) | |||
| summed / ISGRI | 1.70 | 1.69 (14) | |||
| summed / SPI | 1.68 | 1.30 (4) |
a un-absorbed flux in
| obs. date | MOS-1 | MOS-2 | PN |
|---|---|---|---|
| start | exp. time [sec] | exp. time [sec] | exp. time [sec] |
| 07/07/02 | 9850 | 9937 | 4540 |
| 12/12/02 | 11667 | 11667 | 8291 |
| Observation | abundance | ||||||
|---|---|---|---|---|---|---|---|
| ] | |||||||
| July 2002 | 566 | 1.06 (526) | |||||
| Dec. 2002 | 220 | 1.25 (861) |