e-mail: miguelsg@iac.es; amr@iac.es 22institutetext: Isaac Newton Group of Telescopes, Ap. de Correos 321, 38700 Sta. Cruz de la Palma, Spain
e-mail: rcorradi@ing.iac.es 33institutetext: Department of Astronomy, University of Washington, Seattle, Washington 98195-1580, USA
e-mail: balick@astro.washington.edu
Menzel 3: dissecting the ant
The structure and kinematics of the bipolar nebula Mz 3 have been investigated by means of HST, CTIO and ESO images and spectra. At least four distinct outflows have been identified which, from the inside to the outside, are the following: a pair of bright bipolar lobes, two opposite highly collimated column-shaped outflows, a conical system of radial structure, and a very dim, previously unnoticed, low-latitude and flattened (ring-like) radial outflow.
A simple Hubble-law describes the velocity field of the ballisticaly expanding lobes, columns and rays, suggesting that their shaping has being done at very early stages of evolution, in a sort of eruptive events with increasing degree of collimation and expansion ages ranging from 600 for the inner structures to 1600 years (per kpc to the nebula) for the largest ones.
Key Words.:
planetary nebulae: Mz 3 – interstellar medium: kinematics and dynamics1 Introduction
Menzel 3 (Mz 3, also named as PN G331.7-01.0 or He2-154) is one of the most strikingly beautiful and complex bipolar nebula, named the Ant for its characteristic morphology (Menzel Me22 (1922)). The nebula shows several components with different degrees of collimation, which together with its unusual spectrum made it meriting the nickname of “The Chamber of Horrors” of planetary nebulae (Evans Ev59 (1959)).
Currently, the nature of the central star of Mz 3 is under discussion. While it has been classicaly classified as a young planetary nebula (PN), the near-IR (J-K)0 vs. (I-J)0 diagram by Schmeja & Kimeswenger (SK01 (2001)) shows that it lies far away from the classical PN region and very close to the locus occupied by symbiotic Miras. This and a complex stellar spectrum with many iron emission lines suggest that Mz 3 might have a symbiotic binary central star, surrounded by a high density equatorial gas disc (Smith Sm03 (2003)). Part of the complexity of Mz 3 resides in its distinct multiple outflows. Only few bipolar PNe and nebulae around symbiotic Miras show multiple bipolar lobes and jets, a phenomenon which looks instead rather common for pre-PNe (Sahai & Sánchez-Contreras SS02 (2002)). Examples are M2-9 (also suspected to have a symbiotic nucleus), He2-104 (a genuine symbiotic Mira, Corradi et al. Co01 (2001)), as well as the following objects classified as PNe: He2-320, He2-86, He3-401, He2-437, M2-46 and M3-28 (Manchado et al. Ma96 (1996)).
In this paper, we analyse images and high resolution spectra of Mz 3 by means of a spatiokinematical modeling which allows us to determine the geometrical structure, velocity field and orientation in the sky of the different outflows. The motivation for this is clear: the scientific method is built on identifying patterns, unusual as they may be, before trying to explain them.
Preliminary spatiokinematical modeling of Mz 3 were presented by Santander-García (Sa04 (2004)).
2 Observations and Data reduction
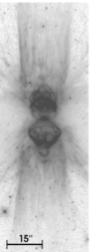
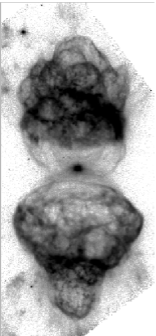
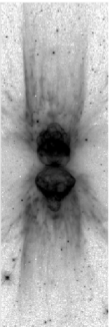
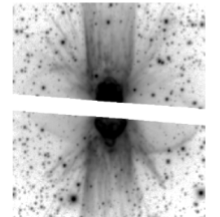
Images of Mz 3 were obtained using the Wide Field Planetary Camera 2 (“WFPC2”) on the Hubble Space Telescope (“HST”) with 0′′.1 pixel-1 in 1997 (GO6502) and 1998 (GO6856), and with 0′′.045 pixel-1 in 2001 (GO9050). For this paper we use only the images obtained through the F656N filter (center wavelength/bandpass = 6564/22 Å) and the F658N filter (6590/29 Å) from the HST archive. Pointing positions and exposure times can be obtained from the HST archive. The F658N filter transmits the [Nii] line with 78% efficiency and the H line with about 4% efficiency, depending on the Doppler shift of the target and its internal kinematics. Generally this is not a problem since the H and [Nii] images are very similar in appearance and intensity except within about 1” of the nucleus where the H image shows a stronger central peak than does [Nii] (the flux of the central star is over 50 times greater in H than it is in [Nii] ). The image in filter F658N is presented in Fig. 1.
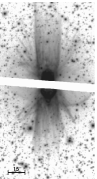
A slightly deeper image (300 s) was obtained on February 1, 2001, at the 3.5 m New Technology Telescope (NTT) at ESO with its imager SUSI2. H and [Nii] 6548,6583 were isolated with the aid of the Hal#884 filter, with central wavelength/FWHM 6555.3/69.8 Å. The seeing was 0′′.7. The spatial scale on the detectors, 2 EEV44-80 CCD (20484096 pixels2 of 15m size each), is 0′′.24 pixel-1 after a 33 pixels binning. This image is also presented in Fig. 1.
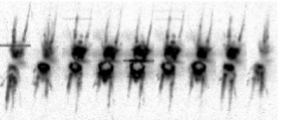
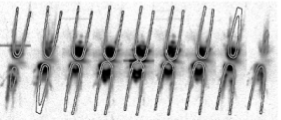
Long-slit echelle spectra were obtained at the 4-m Blanco Telescope at CTIO, on July 11, 1998. Nine exposures, each of 300 s, at P.A.= and offsets from -8′′ (E) to +8′′ (W) from the central star with steps of 2′′, were obtained. They cover a narrow spectral region including the H and [Nii] 6548,6583 nebular line emission. The spatial sampling is 0′′.27 pixel-1, while the velocity resolution is 3.75 km s-1. Slit width was 1′′.
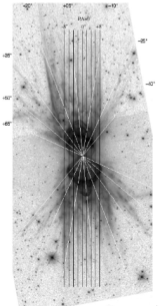
A second set of high-resolution spectra was secured with the EMMI instrument and its Echelle grating at the NTT on May 12, 2000. It consists of 8 exposures, each of 1000 s, spanning from P.A.= to P.A.= with increments and centered on the central star. The Ha#596 filter was used to isolate the order containing H and the nitrogen doublet. The spatial sampling and velocity dispersion are 0′′.27 pixel-1 and 1.88 km s-1, respectively. The slit width was 1′′.2, and seeing between 1′′.3 and 1′′.7. All the slit positions of the Blanco Telescope and NTT spectra are shown in Fig. 2.
Additionally, a long-slit spectrum of Mz 3 was obtained with STIS at the HST on June 23, 2002. Exposure time was 217 s, and the slit was oriented at P.A.= through the central star. The spatial scale is 0”.05 pixel-1, and the velocity dispersion is 23.44 km s-1. This spectrum also cover H and [Nii] 6548,6583.
Data were reduced using standard IRAF packages.
3 Morphology and spectra
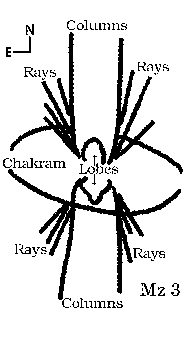
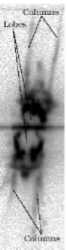
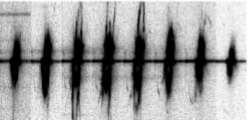
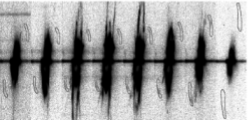
The images of Mz 3 are presented in Fig. 1, while the long-axis, central spectra are shown in Fig. 3. The nebula exhibits a complex morphology with the evidence for several components (Meaburn & Walsh 1985) that we attempt to study separately. In particular, we can distinguish at least four morphological components as indicated in the sketch of Fig. 1.
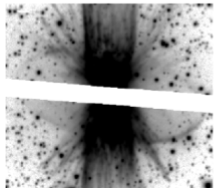
The brightest features are a pair of bipolar lobes emerging from the central star, and extending out to about 15′′ in opposite directions. They look, both in the images and in the spectra, like bubbles with protrusions at the top and bottom. In the HST image, there is some evidence for a second pair of smaller, inner lobes (see Fig. 4), but they are not easily distinguished from the larger lobes in the images and in the kinematical data, so that we did not try to model them. At the base of the lobes, the surface brightness is clearly enhanced in all emission lines, suggesting that very large gas densities are present. The region is briefly discussed in section 4.2.
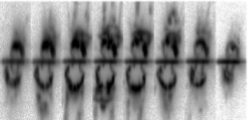
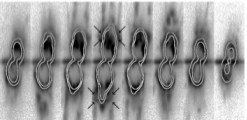
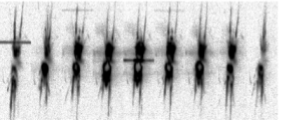
The second brightest feature is the two symmetrical, long tubular protuberances emerging from the central region, that we call columns. They are easily recognized in the spectra as pairs of inclined parallel lines.
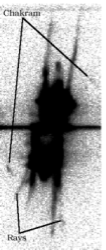
The rays are fainter radial features extending from the central region in a sector within 45∘ from the symmetry axis of the lobes and columns. In the spectra, they appear as dim lines, to the left and right of the columns, emanating from the central star.
An even more puzzling feature is what we have called the chakram because of some similarity (after the modeling described below) with an ancient disk-like Hindu throwing weapon. In the ESO image, it appears as a very faint filled ellipse which major axis is tilted by 80∘ with respect to the long axis of the other outflows. This structure has been unnoticed in previous studies of the nebula. It corresponds to very faint, arc-shaped, and high-velocity features near the upper-right and lower-left corners of all spectra (see Fig. 3), showing decreasing radial velocities at larger distances from the star. Redman et al. (Re00 (2000)) noticed these high velocity features in their spectra, but attributed them to the polar protrusions of the lobes, as they lacked of spectra extending to regions outside the inner bipolar lobes and columns.
4 Spatiokinematical modeling
The wavelengths of the long-slit echelle spectra were transformed into radial velocities for the [Nii] 6583 line. We have chosen this line instead of H because its distribution is similar to, its surface brightness is slightly stronger than, and its thermal broadening is much smaller than that of H over the nebula (apart from the core).
In order to model the images and spectra, we used a spatiokinematical model based on the assumptions of (a) axial-symmetry, (b) that the streamlines of gas are radial, and (c) each particle is expanding with a velocity proportional to the present distance from the star (). This second assumption corresponds to a “Hubble law”, and is found to provide a fair representation of a large fraction of bipolar nebulae (see Corradi Co04 (2004)).
The code, written in IDL, produces an axisymmetric, two-dimensional model which is then scaled according to the distance from the Earth and rotated into three dimensions about its symmetry axis and inclined to the plane of the sky to allow direct comparison with the images. Spatial velocities at each point of the nebula are also computed assuming the previously mentioned Hubble law (except for the chakram, see below), and then transformed to radial velocities according to the adopted orientation parameters. Then synthetic position-velocity plots for several slit positions and offsets are generated. These are compared with our echelle spectra.
The model fit to the data is performed visually after allowing the different geometrical and kinematical parameters to vary over a large range of values. It should also be stressed that the various parameters are not entirely independent of each other, so that varying one parameter value within its acceptable range implies that the other parameters must be adjusted accordingly.
4.1 Lobes and nucleus
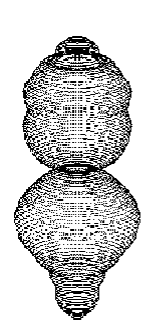
Given the complex apparent geometry of the lobes, we have decided to use an empirical numerical (not analytical) description of their shape. This was done by marking the contour of the lobes on the HST images, stretching it according to the inclination (i.e. the angle between the line of sight and the symmetry axis of the structure), applying rotational symmetry, and scaling with (the maximum velocity of the flow, corresponding in this case to the polar direction of the Southern lobe) and the age-distance parameter . This latter parameter contains the inseparable dependence of the nebular size on the distance and on the kinematical age , assuming that the velocity of each particle of the flow has been constant since the original mass ejection, and thus that the structure has grown in a self-similar way.
A fair overall fit to the images and spectra was obtained (Figs. 4 and 5). The best-fitting parameters, along with an estimate of the range of acceptable values, are listed in table 1.
In spite of the good overall fit, spectra show some significant deviations from the model nebula at specific positions. Some of them are likely to be related to intrinsic deviations from the rotational symmetry that is indeed clearly seen both in the image and the spectra. But other differences also exist. The most notable one is the excess of velocity seen in the spectra of the polar protrusions as compared to the Hubble-flow model (see Fig. 5).
| Parameter | Value | Range |
|---|---|---|
The STIS long-axis spectrum allows us to probe deep into the circumnuclear regions. The [Nii] line in the STIS spectra of the innermost 0′′.6 arcsec is resolved into two velocity components at all spatial positions. A clear point-symmetrical pattern (the blueshifted component in the Northern direction being much brighter than the redshifted one, and the opposite in the Southern side), is also clearly present. The spectrum was binned to a 0′′.1 resolution, and the two components fitted by Gaussians at each spatial position. As shown in Fig 6, the position-velocity plot is consistent, within the observational errors, with the adopted spatiokinematical model for the lobes. The equatorial velocity of the model lobes, namely 10 km s-1, appears therefore representative of the expansion velocities of the [Nii] emitting circumnuclear gas, which might be in a disk or torus-like geometry. Both in H and [Nii], the surface brightness in the nuclear region is significantly enhanced with respect to the emission in the lobes. We have checked whether this bright ionized core is spatially resolved in the long axis STIS spectra by measuring the Gaussian (spatial) centroids at the wavelengths of the [Nii] 6583 Åline, and comparing them with the center as defined by the nearby continuum emission (assuming that that the continuum emission is produced very close to the central star). This method allows to resolve the position of spectral features with an accuracy much better than the instrumental resolution, as demonstrated by Corradi et al. (Co99 (1999)) for the symbiotic nova HM Sge. In the case of Mz 3, there is no evidence that the peaks of the [Nii] emission are displaced more than 0.01 arcsec from the position defined by the continuum. This puts an upper limit of 10 a.u. for the size (along the long axis of Mz 3) of the region where the enhanced [Nii] nuclear emission is produced. The geometry of the bright but unresolved circumstellar [Nii] region is not clear; however, the kinematics of this regions merge seamlessly into the kinematics at the base of the lobes. So they form a large-scale coherent kinematic feature despite their large difference in surface brightness, leading us to speculate that the circumstellar gas may be a small dense disk or torus directly involved in the collimation of the outflows.
4.2 Columns
In order to model the other outflows of Mz 3, we have used analytical description of their shapes. In the following, we use the cylindrical coordinates , with being the symmetry axis. Columns are described using an analytical formula that makes use of several parameters: a shape parameter, , controlling the curvature of the model especially near the central star; , the initial relative width () of the model; , the expansion velocity at the equator (); as well as the previously defined , , and .
In formulae, the shape of the columns is described by
where goes from to , and is the minimum distance to the central star, in arcsec (the radius of the columns equatorial waist). and are normalization constants defined as
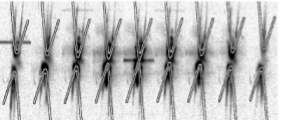
The best-fitting model image and spectra are shown in Figs. 7 and 8, and its parameters are listed in table 2. Again, except for the CTIO spectra corresponding to the slit positions at offset both to East and West, the fit is quite good for all images and spectra. Besides, it nicely reproduces the single velocity and inclination values from the empirical model by Meaburn & Walsh (MW85 (1985)).
| Parameter | Value | Range |
|---|---|---|
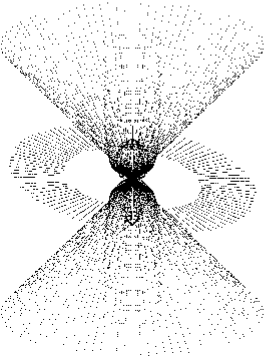
4.3 Rays
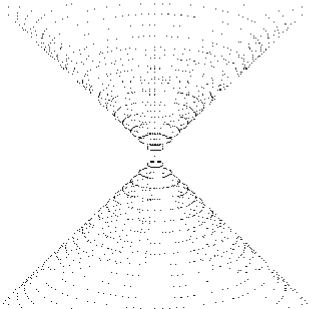
Rays were modeled as Hubble-like flows along the walls of a pair of reflected cones converging at the central star. The input parameters were , , , and the complement to the cone opening angle (or, in other words, the latitude of the walls of the cones from the equatorial plane).
Again, a good analytical description of the geometry and outflow kinematics of the cones is shown in Figs. 9 and 10, and the parameters of the model are given in table 3. Note also that in the aggregate the northern rays look somewhat different from the southern ones. For this reason they were modeled separately. The results are similar on opposite sides of the star, but more uncertain for the northern side, where due to the lack of data, no paramter ranges are provided. The largest discrepancy are the expansion ages, 1000 and 1600 years kpc-1. We doubt that the differences are significant or physically justifiable. Again, Meaburn & Walsh’s (MW85 (1985)) velocity and inclination empirical values are reliably reproduced by this fit.
| Parameter | Value | Range |
| Southern Cone | ||
| Northern Cone | ||
| : | ||
| : | ||
| : | ||
| : |
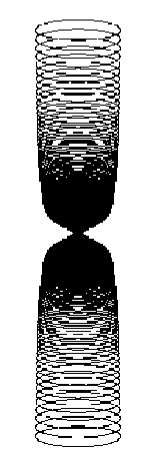
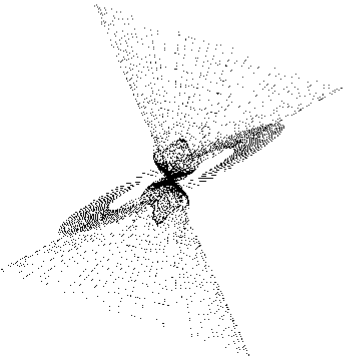
4.4 Chakram
One of the oddest and unusual morphological features of Mz 3 is the large, faint, limb brightened ellipse that seems centered on the nucleus. The plane of the ellipse is near, but clearly offset from the reflection symmetry plane of the other features of Mz 3. The kinematics of this structure are unique among planetary nebulae. They fail to show any velocity increase with radial offset from the nucleus, as do all of the other features of Mz 3. Thus this is not presently a simple equatorial flow, though its motion seems to be strictly radial (there is no sign of rotation that might suggest that the feature is dynamically stable). The kinematic properties of this ellipse are very ordered and symmetric with respect to the nucleus, just like other features of Mz 3. Hence the ellipse must have some sort of a historical link to the evolution of the star.
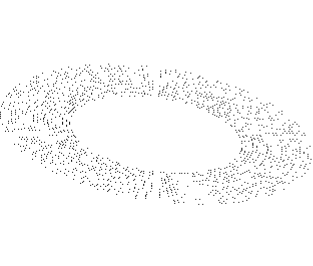
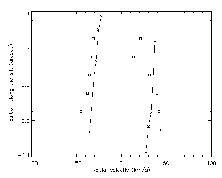
Finding a simple heuristic model for the ellipse was difficult. After considering the apparent morphology and the high-velocity component in the spectra, we decided to model it as a broad and radially (but not ballistically) expanding annulus –a thin disk with an inner hole– centered on the star. We call this annulus the “chakram”. The orientation of the symmetry axis of this disk and its radial expansion profile are entirely free parameters of the model. A fit of the chakram to the images and spectra involves an empirical determination of its inclination i and its clockwise rotation angle with respect to the rest of structures. Given i and , the radial expansion pattern was derived directly from the ESO spectrum at using a third-order polynomial.
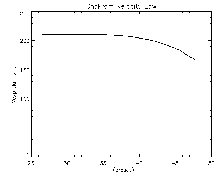
In order to compute a kinematical age of this flow, a constant velocity from the central star to the inner border of the chakram was assumed, by extrapolating the adopted expansion law (shown in Fig. 13). From there on, it was calculated according to this law.
Except for the external (East and West offsets) CTIO spectra, where it lacks of radial velocity (see Figs. 11 and 12), and for the ESO spectrum at P.A.= where the chakram has lower radial velocities than predicted by the model, the final fit to the chakram is also fair, especially if we consider the very simple assumptions made. Note that spectra along position angles near to the major apparent axis of the chakram are presently missing; they would be essential to prove that the simple geometrical and kinematical description that we have chosen is indeed a good description of the chakram.
If confirmed by further spectra, a surprising result of our modeling would be that the disk-like structure of the chakram is tangential (to within few degrees) to the walls of the cone describing the rays (in other words, one diameter of the chakram would coincide with a ray).
| Parameter | Value | Range |
|---|---|---|
| - | ||
5 Discussion
Our analysis has revealed the existence of four distinct, high velocity outflows, that we have named as lobes, columns, rays and chakram. The overall geometry of the nebula is illustrated by the sketch in Fig. 14. The first three features are adequately described by co-axial flows following a Hubble-like expansion law. In other words, each feature is the result of some sort of brief formation process that is better characterized as eruptive and structured rather than explosive and chaotic. Ignoring the chakram for now, we find that Mz 3 fits into the same overall picture –brief formation lasting perhaps a few hundred years followed by ballistic growth– found for other nebulae with symbiotic nuclei, M2-9 and He2-104 (see Corradi Co04 (2004) for a more extended discussion). One difference between Mz 3 from other similar nebulae is that its lobes, columns, and rays have somewhat different ages from one another, with the largest features generally being the oldest. This is expected: any other pattern of formation and expansion predicts that the growing features interact and almost certainly lose their integrity in the process (shocks would convert the kinetic energy of their ordered motion to heat). Nonetheless X-ray emission is seen interior to the lobes of Mz 3 –see below.
On the other hand, we have also found that there are some significant deviations from the Hubble law at specific positions. The lobes present protrusions in their polar regions that show excess velocity as compared to the simple Hubble-like flow (see Fig. 5). These regions are also those that present X-ray emission (Kastner et al. Ka03 (2003)), suggesting that strong hydrodymanical shaping might be at work there. We have also found that the chakram flow does not follow a Hubble law. According to the present data, this unique structure is best described by a flat, broad expanding annulus inclined so as that one of its diameters lies on the surface of the pair of cones that contain the rays. The fit of the empirical model to the data is compelling, albeit unique and very peculiar for planetary nebulae.
According to the modeling, the gas forming the chakram would have been continuously ejected during some 500 years kpc-1, and as the lower radial velocities are found in its most external regions where surface brightness is also enhanced, it could have been decelerated at its outer edge where the chakram accretes ambient material of lower specific momentum (apparently without creating a leading shock). Bujarrabal et al. (Bu91 (1991), Bu01 (2001)) do not detect cold, dense molecular gas in Mz 3, so any gas upstream of the expanding chakram must be hot and invisible, perhaps with a sound speed larger than that of the speed of the leading edge of the chakram. The absence of any Raleigh-Taylor instabilities or ruffles along that leading edge seems to argue that the density of the upstream gas is low. However, the apparent deceleration of the leading edge requires that the mass of displaced ambient gas is comparable to the mass of the chakram, perhaps the remnants of older winds ejected by the star during the ascent of the AGB.
The bizarre orientation of the chakram might be possibly explained by the models of García-Segura & López (GL00 (2000)), who find that misaligned structures (particularly in binary nuclei) can be created as a point-symmetric feature in MHD models with the magnetic collimation axis tilted with respect to the symmetry axis of the bipolar wind outflow.
Given its complexity, it is not easy to conceive a scenario for the formation of the nebula of Mz 3. The presence of multiple outflows with different collimation degrees requires a more articulated mechanism rather than the standard interacting winds theory (Kwok et al. Kw78 (1978)), where the interaction of the two winds that are naturally produced in the past AGB evolution and in the post-AGB one of single, solar-type stars, has been proved to be capable to form bipolar outflows. It is likely that a more complex mass modulation (possibly involving episodic fast winds) as well as other ingredients like perhaps magnetic fields are needed to generate the various outflows observed in Mz 3.
In this respect, the morphology of the lobes, columns and rays of Mz 3 resembles very much model U in García-Segura et al. (Ga99 (1999)), which would correspond to the mass loss from an AGB star rotating close to its critical value, and with a strong magnetic energy component. The expansion ages given there are also of the same order of magnitude as determined in this work, and a linear increase of velocity with distance from the central star, as generally found in our work, is predicted for the jets produced by those models. A deeper comparison with the present data is however prevented by the lack, in the paper by García-Segura et al. (Ga99 (1999)), of a description of the kinematical properties of the model structures that resemble the lobes, columns and rays of Mz 3. It would be extremely interesting to run new magnetohydrodynamical simulations that are further constrained by the kinematical information recovered in the present paper.
Useful information can be obtained by considering the ages of the outflows. In spite of the errors intrinsic to the modeling adopted and its simplistic assumptions, the present data would suggest a time sequence in the ejection of the different outflows. The rays would be the oldest ejecta, occurred some 1500 years ago (assuming a distance of 1 kpc; in the literature one might find distances up to 2.5 kpc and should scale ages consequently); then the columns, which would have been ejected more than 500 years later; and finally the lobes, a few hundred years younger. This would also suggest a sequence of increasing collimation degree, which might be understood as due to an enhancement of the magnetic field as the wind peels off the outer parts of the progenitor star, consistently with the results of Frank (Fr99 (1999)) and Franco et al. (FJ01 (2001)). The chakram is a highly peculiar structure, and if the adopted modeling is confirmed to be correct by additional data, would have been ejected during a lapse of time overlapping with the lobes and columns.
Note, however, that the age differences are not big enough to rule out that some of the flows (lobes and columns or columns and rays) might have been produced approximately at the same time.
Finally, concerning the shaping of nested structures, consider the lobes, for example. One might imagine two scenarios. The gas inside the columns has a pressure which is either high or low when compared with the ram pressure of the leading edges of the lobes expanding inside them. In the former, the leading edges of the lobes should be shocked, as it seems to happen, according to the limb brightening in the images. However, there is no [Oiii], as it should, in the hot recombination region behind the shock, just [Nii] in the warm recombination zone. In the latter case, the lobes would expand against nearly vacuum except where the walls of the columns inertially constrain them. Then their internal sound speed would be 100 km s-1, corresponding to a temperature of 106 K, which is consistent with the X rays seen by Kastner et al. (Ka03 (2003)). The expansion would cause the lobes to cool adiabatically, and their sound speed would drop. Nonetheless the momentum of the leading edges would result in ballistic motion (like the bullet of a rifle: the hot gases that push the bullet cool long after the bullet moves ballistically towards its target).
6 Summary and conclusions
A spatiokinematical study of the bipolar nebula around Mz 3 has been presented. Four different structures have been identified and named as lobes, columns, rays and chakram. The first three have been modeled following basic assumptions: axial symmetry and a Hubble-like, self-similar radial ballistic growth. The chakram, a previously unnoticed planar radially expanding outflow, appears to decelerate as it expands, thus it has been modeled according to an empirical velocity pattern.
The outflows have been found to expand at a maximum velocity that range from 130 km s-1 for the lobes and 300 km s-1 in the case of the columns. Similar but slightly different dynamical ages (of the order of hundreds of years) with increasing collimation degree have been found, and episodic eruptive outflows proposed, with a brief discussion in the matter.
The chakram, on the other hand, has been found to have an odd orientation, running along –and maybe braking against– the walls of the rays, with an expansion pattern that is not following a Hubble law.
Recently we have been aware of an independent spatiokinematical study of Mz 3 by Guerrero et al. (in preparation ). They also use spatiokinematical models for describing the different features of Mz 3. Their derived kinematical parameters (ages, velocities and inclinations) for the lobes, columns and rays appear to agree quite well with our determinations.
Acknowledgements.
We are grateful to Dr. Arsen Hajian for providing us with the CTIO Echelle data; to Sean Doyle for the original, previous version of the IDL code; and to Vincent Icke, for some general wisdom and criticism which contributed to improve this paper.References
- (1) Bujarrabal, V., & Bachiller, R., 1991, A& A, 242, 247
- (2) Bujarrabal, V., Castro-Carrizo, A., Alcolea, J., & Sánchez Contreras, C., 2001, A&A, 377, 868
- (3) Corradi, R. L. M., Ferrer, O. E., Schwarz, H. E., Brandi, E., & García, L., 1999, A&A,348, 978
- (4) Corradi, R. L. M., Livio, M., Balick, B., Munari, U., & Schwarz, H. E., 2001, ApJ, 553, 211
- (5) Corradi, R. L. M., 2004, Asymmetric Planetary Nebulae III, ASP conference series
- (6) Evans, D. S., 1959, MNRAS, 119, 150
- (7) Franco, J., García-Segura, G., Kurtz, S. E., López, J. A., 2001, Physics of Plasmas, 8, 2432
- (8) Frank, A., 1999, NewAR, 43, 31
- (9) García-Segura, G., Langer, N., Rózyczka, M., & Franco, J., 1999, ApJ, 517, 767
- (10) García-Segura, G., & López, J. A., 2000, ApJ, 544,336
- (11) Guerrero, M. A., Miranda, L. F., Chu, Y.-H., in preparation
- (12) Kastner, J. H., Balick, B., Blackman, E. G., Frank, A., Soker, N., Vrtílek, S. D., & Li., J., 2003, ApJL, 591, L37
- (13) Kwok, S., Purton, C. R., & Fitzgerald, P. M., 1978, ApJ, 219, L125
- (14) Meaburn, J., & Walsh, J. R., 1985, MNRAS, 215, 761
- (15) Manchado, A., Guerrero, M. A., Stanghellini, L., & Serra-Ricart, M., 1996, The IAC Morphological Catalog of Northern Planetary Nebulae, Instituto de Astrofísica de Canarias
- (16) Menzel, D. N., 1922, Harvard Bull., 777
- (17) Redman, M. P, O’Connor, J. A., Holloway, A. J., Bryce, M., & Meaburn, J., 2000, MNRAS, 312, L23
- (18) Sahai, R., & Sánchez-Contreras, C., 2002, AAS, 201, 8911
- (19) Santander-García, M., 2004, Asymmetric Planetary Nebulae III, ASP conference series
- (20) Schmeja, S., & Kimeswenger, S., 2001, A& A, 377, L18
- (21) Smith, N., 2003, MNRAS, 342, 383