The pre-main sequence binary HK Ori - Spectro-astrometry and EXPORT data
Abstract
In this paper we present multi-epoch observations of the pre-main sequence binary HK Ori. These data have been drawn from the EXPORT database and are complemented by high quality spectro-astrometric data of the system. The spectroscopic data appear to be very well represented by a combination of an A dwarf star spectrum superposed on a (sub-)giant G-type spectrum. The radial velocity of the system is consistent with previous determinations, and does not reveal binary motion, as expected for a wide binary. The spectral, photometric and polarimetric properties and variability of the system indicate that the active object in the system is a T Tauri star with UX Ori characteristics. The spectro-astrometry of HK Ori is sensitive down to milli-arcsecond scales and confirms the speckle interferometric results from Leinert et al. The spectro-astrometry allows with fair certainty the identification of the active star within the binary, which we suggest to be a G-type T Tauri star based on its spectral characteristics.
keywords:
stars: pre-main sequence, stars: individual: HK Ori, techniques: spectroscopic, stars: binaries| UT Date | Julian Date | Telescope | Exp. time | V | PV | K | H |
|---|---|---|---|---|---|---|---|
| 2450000+ | (min) | (mag) | (%) | (mag) | EW () | ||
| 24-10-1998 | 1110.72 | 11.59 | 0.96 | 7.23 | |||
| 25-10-1998 | 1111.68 | INT | 20 | 11.69 | 1.22 | 7.23 | –59.2 |
| 26-10-1998 | 1112.74 | INT | 10 | 11.71 | 1.26 | 7.25 | –57.8 |
| 27-10-1998 | 1113.66 | INT | 10 | 11.68 | 1.45 | 7.21 | –63.6 |
| 28-10-1998 | 1114.71 | INT | 10 | 11.79 | 1.74 | –57.8 | |
| 29-10-1998 | 1115.68 | INT | 10 | –63.7 | |||
| 29-01-1999 | 1208.49 | INT | 15 | – | 0.86 | 7.18 | –54.0 |
| 31-01-1999 | 1209.51 | INT | 15 | 11.44 | 0.95 | 7.26 | –55.1 |
| 01-02-1999 | 1210.50 | INT | 15 | – | –58.2 | ||
| 30-01-1999 | 1209.46 | WHT | 45 | ||||
| 29-01-2002 | 2303.99 | AAT | 8 5m | –44 |
,
1 Introduction
Multiplicity amongst pre-main sequence stars is at least as common as that in main sequence stars, or perhaps even higher as found for Herbig Ae/Be stars (Bouvier & Corporon 2001, for a review on binary formation see Tohline 2002). The study of young binaries should therefore provide further clues to the star formation process. In this paper we present our results on HK Ori, an intriguing young binary system. Initially classified as having a peculiar A4 emission type spectrum by Joy (1949), it was later proposed to be a Herbig Ae/Be star (Herbig, 1960). Other spectral type classifications have been published, for example, Mora et al. (2001, and references therein) classify HK Ori as a G1Ve type star based on data in the wavelength region 5700 - 6100 . That different spectral types were derived when different wavelength ranges were used, was initially suggested to be due to a spectroscopic binary system (Finkenzeller & Mundt, 1984; see also Corporon & Lagrange 1999, and Mora et al., 2001). Spectral types based on blue spectra tend to result in earlier classifications, while neutral metallic lines, indicative of a cool star, begin to dominate in the red. Recently, it was proven that HK Ori is indeed a binary system. Using speckle interferometry in the near infrared, Leinert, Richichi & Haas (1997) found a binary separation of 0.340.02 arcsec, corresponding to 156 AU at an assumed distance of 460 pc (Leinert et al.). There is a large colour difference: both objects are of almost equal brightness at 1 m, rising to a difference of 2.3 mag in the band. Understanding the nature of the HK Ori system is dependent on the trivial, but unanswered, question on whether the A-type or the G-type star dominates at K wavelengths. Conventional wisdom has it that if only one pre-main sequence star emits excess radiation in the near-infrared, this has to be the late type star. This is because the contraction timescale for lower mass stars is longer, they will therefore arrive later on the main sequence than more massive objects. Leinert et al. (1997) suggested two possible models for the binary HK Ori system. The first model assumes that the object dominating the infrared radiation is also the brighter star in the optical, while conversely, for the second case they assume that one star is dominating the infrared and the other star the optical radiation. Neither of the two possibilities could be excluded on the basis of their data.
HK Ori was one of the targets in the EXPORT (Exo-Planetary Observational Research Team, Eiroa et al. 2000) collaboration. This consortium obtained the ‘1998 La Palma International Time’, which amounts to 5% of observing time on all La Palma and Tenerife telescopes for one year. In this paper we describe the findings on HK Ori. In section 2 we present the EXPORT data and the new spectro-astrometric observations. The method used to extract information from such data is outlined in section 2.2. The data will be used to confirm the presence of a binary and to discriminate between Leinert et al.’s (1997) two scenarios. Section 3 contains the results deduced from the EXPORT data. In section 4 the results on spectro-astrometry are presented. Section 5 contains the discussion and some final remarks.
2 Observations
During the 1998 La Palma International Time campaign, the EXPORT collaboration obtained multi-wavelength observations of young stars on 16 observing nights. A major aim of the EXPORT project is to observe a large sample of Herbig Ae/Be stars to learn about their temporal variability. During four runs in May, July, October 1998 and January 1999, 72 target stars were observed spectroscopically at the 2.5m Isaac Newton Telescope (INT) and the 4.2m William Herschel Telescope (WHT) and photo-polarimetrically at the 2.5m Nordic Optical Telescope (NOT) and the 1.5m Carlos Sánchez Telescope (CST). From these data we have available for HK Ori eight medium resolution red spectra taken on timescales of days and months, one high resolution blue spectrum and multi-epoch photo-polarimetric data coincident with the observations of the red spectra. The INT, WHT and NOT are located at the Observatorio del Roque de los Muchachos, La Palma, and the CST is at the Observatorio del Teide, Tenerife.
We also obtained spectro-astrometric data on the 3.9m Anglo-Australian Telescope (AAT) at Siding Spring, Australia. With these data we are able to probe structures at scales of milli-arcseconds (see below and Bailey 1998).
2.1 EXPORT data
The intermediate resolution spectra were taken with the INT equipped with the Intermediate Dispersion Spectrograph (IDS). An EEV CCD was used during the observations runs of HK Ori. The wavelength coverage was 5712 to 6812 , with 0.475 per pixel and a resolving power of 6600 at 6300 . The slit width was always 1.0 arcsecond projected on the sky.
The high resolution spectrum was taken on 30 January 1999 using the Utrecht Echelle Spectrograph (UES) on the WHT. The instrumental set-up resulted in a complete spectrum from 3700 to 6100 , with the intermediate and high resolution spectra overlapping between 5700 and 6100 , where the He i 5876 and Na i D lines are located. The spectra were dispersed into 59 echelle orders with a resolving power of 49000 and a slit width of 1.15 arcsec projected on the sky. We refer to Mora et al. (2001) for further details on both the INT and WHT observing procedures and data reduction.
UBVRI photometry and polarimetry were obtained simultaneously using the Turpol UBVRI polarimeter/photometer mounted on the NOT. Six photometric and seven polarimetric observations were taken in October 1998 and January 1999. Only the night of 29 January was not photometric. More details about these observations are provided in Oudmaijer et al. (2001). Seven near-infrared JHK photometric data points were obtained, almost simultaneously with the INT spectra, on the CST. For more details on the near-infrared data, we refer to Eiroa et al. (2001).
Table 1 shows the log of the observations. Columns 1 and 2 give the dates and JD’s of the spectroscopic observations, columns 3 and 4 give the telescopes where these were obtained and the exposure times, columns 5, 6 and 7 give the values of V, polarization and K, and column 8 the equivalent width of H.
2.2 Spectro-astrometry
As the technique is not widely used, we will briefly outline the method, mainly following Bailey (1998). The basic idea of spectro-astrometry is fairly simple, it measures the relative spatial position of spectral features from a longslit spectrum. For example, if one observes a binary system with a large separation in a 2-dimensional longslit spectrum, we would detect two easily distinguishable spectra. In the case of a close, unresolved, binary, we would detect only one spectrum. However, consider now the situation that one of the two stars dominates at a given wavelength, for example at H. The continuum traces the combined emission from both stars, but across the emission line the spatial position of the unresolved spectrum shifts in the direction of the H emitting star. In this manner, the presence of a binary can be revealed. For a well sampled, high signal-to-noise spectrum, we can measure the centroid of the spatial profile to a fraction of a pixel, often down to orders of milli-arcseconds. In order to detect any binary, it is necessary to obtain observations at (at least) 2 different slit angles. If no prior knowledge is present, the obvious choices are the North-South and East-West directions. Usually, to account for systematic effects, observations are done at 4 position angles; 0o, 90o, 180o, and 270o equivalent to N-S, E-W, S-N and W-E.
Bailey (1998) already showed the power of the method when he discovered sub-arcsecond binaries. Takami, Bailey & Chrysostomou (2003 and references therein), studied a large sample of T Tauri stars and described circumstellar material at AU scales (see also Whelan, Ray & Davis 2004 for a different application in the Pa line). Independently, we had started a spectro-astrometric survey of 31 Herbig Ae/Be stars (described in Baines 2004, see also Porter, Oudmaijer & Baines 2004) in which HK Ori was included.
Observations of HK Ori were carried out on 29 January 2002 at the AAT using the RGO spectrograph with its 82 cm camera and a MITLL 2048 4096 CCD. A 1200 line mm-1 grating was used to give a wavelength coverage of about 6280 to 6770 Å for all observations. A 1 arcsec slit width resulted in a resolving power of about 7500 (40 km s-1) at H. The instrumental set-up gives a pixel size of 0.15Å in the dispersion direction and a spatial pixel size of 0.15 arcsecond, amply sampling the spectral resolution and the seeing (2 arcsec during the observations of HK Ori) respectively. Exposures of a CuAr lamp were taken for wavelength calibration. As mentioned, the spectra were obtained at four slit position angles to correct for any instrumental effects such as curvature or optical distortion introduced by the spectrograph, misalignment of the spectrum with the CCD columns, or any departure of the CCD pixels from a regular grid.
The data were reduced using the IRAF package. High signal-to-noise ratio flat fields were made by combining many exposures with the spectrograph illuminated by a tungsten lamp. After subtracting the bias level and dividing by a normalised flat field, the 2-dimensional spectrum was fitted by Gaussian profiles in the spatial direction at each wavelength step. This resulted in a so-called position spectrum, which gives the centre of the emission as a function of wavelength. Four position spectra were obtained at the four different position angles. Any instrumental effects are then largely eliminated by averaging those with opposite position angles (0o-180o, or 90o-270o). The results are two position spectra, one in the North-South (NS) direction and the other in the East-West (EW) direction. Each position spectrum has an arbitrary zero-point, which is adjusted to correspond to the continuum position. The rms accuracy in the positioning of the centroid was found to be 10 mas in a seeing of 2 arcsec. HK Ori was one of the fainter targets in our sample, rms variations of order 2 mas were routinely observed for brighter targets (Baines 2004, Baines et al., in preparation).

3 Results - EXPORT data
3.1 Photometry and polarimetry
Oudmaijer et al. (2001) and Eiroa et al. (2001, 2002) describe the optical photo-polarimetry and near-infrared EXPORT data respectively. Here we briefly mention the observed properties of HK Ori. During October 1998, the V magnitude faded roughly by 0.2 mags, whilst keeping the same B – V colour to within the errors. However, the observed polarization increased significantly, from 0.8% to 1.8% in the V band. The near-infrared data did not change. This behaviour is consistent with that expected for the so-called UX Ori stars (see e.g. Grinin, Kolotilov & Rostopchina 1995), a dust cloud orbiting the star enters the line of sight increasing the extinction, while increasing the polarization fraction of the observed light at the same time. This mechanism also results in an associated reddening, but given the small amount of dimming (0.2 mag in V), changes in B–V may not be observable within our error bars.
HK Ori was brighter and bluer in January 1999. A comparison with the multi-epoch data of Herbst & Shevchenko (1999) indicates that HK Ori was then in its brightest state. The polarization was low, which in principle would be consistent with the above UXOR explanation. However, we note that in the case of UXORs, day-to-day variations in photo-polarimetry and month-to-month variations can not easily be compared since different dusty clouds orbiting the star may be responsible for the polarization (e.g. Oudmaijer et al. 2001). In addition, as will be discussed in the next subsection, there is evidence that the spectrum of HK Ori was veiled by blue excess emission during the 1999 observations, hampering a proper comparison of the polarization states of the star.
3.2 The spectrum
HK Ori has a complex spectrum over the wavelength interval 3700 to 6800 . The spectrum is dominated by forbidden lines and, to a smaller degree, permitted emission lines of neutral metals. Strong and broad double peaked H and H emission lines are present, with the peak separation in H larger than in H. The He i 5876 is also broad and displays an inverse P Cygni profile. An illustration of the early spectral type is provided in Fig. 1, where part of the WHT/UES spectrum of HK Ori is compared with those of 24 CVn (an A star) and Boo (G-type). It is clear that the blue spectrum reveals an A-type object. Neutral metallic absorption lines (Ca i and Fe i) begin to dominate the spectrum from 6000 onwards. The strong Li i 6708 Å absorption indicates that a cool and young object is also present.
Figure 2 shows a plot of the medium resolution INT spectra, centred on H, for all nights in October 1998 and January 1999. For completeness, the 2002 AAT spectrum is shown as well. Both night to night, and month to month variations appear in the profiles. The H profiles in January are similar to the profiles found by Grady et al. (1996), Reipurth Pedrosa & Lago (1996), and Finkenzeller & Mundt (1984). In January 1999 the profiles appear broader and shallower than the October profiles, with a maximum velocity of 400-500 km s-1 in the red wings, with respect to the systemic velocity, and a V/R ratio decreasing daily to a minimum of 0.8. The central absorption dip seems to be redshifted by about 20 kms-1 with respect to the systemic velocity (21 km s-1 LSR, see section 3.3). The equivalent widths are comparable in October and January at Å and Å respectively, this has decreased to Å in 2002.

Both He i 5876 and 6678 are present in the spectra on all nights. He i 5876 displays a broad variable inverse P Cygni (IPC) profile throughout October and January, with a maximum blueshift velocity of -360 km s-1 on 29 January 1999, and a maximum redshift velocity of 270 km s-1 on 25 October 1998. The strength of He i 5876 gradually decreases through October. The He i 6678 line is strong when compared to the He i 5876 line. The velocity of the He i 6678 line remains constant at 16 km s-1. Corporon & Lagrange (1999) suggest that the broad He i 6678 line is blended with the Fe i 6680 absorption line from the cooler companion star. This appears to be confirmed in our spectra since, as can be seen in Fig. 3, the He i line profiles do not at all resemble one another. He i 4026 and 4471 absorption lines are also weakly present in the high resolution spectrum. The lower excitation Na i D absorption are also present in the spectrum. Their redshifted absorption wings had previously been seen by Grady et al. (1996) and Finkenzeller & Mundt (1984).

In the October observations, the absorption lines across the entire spectrum are much stronger than in January. In the spectra that were taken within days in October 1998 and January 1999, the absorption lines do not vary significantly in shape or strength. However, they seem to be variable on longer timescales. Li i 6708 and many other lines have smaller equivalent widths by about 20-30% in the January 1999 data. As all lines still seem to be present, a change in spectral type of the star is not very likely. Instead, it can be explained by introducing an extra, almost featureless continuum veiling of 0.25. The star is brighter and bluer in January, consistent with the idea that a featureless, hot, black body continuum is overlaid over the stellar spectrum.
3.3 Radial velocity
From the Fe ii and [O i] emission lines we measure a local standard of rest (LSR) velocity of 22 3 km s-1. This value is indicative of the radial velocity of the system since these lines originate in the circumstellar material. As a cross check, and due to the large number of stellar spectra obtained by EXPORT, the standard stars of 51 Peg and Boo (both having well defined radial velocities and spectral types G2.5 and G4 respectively) were cross correlated against the spectrum of HK Ori. A radial velocity of 21 3 km s-1 was obtained and, since this matches that of the above spectroscopic lines, will be used for the radial velocity of the system.
A literature search returned few determinations of the radial velocity, and does not indicate any variability. A radial velocity of 26 18 km s-1 was found by Reipurth et al. (1996) based on measurements of the velocity of the associated molecular cloud. Finkenzeller & Jankovics (1984) found a radial velocity of 20 5 km s-1 from the interstellar Na i D absorption lines by assuming these lines are formed close to the star. These values compare well with our own radial velocity of 21 3 km s-1, suggesting that the system does not have a variable radial velocity on timescales less than 20 years.

Since HK Ori has been found to be a binary system, it would be interesting to know the expected radial velocity variations due to binary motion. Using the separation of the two stars (156 AU, Leinert et al., 1997) and assuming that the system consists of a 1 M⊙ G star and a 2 M⊙ A star (as shown later), a maximum value for the radial velocities of both stars can be calculated. Assuming the system to be edge-on, we obtain upper limits to the changes in the radial velocities of 2.8 km s-1 and 1.4 km s-1 for the G and A star respectively, with a binary period of 1130 years. The long period, combined with the small expected velocity variations, are well within the above-mentioned observational limits. The difference in velocities of the two stars is small as well. This is consistent with the fact that no difference can be found between the G star and A star line velocities in the HK Ori spectrum.
3.4 On the spectral type(s) of HK Ori
For the interpretation of the spectra it is useful to know the flux contribution from each star in the binary system HK Ori at any wavelength within the observed region. We assume that the system is composed of an A4 star and a G1 star since both of these spectral types are quoted in the literature and are observed in different spectral ranges. Due to its larger temperature, the A star is much brighter than the G star, particularly in the blue, and for any A+G main sequence spectroscopic binary system, the A star would easily dominate the overall spectrum.
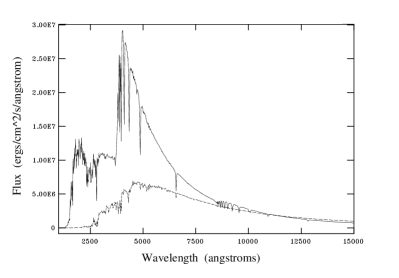
We produced Kurucz (1993) model atmospheres of an A4 V star (Teff = 8500, log g = 4.0) plotted with a model G1 V star (Teff = 5750, log g = 4.5) from 1000 to 15,000 in Fig. 4. The effective temperatures (Teff) were taken from Cohen & Kuhi (1979) who found this parameter for young stars with luminosity class V. Surface gravities (log g) for luminosity class V stars were taken from Straižys & Kuriliene (1981). The observed SED (as e.g. discussed in Leinert et al.) rises from the optical region through the near infrared to 20 m. Both components of the binary are approximately equally bright at 1 m and 1.25 m. To match the Kurucz model with the data, the flux of the G1 Kurucz model atmosphere must be multiplied by 2.25 to get both stars equally bright at those wavelengths (see figure 4).
By taking these ratios it is interesting to see if the above models resemble the spectrum of HK Ori. This was achieved by combining the spectrum of an A dwarf with a G dwarf (multiplied by 2.25) at wavelengths from 5700 to 6800 . The most appropriate stars for this within the EXPORT data are 24 CVn (A4 V) and 51 Peg (G2.5 V). These were chosen because they have the same, or very nearly the same, spectral types as an A4 or G1 star. Figure 5 shows the spectrum of HK Ori (top) along with a combined spectrum of 24 CVn and 51 Peg (2nd from top), and for comparison the spectrum of 24 CVn (2nd from bottom) and 51 Peg (bottom). This combined spectrum compares very well with HK Ori and also reveals how the G star absorption lines are quite strong in this wavelength region. The spectral classification given by Mora et al. (2001) of a G1 type star, in the wavelength region of 5700 to 6800 , has an uncertainty of five spectral subtypes. Repeating the above but replacing the G1 type star with an F6 or G6 type star does not significantly change the overall comparison with the spectrum of HK Ori.
The flux of the G star Kurucz model atmosphere must be increased to fit the models and observations of HK Ori. Assuming a constant temperature, the only parameter that causes an increase of the luminosity is a larger radius of the star. An increased radius, in this case 50%, compared to that of a normal main sequence G star is not unexpected if the G star is in fact a PMS star still in the phase of contraction.
4 Results - Spectro-astrometry
Fig. 6 shows the spectro-astrometric data of HK Ori. The upper panel shows the intensity spectrum centred around H. Below this are the North-South (NS) and East-West (EW) components of the position spectrum derived from a set of observations at slit position angles 0o, 90o, 180o, and 270o. One can clearly see a spectro-astrometric signature occurring across the same wavelength region as the H emission line. The two position spectra show a typical binary signature; the shift in the position spectrum is due to the fact that the H emitting star is dominant at those wavelengths. This is the first, independent, confirmation of the binary status of HK Ori.
The feature in the NS position spectrum extends to almost 80 mas and in the EW to 70 mas, giving an observed difference of 106 mas. This is a lower limit to the true binary separation since we measure the difference between the position of the continuum of one of the stars and the position of a gaussian fit to the combined continua of the two stars in the system. The binary separation of this system was found to be 340 20 mas by Leinert et al. (1997), consistent with the lower limit derived from the position spectra in Fig. 6.
In Fig. 7 the EW position values are plotted against the NS position values to obtain a two-dimensional plot showing the position change through the H emission line (from 6540 to 6590 Å). Because the excursion in Fig. 7 from the continuum (measuring the emission from both stars) to the H emission (tracing the line emission) moves in the South-Western direction, the South-Western star is the H dominating star. The direction of the excursion provides the binary position angle. From a weighted fit to the points, plotted as a straight line in the graph, we determine the binary position angle to be 41.1 1.0o. This is close to that of Leinert et al. (1997) who measured a position angle of 41.7 0.5o.
The data do not allow us to straightforwardly determine with certainty which of the two binary components dominates the optical light however. If the flux difference between both stars were large, then the centroid position of the combined spectrum would be skewed towards the position of the brightest star. If the optically brightest object were the H emitter, the centroid position across H would then hardly differ from its continuum value. If on the other hand, the fainter object was emitting in H, the centroid position will differ significantly from its continuum value and a large excursion would be detected in the figures.
In the case of HK Ori the situation is not that clearcut however. Although the A star outshines the G star in the optical (e.g. Fig. 4) it is only 1.5 times brighter than the G star in the continuum nearby H. The centroid position of the combined continuum is therefore roughly halfway between both objects, and the excursion across H in the position spectrum would be about equally large irrespective whether the optically brightest or the faintest object emits in H. In order to resolve this issue in the case of HK Ori, dedicated models are required to simulate the data. This will be the subject of a forthcoming paper.
In principle, one could apply the same method to photospheric absorption lines to determine which star is associated with the H emission. However, no obvious signatures across absorption lines were found in the present data. We attempted co-adding individual spectral lines to improve the signal-to-noise but subtle, unrepeatable instrumental effects at milli-arcsec level currently prevent us from straightforwardly applying this method to weaker and narrower lines.
In summary, the position plot (Fig. 7) indicates that the South-Western component of the binary is the H dominant object, but we are not yet able to determine whether this is the G or A type star. Leinert et al. (1997) found that this object is also dominating the H and K bands’ emission. This excess emission is very red. At J both objects are roughly equally bright, but the JK colour of the infrared bright object 2.1, indicates a large, red excess. Now, a clearer picture is starting to emerge. The binary component, that emits most of the H, also dominates the near-infrared emission and is clearly the (most) active, young star. The other component is less active, it does not radiate much H emission, and is faint in the near-infrared. In the following we will argue that the system is composed of an active late type T Tauri star with a young, less active A star, which is probably settled, or is settling, on the main sequence.


5 Discussion and concluding remarks
5.1 The pre-main sequence nature of the system
The spectrum of HK Ori reveals a complex behaviour, ranging from double peaked hydrogen recombination lines to variable inverse P Cygni profiles in the helium lines. The different lines probe different regions surrounding the star. The helium emission and absorption predominantly originates in the hot shocked region where material has accreted onto the star (e.g. Beristain, Edwards & Kwan 2001), whereas the redshifted Na transient absorption comes from the neutral material further from the star (see e.g. de Winter et al. (1999) on BF Ori). The double peaked emission line profiles of both the H and H lines may imply formation of the lines in a Keplerian circumstellar disc as the peak separation of the H emission is larger than that of H. In principle, spectro-astrometry should be able to detect the presence of a rotating disk, as the blue- and redshifted emission peaks would be located at either side of the stellar continuum. It turns out that we need a much better spatial resolution than used here to be able to resolve such disks (Baines 2004). Having said that, rotation does not explain the shift of about 20 kms-1 that is observed in the January data. This may well be the result of the increased activity of the star during that period, as evidenced by the extra veiling for example. Indeed, to all intents and purposes, the spectrum resembles that of a low mass classical T Tauri star undergoing variable accretion (see for example the review by Bertout, 1989). The line variability and variable veiling can be explained by magnetospheric accretion. In this model the stellar magnetic field disrupts the circumstellar accretion disc and accreting material proceeds to the stellar surface by falling along the magnetic field lines (see e.g. Wood et al., 1996; Muzerolle, Hartmann & Calvet, 1998). The rotating accretion disk may not be observable in high excitation lines such as helium, as the truncation of the inner disk may prevent this highly excited material being present in a rotating geometry.
Although the A star dominates the optical continuum, evidence that the spectral properties are due to the active T Tauri star is also provided by the fact that the system suffers from variable veiling - the spectrum is brighter and bluer in January 1999, and shows the same absorption and emission lines, only slightly weaker - again a well known observational property of T Tauri stars. The presence of the Li i 6708 line is a characteristic of young low mass stars (Corporon & Lagrange, 1999). An additional observation is that provided by Goodrich (1993) who found a Herbig-Haro object associated with HK Ori, objects which are predominantly associated with lower mass stars.
In addition to the usual T Tauri characteristics, other properties are common to both Herbig Ae and T Tauri stars. As both the photometric and polarimetric variability appear to be correlated, it is likely that this pre-main sequence star (or at least one of the stars in the binary system) is an UXOR (first suggested by Oudmaijer et al., 2001). The star appears to be viewed approximately edge-on through a clumpy, dusty circumstellar disc. Occasionally large dust clouds, orbiting within the circumstellar disc, obscure the star and its H emitting envelope.
5.2 The binary
The spectroscopic data confirm previous suggestions that HK Ori is a binary system consisting of a hot and a cool component. Specifically, the data appear to be very well represented by a combination of an A dwarf star spectrum superposed on a (sub-)giant G-type spectrum. The radial velocity of the system is consistent with previous determinations, and does not reveal binary motion, as expected for a wide binary. The spectro-astrometry of HK Ori confirms, for the first time, the speckle data from Leinert et al. (1997). The position angle was derived to within a degree of that measured from the speckle data, while a lower limit to the true separation is measured by the shift in the photocentre between line and continuum. However, the true separation can be recovered with dedicated simulations. We note that the binary detection was by no means trivial: Pirzkal, Spillar & Dyck (1997) published a paper with similar near-infrared speckle observations as those by Leinert et al., but were unable to detect a companion to HK Ori.
The spectro-astrometric data indicate that the infrared bright component of the binary is also the H emitter. Based on the fact that the spectral properties resemble that of a T Tauri star, we suggest that this component is the G star, and that therefore this object is the optically fainter one.
5.3 Final remarks
In this paper we have investigated the pre-main sequence binary HK Ori. The combination of multi-epoch data and broad wavelength coverage spectroscopy as well as the dedicated spectro-astrometric observations have provided very useful information on both components in this otherwise unresolved system and are complementary to existing speckle data.
There is a realistic hope of learning significantly more about such systems from spectro-astrometry when model simulations, optimized to investigate longslit spectra of sub-arcsecond binaries, become available. Improved data will be crucial for our understanding of pre-main sequence evolution, especially now that binary systems seem to be the norm rather than the exception in young stars (e.g. Leinert et al. 1997, Prato & Simon 1997). The natural next step will be to obtain system parameters such as the separation and the flux difference for both stars from the spectro-astrometry alone. The ultimate goal is to be able to properly distinguish the spectra from the respective stars. and derive physical parameters of both components. These issues will be discussed in a future paper (Porter, Oudmaijer & Baines 2004).
The current generation of telescopes should allow binary systems with much smaller separations than that of HK Ori (0.34 arcsecond) to be studied, certainly if equipped with adaptive optics. We have illustrated in this paper that spectro-astrometry can routinely detect subarcsecond binaries even in comparatively bad seeing of 2 arcsec, whilst not requiring any special techniques. Based on the relative faintness of HK Ori (V11), observations of brighter objects or at higher signal-to-noise should enable the detection of binary companions at milli-arcsecond scales.
Acknowledgements
Debbie Baines acknowledges support from a PPARC student grant. The work of C. Eiroa, B. Merín, B. Montesinos, A. Mora and E. Solano has been supported in part by the Spanish grant AYA2001-1124-C02.
References
- [1] Bailey J., 1998, MNRAS, 301, 161
- [2] Baines D., 2004, PhD thesis, University of Leeds, U.K.
- [3] Beristain G., Edwards S., Kwan J. 2001, ApJ 551, 1037
- [4] Bertout C., 1989, ARA&A, 27, 351
- [5] Bouvier J., Corporon P. 2001, IAU Symposium 200, ASP, ed. Zinnecker H, Mathieu R.D. p. 155
- [6] Cohen M., Kuhi L. V., 1979, ApJS, 41, 743
- [7] Corporon P., Lagrange A. M., 1999, A&AS, 136, 429
- [8] de Winter, D., Grady, C. A., van den Ancker, M. E., et al, 1999, A&A, 343, 137
- [9] Eiroa C. (EXPORT) 2000, in Disks, Planetesimals and Planets, ed. F. Garzón, C. Eiroa, D. de Winter & T. Mahoney, ASP Conf. Ser. 219, 3
- [10] Eiroa C., Garzón F., Alberdi A., et al, 2001, A&A 365, 110
- [11] Eiroa C., Oudmaijer R.D., Davies J.K., et al, 2002, A&A 384, 1038
- [12] Finkenzeller U., Jankovics I., 1984, A&AS, 57, 285
- [13] Finkenzeller U., Mundt R., 1984, A&AS, 55, 109
- [14] Goodrich R.W., 1993, ApJS, 86, 499
- [15] Grady C.A., Pérez M.R. Talavera A., et al., 1996, A&AS, 120, 157
- [16] Grinin V.P., Kolotilov E.A., Rostopchina A., 1995, A&AS, 112, 457
- [17] Herbig G.H., 1960, ApJS, 4, 337
- [18] Herbst W., Shevchenko V.S., 1999, AJ, 118, 1043
- [19] Joy A.H., 1949, ApJ, 110, 424
- [20] Kurucz, R. L., 1993, CD-ROM 1-23 Smithsonian Astrophysical Observatory
- [21] Leinert C., Richichi A., Haas M., 1997, A&A, 318, 472
- [22] Mora A., Merín B., Solano E., et al, 2001, A&A, 378, 116
- [23] Muzerolle J., Hartmann L., Calvet N., 1998, AJ, 116, 455
- [24] Oudmaijer R. D., Palacios, J., Eiroa, C., et al, 2001, A&A 379, 564
- [25] Pirzkal N., Spillar E.J., Dyck H.M., 1997, ApJ, 481, 392
- [26] Porter J., Oudmaijer R.D., Baines D. 2004, A&A, submitted
- [27] Prato L., Simon M., 1997, ApJ, 474, 455
- [28] Reipurth B., Pedrosa A., Lago M.T.V.T., 1996, A&AS, 120, 229
- [29] Straižys V., Kuriliene G., 1981, Ap&SS, 80, 353
- [30] Takami M., Bailey, J. Chrysostomou, A. 2003, A&A 397, 675
- [31] Tohline J.E. 2002, ARA&A 40, 349
- [32] Whelan E.T., Ray T.P., Davis C.J. 2004, A&A 417, 247
- [33] Wood, K., Kenyon, S. J., Whitney, B. A., et al, 1996, ApJ, 458, L79