Evidence for a warm ISM in Fornax dEs – II. FCC032, FCC206 and FCCB729
Abstract
We present -band and H+[N ii] narrow-band
imaging of FCC032, FCC206 and FCCB729, three dwarf elliptical
galaxies (dEs) in the Fornax Cluster. These dEs contain significant
amounts of ionized gas. FCC032 harbours a large ionized gas complex,
consisting of several individual clouds, a superbubble and a
filament that extends away from the galaxy centre. The ionized gas
structures observed in FCC032 bear a strong resemblance to those
observed in more gas-rich and more fiercely star-forming dwarf
galaxies. FCC206, a very low surface brightness dE, contains one
faint extended emission region, and two compact clouds. In FCCB729,
the only nucleated galaxy in this sample, one of the ionized gas
clouds coincides with the stellar nucleus. We derive ionized gas
masses of a few to M⊙ for these galaxies.
This brings our sample of dEs with ionized gas with
H+[N ii] narrow-band imaging to five objects. The
ionized gas morphologies in these galaxies range from pure nuclear
emission peaks to extended emission complexes. This morphological
diversity could also indicate a diversity in ionising processes in
dEs with a warm interstellar medium (active galactic nuclei,
starbursts, post-asymptotic giant branch stars,…).
Inside FCC206, four star clusters appear to be on the verge of
merging to form a nucleus in this presently non-nucleated
dE. Understanding the formation of nuclei in dEs could give us
important clues to the formation of super-massive black holes (SMBHs).
keywords:
galaxies: dwarf – galaxies: individual: FCC032, FCC206, FCCB729 – ISM: H ii regions – ISM: supernova remnants1 Introduction
Dwarf elliptical galaxies (dEs) are the most abundant galaxy type in clusters and groups of galaxies. They are faint, with exponentially declining surface brightness profiles (Ferguson & Binggeli, 1994). Until recently, dEs were thought to have lost their gas and dust long ago. Several evolutionary scenarios have been proposed to explain this apparent lack of an interstellar medium (ISM) in dEs. The ’wind-model’ (e.g. Mori et al. (1997)) proposes that dEs are primordial objects that lost their gas after it was heated above the escape velocity by supernova explosions. Alternatively, the frequent high-speed interactions with giant cluster-members to which a small late-type disc galaxy (Sc-Sd) is subjected and the subsequent starbursts can transform it into a gasless spheroidal dE-like object. This ‘galaxy harassment’ process (Moore et al., 1996) induces a dramatic morphological evolution on a time-span of about 3 Gyr. Moreover, hydrodynamical simulations of dwarf galaxies moving through the hot, thin intergalactic medium in clusters (Mori & Burkert, 2000) or groups (Marcolini et al., 2003) show that ram-pressure stripping can completely remove the ISM of a dwarf galaxy less massive than M⊙ within a few 100 Myr. If the ram pressure is strong enough, the interstellar medium may be compressed and localised star bursts may ensue. Low-mass dwarfs ( M⊙) lose their gas very rapidly, leaving virtually no time for star-formation after entering the cluster of group. Yet another possibility is that dEs are related to other dwarf galaxies such as Blue Compact Dwarfs (BCDs). The ‘fading model’ conjectures that star-forming dwarf galaxies will fade and reach an end-state similar to present-day dEs after they have used up their gas supply and star-formation has ended, although some controversy still remains (Drinkwater & Hardy, 1991; Marlowe et al., 1999). Interactions may have sped up the gas-depletion process, explaining both the abundance of dEs and the paucity of BCDs in high-density environments. These different scenarios to explain the origin of dEs are not mutually excluding. An important common point between the propositions is that they all remove the gas from dwarf galaxies. In addition, unlike massive galaxies, dEs can hardly acquire gas in collisions since their escape velocity is small compared to the velocity dispersion in galaxy clusters.
For all these reasons, dEs were thought to be gas-depleted systems. However, a growing amount of evidence indicates that at least some dEs have retained part of their gas. Since the efficiency of galaxy interactions and ram pressure at stripping the gas off a dwarf galaxy obviously depends on the dwarf’s orbit, dEs on high angular momentum orbits in the outskirts of a cluster can be expected to be more gas-rich. This has indeed been observed in an H i study of a sample of Virgo dEs by Conselice et al. (2003). They find that H i detected dEs are preferentially located near the periphery of the Virgo Cluster, with an overall detection rate of about 15 per cent. In a spectroscopic survey of the Fornax Cluster, Drinkwater et al. (2001) discovered H emission in about 25 per cent of the dEs. Most of these galaxies also lie towards the outskirts of the cluster, while dEs near the centre of the cluster are generally devoid of ionized gas, again suggesting an environmental effect on the gas-depletion rate of dEs (e.g. interactions or ram-pressure stripping) and strongly hinting at an (evolutionary) transition between gas-rich/star-forming dEs at the outskirts and gasless/quiescent ones in the centre of the cluster.
This paper is the second in a series on H imaging of the ionized ISM of Fornax dEs. In De Rijcke et al. (2003b) (hereafter Paper 1) results on FCC046 and FCC207 are reported (for FCC046, see also De Rijcke & Debattista 2004). Both dEs exhibit a central emission region that could be attributed to photo-ionization by post-asymptotic giant branch (post-AGB) stars. FCC046 also harbours 6 faint emission clouds with diameters and fluxes comparable to supernova remnants. The hypothesis that FCC046 is actively forming stars, albeit at a leisurely pace, is further corroborated by its blue colour and high near-infrared Paschen absorption index (Michielsen et al., 2003). Such dEs could be considered as the missing link between more vigorously star-forming dwarfs (such as BCDS) and traditional dEs.
Here, we present -band and H[N ii] narrow-band images of three Fornax dEs (FCC032, FCC206, and FCCB729) that are expected to contain ionized gas, based on the existing spectroscopic equivalent-width (EW) estimates (Drinkwater et al., 2001). In section 2, we discuss the details of the observations and data reduction. The results based on the -band and the H[N ii] narrow-band images are presented in sections 3 and 4, respectively, and discussed in section 5. We summarise our conclusions in section 6. Throughout the paper, we use km s-1 Mpc-1 and a Fornax systemic velocity km s-1, which gives a distance of 18.4 Mpc to the Fornax Cluster..
2 Observations and data reduction
The observations were carried out on 2003 October 18 and 19 with Yepun (VLT-UT4) using FORS2 in service mode. We took 16-min exposures with the H_Alpha/2500+60 filter centred on 6604 Å (this redshifted H filter gives the best overlap with the H emission line in galaxies at the redshift of Fornax) and with a FWHM Å. 130–160 s exposures with the R_Special71 filter centred on 6550 Å and with a FWHM Å were taken to serve as off-band images. H images of the spectrophotometric standard stars LB227 and LTT2415 were taken for flux-calibration. During the observations, the seeing typically was 0.5 – 0.7 arcsec FWHM (determined from the stars on the images). The standard data reduction procedures (bias subtraction, flatfielding, cosmic removal, sky subtraction) were performed with MIDAS111ESO-MIDAS (Munich Image Data Analysis System) is developed and maintained by the European Southern Observatory. Before co-adding, all science images were corrected for atmospheric extinction, using the -band extinction coefficient : provided by the ESO Quality Control, and interstellar extinction, using the Galactic extinction estimates from Schlegel et al. (1998) : for FCC032, for FCC206 and for FCCB729. The images were finally converted to units of electron s-1 pixel-1.
In order to find the correct scaling for the -band images we adopted the following strategy. The pure emission ‘Em’ can be recovered from a narrowband image ‘Ha’ and an -band image ‘Rb’ as
| (1) |
with the proper scaling constant and a correction for possible faulty sky-subtraction. To find the best values for and , we fitted the isophotes of the narrow-band and -band images in an annulus between and mag arcsec-2 which in retrospect did not contain any emission (hence Em ), using the standard MIDAS FIT/ELL3 command. Thus, a smooth version of this annulus could be constructed for both images. The optimal values of and can be found by minimizing the expression with Ha and Rb the smoothed versions of the annulus. With these values in hand, the pure-emission image can be obtained using relation (1).
For all galaxies, was essentially zero, which makes us confident that the sky was properly subtracted from all images. Since the H narrowband and -band filters overlap, subtracting an -band image instead of a narrowband continuum image induces a partial removal of some H+N[ii] light. The error thus introduced is of the order of the ratio of the effective widths of the filters (-band: Å and H: Å). This is less than 4 per cent which is negligible in comparison to other possible sources of error, so we did not correct for it.
A pixel-value (in electrons s-1) in the pure-emission image, denoted as , can be converted to flux units (W m-2), denoted by , using the formula
| (2) |
Here, is the spectrum of a flux-calibration standard star in W m-2 Å-1 and is the measured flux of that star, expressed in electron s-1. The function is the transmission of the H filter and the transmission of the optics (which is basically constant for a narrow-band filter). The prime on indicates that this is the flux incident on the CCD, after going through the telescope and instrument optics and the narrow-band filter. This can also be written as
| (3) |
with , and the incoming fluxes, before going through the telescope optics and the narrow-band filter, of respectively the H 6564Å, the [N ii] 6548Å and the [N ii] 6584Å (redshifted) emission lines approximated as -functions. This allows one to obtain the true incoming flux of the H emission line as
| (4) |
The total incoming H+[N ii] flux is simply
| (5) |
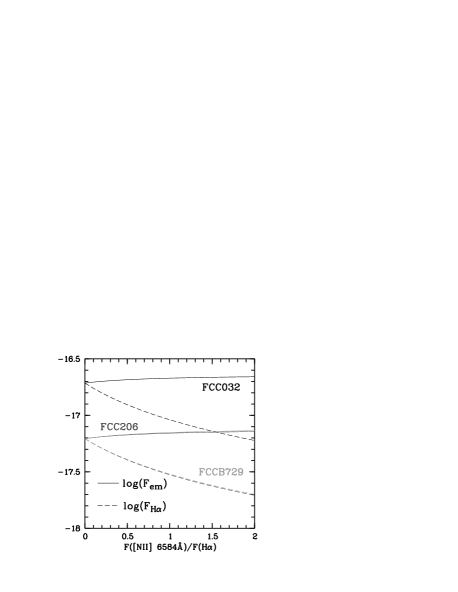
Since the H filter is relatively flat-topped and the [N ii] lines are well inside the filter transmission curve, the total flux is rather insensitive to the adopted relative line-strengths. In the following, we will assume the mean value for the ratio of the line-strengths of the two N lines (Phillips et al., 1986). The ratio is not known and is treated as a free parameter, though it is generally assumed that it varies between 0 and 2.
3 -band photometry
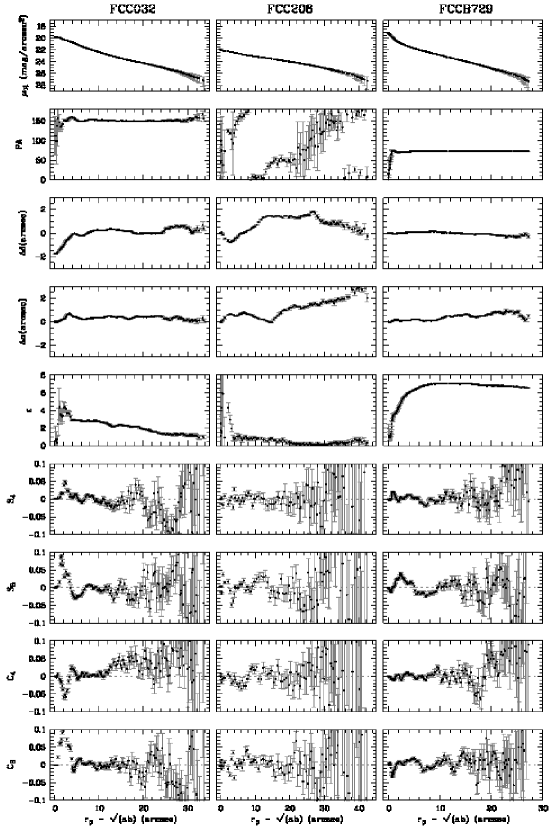
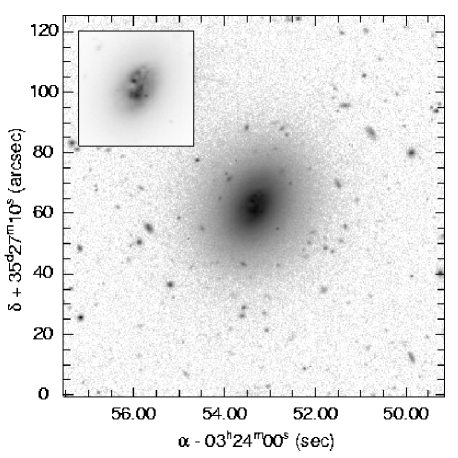
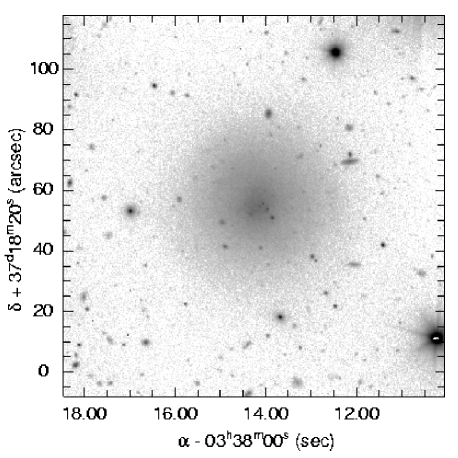
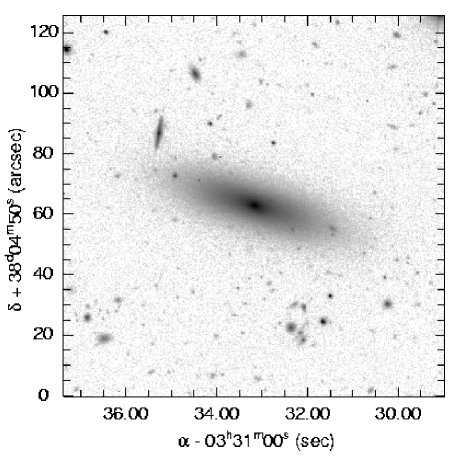
We fitted ellipses to the isophotes of -band images of FCC032, FCC206, and FCCB729 (see Figs. 1, 2, and 3), with the semi-major axis , the position angle (PA), the ellipticity and the coordinates of the centre of each ellipse as free parameters. We masked hot pixels, stars, and cosmics. Masked regions were not used in the fit. For the innermost isophote, the ellipse was centred on the brightest pixel, excluding the bright point sources in FCC032 and FCC206. The deviations of the isophotes from a pure elliptic shape were quantified by expanding the intensity variation along an isophotal ellipse in a fourth order Fourier series with coefficients and :
| (6) |
with the intensity on the ellipse at an angle with respect to the major axis and the average intensity on the ellipse. The photometry of all three galaxies is presented in Fig. 4. All photometric parameters were fitted by cubic splines as functions of the semi-major axis of the isophotal ellipses. This allows us to reconstruct the surface brightness at any given point on the sky and hence to reconstruct the -band image from the fitted photometric parameters. From this reconstructed image, which is obviously free of cosmics and foreground stars, we derived the total apparent -band magnitude and the model-free photometric parameters and . The effective radius is the half-light radius of the galaxy; the effective surface brightness is the mean surface brightness within and can be derived from and using
| (7) |
The surface brightness profiles of dEs can be fitted quite well by a Sérsic profile (Sérsic, 1968), which is a generalisation of de Vaucouleurs’ and exponential laws. Several photometric studies have used this profile to analyse dEs (see e.g. Ryden et al. (1999), Barazza et al. (2003)). We fitted the surface brightness profiles with
| (8) |
with the surface brightness at radius (we measure radii as the geometric mean of the semi-major and semi-minor axes of the isophotes, in arcsec), the extrapolated central surface brightness (both in mag arcsec-2) and the scale radius, in arcsec. The Sérsic shape parameter222Note that in some studies the Sérsic shape parameter is defined as the reciprocal . quantifies the central concentration of the surface brightness profiles, with corresponding to a centrally concentrated de Vaucouleurs profile and to a diffuse exponential. A fit to the profiles has been performed outside 4 arcsec and above the level of 26 mag arcsec-2, to exclude the emission clouds in the centre and to avoid the outer parts of the galaxies which might be affected by flat-field and sky-subtraction uncertainties. In order to compare our results to other studies which use an exponential instead of a Sérsic law, we also fitted an exponential law to the same part of the surface profiles, deriving a central surface brightness and a scale length . All photometric parameters are listed in Table 1.
| name | Type | (1) | (1) | (1) | (2) | (2) | |||
|---|---|---|---|---|---|---|---|---|---|
| (mag) | (arcsec) | (mag arcsec-2) | (arcsec) | (mag arcsec-2) | (arcsec) | (mag arcsec-2) | |||
| FCC032 | dE2 | 14.52 | 7.59 | 20.92 | 1.41 | 18.69 | 0.64 | 5.52 | 20.28 |
| FCC206 | dE0 | 15.02 | 15.86 | 23.01 | 15.33 | 22.43 | 1.33 | 10.64 | 22.02 |
| FCCB729 | S0(7),N | 15.15 | 7.21 | 21.44 | 5.19 | 20.71 | 1.04 | 4.84 | 20.62 |
Galaxy type as classified by us, total de-reddened -band magnitude , half-light radius , and effective surface brightness . (1): parameters of the Sérsic profile that best fits the surface brightness profile: scale-length , extrapolated central -band surface brightness , and shape-parameter ; (2): parameters of the best fitting exponential profile: scale-length and extrapolated central -band surface brightness .
3.1 FCC032
Based on blue-sensitive photographic plates taken with the Las Campanas 2.5 m du Pont telescope and the UK Schmidt Telescope, Ferguson (1989) classified FCC032 as dE pec/BCD, most likely inspired by the presence of several bright knots and dust patches in the central region, which are also visible in our -band images. We applied an unsharp masking technique to the -band images to highlight possible small-scale structure (De Rijcke et al., 2003a). The aforementioned features stand out very clearly in the unsharp-masked image in Fig. 5. None of these bright knots is at the centre of the outer isophotes. We took the brightest knot (in -band) as the reference point, but the photometry in the inner 4 arcsec is hampered by these knots, as can be seen in the rapid variation of the Fourier coefficients. FCC032’s location in a cluster, its diffuse, near-exponential surface brightness profile, and its regular, elliptical isophotes argue in favour of a classification as a non-nucleated dE2.
3.2 FCC206
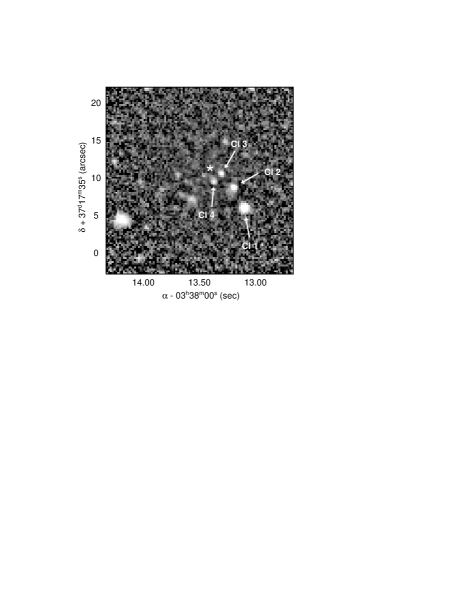
Caldwell & Bothun (1987), in their photometric study of a sample of Fornax galaxies, noted several bright knots close to, but not actually at, the centre of FCC206. We find four unresolved sources in the -band image. They show up very clearly in the unsharp masked image in Fig. 6. FCC206 is quite blue compared with other Fornax dEs and its colour is redder than would be expected from its colour (assuming a single-age, single-metallicity globular-cluster like population), indicative of a composite population containing both cool stars and hot young stars. The knots are found to be even bluer and with luminosities comparable to the brightest and bluest Large Magellanic Cloud globular clusters. These authors suggest that we are witnessing the formation of a nucleus. Caldwell & Bothun (1987) estimate the absolute magnitudes of these knots at . Assuming the clusters to reside inside FCC206, we find , ; , ; , ; and , . The values of Cl2 and Cl3 are corrected for the contribution of the H emission to the -band flux. (Cl1 and Cl4 are absent in the H[N ii] images, see section 4). The naming of the clusters is clarified in Fig. 6. These absolute magnitudes are similar to those of Galactic globular clusters, the brightest of which is Cen with . Due to its roundness, FCC206 has a very ill defined PA, changing continuously over more than 240 degrees. Even outside the central region, where the photometry is not affected by the bright knots, the position of the centre of the isophotes varies significantly and rapidly. We constructed surface brightness models keeping the centre coordinates fixed, but the residuals are always larger compared to the model with varying centre coordinates, thus we conclude the variation in and is real. In the following we take the centre of the outer isophotes as the centre of the galaxy. Finally, FCC206 is non-nucleated and has a very large flat core, which is reflected in its large Sérsic shape parameter .
3.3 FCCB729
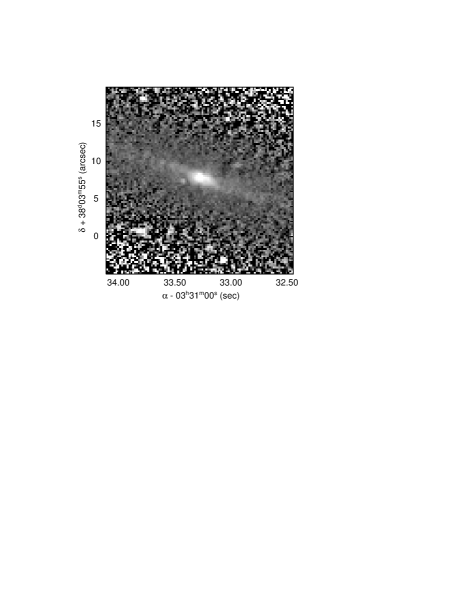
Due to its relatively high surface brightness, FCCB729 was originally classified as a background galaxy (Ferguson, 1989). However, redshift measurements by Drinkwater et al. (2001) identify FCCB729 as a true Fornax Cluster member. Moreover, FCCB729 has a nearly exponential surface brightness profile, typical of a genuine dwarf galaxy. Subtracting the best fitting Sérsic model off the surface brightness profile, we can compute the luminosity of the nucleus. We arrive at an apparent -band magnitude , or absolute magnitude . The effect of seeing alone is not strong enough to account for the decline in ellipticity towards the centre. A simulated pure elliptical surface brightness distribution with convolved with an 0.7 arcsec FWHM Gaussian point spread function would still reach in the centre. Thus the nucleus is significantly rounder than the galaxy itself, although overall, FCCB729 is a very flattened system. Its profile is systematically positive which indicates that the isophotes are slightly disky, especially towards the outskirts. This argues for a classification as dS0(7),N, rather than dE7,N. The dip in around arcsec is due to the two symmetrically opposed bright knots along the major axis, which were masked to derive the photometry. This results in a more boxy appearance at that point. With the unsharp masking technique, we detected what seems to be a faint stellar disc embedded in FCCB729 (Fig. 7), although some caution is needed here. We also applied the technique to the simulated pure dE7 and saw the same signature of a disc. This signature is entirely due to the high degree of flattening and the size of the filtering running box.
4 H imaging
4.1 The H equivalent width
Drinkwater et al. (2001) have measured H EWs of 108 confirmed Fornax
Cluster members, including FCC032, FCC206 and FCCB729, with the
FLAIR-II spectrograph on the UK Schmidt Telescope. The effective
aperture of this system is at least 6.7 arcsec (the fiber diameter)
and could be as large as 15 arcsec because of image movements due to
tracking errors and differential atmospheric refraction. These authors
find:
EW(FCC032)
=
9.6 Å,
EW(FCC206)
=
14.4 Å,
EW(FCCB729)
=
6.8 Å.
For comparison, we calculated the EW inside an aperture radius
from our images as :
| (9) |
with Å the FWHM of the H filter and
and the total number of counts
inside a circular aperture with radius of the narrowband and the
continuum (scaled -band) image, respectively. We find :
FCC032
FCC206
FCCB729
In all, these values are in good agreement with the EWs measured by Drinkwater et al. (2001), considering the uncertainties that affect both measurements (photon shot-noise, sky and continuum subtraction, positioning of the FLAIR-II spectrograph fiber on these faint objects, …).
4.2 The H+[N ii] and H luminosities
| name | SFR | |||||
|---|---|---|---|---|---|---|
| W m-2 | W | W m-2 | W | M⊙ yr-1 | M⊙ | |
| FCC032 | 19.3 – 22.0 | 7.81 – 8.90 | 19.3 – 6.00 | 2.43 – 7.81 | 17.5 – 5.5 | 570 – 1850 |
| FCC206 | 6.17 – 7.17 | 2.50 – 2.90 | 1.96 – 6.17 | 0.79 – 2.50 | 1.8 – 5.6 | 190 – 590 |
| FCCB729 | 6.21 – 7.33 | 2.51 – 2.96 | 2.00 – 6.21 | 0.81 – 2.51 | 1.8 – 5.6 | 190 – 600 |
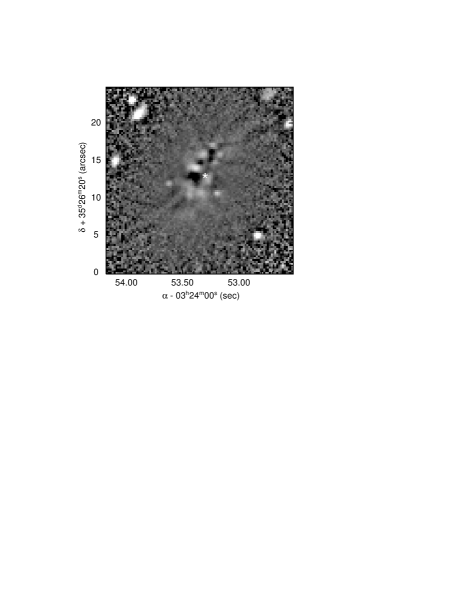
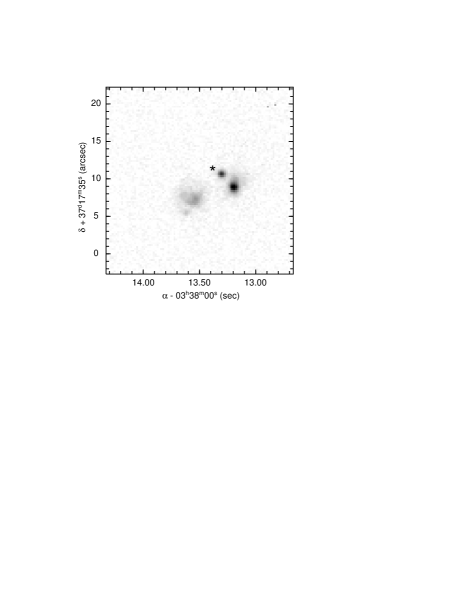
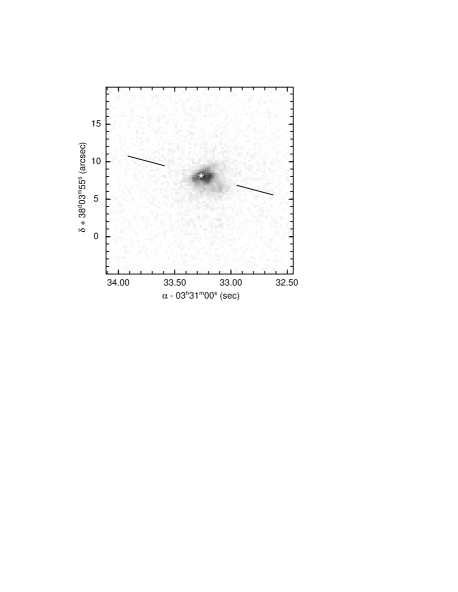
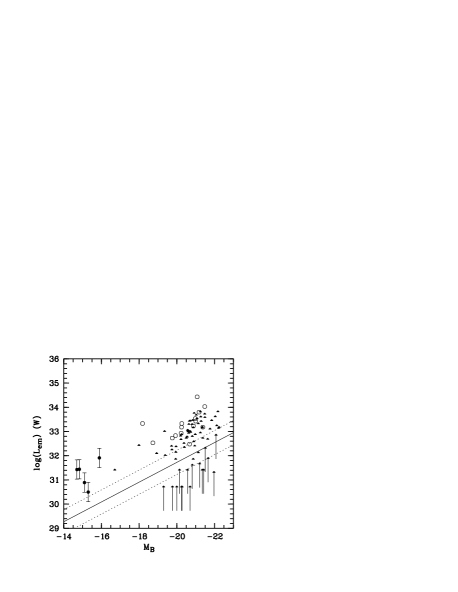
We present the pure H+[N ii] images of FCC032, FCC206 and FCCB729 in Figs. 8, 9 and 10. The emission fluxes are calculated using eqs. (4) and (5) and depend on the adopted value for . In Fig. 11 we show how the total emission and the H fluxes vary with going from 0 to 2. The H+[N ii] and H fluxes and luminosities are listed in columns 2 – 5 of Table 2. In figure 12, we compare the total emission luminosity with those of FCC046 and FCC207 (Paper 1) and with those found for elliptical and S0 galaxies by Phillips et al. (1986), Buson et al. (1993) and Macchetto et al. (1996). The linear correlation between emission-line luminosity and absolute blue magnitude in the large sample of galaxies studied by Phillips et al. (1986) strongly suggests that the dominant ionising source in ’normal’ early-type galaxies is a component of the stellar population. In these galaxies, the emission-line region is mostly concentrated in the centre, while galaxies with extended emission (Buson et al., 1993) have emission-line luminosities 10 – 100 times larger than ’normal’ Es and S0s. This increase in emission luminosity requires a second ionising source to be present. This can be photo-ionisation by young hot stars or shock-ionisation by supernova remnants in those galaxies in which recent star-formation is present. On the other hand, an active nucleus can also provide an extra source of ionisation. The dEs in our sample extend the correlation of versus for early-type galaxies with extended emission.
In FCC032, the emission is indeed extended and comprises several emission clouds. The total flux of FCC206 is about 3 times lower. In this galaxy, three separate emission clouds are clearly visible. Finally, the emission of FCCB729 is concentrated in the centre, with a flux comparable to that of FCC206. This is the only galaxy in which the emission coincides with the stellar nucleus; the other two show distinct emission clouds around the centre. Binette et al. (1994) propose photo-ionisation by post-AGB stars in an old stellar population as a source for the central emission in elliptical galaxies. Using their prescriptions, we derive central H luminosities of the order of W, i.e. a factor less than what is observed here, suggesting that other ionisation mechanisms are (also) present. If, on the other hand, all H emission were due to photo-ionisation by young stars, we can estimate the star formation rate (SFR) using the calibration between the total SFR and the H luminosity derived by Kennicutt (1983):
| (10) |
where is the standard 1 magnitude factor to correct for internal extinction and is the H luminosity expressed in W. The obtained SFR varies between M⊙ yr-1 in these galaxies (see Table 2, column 6).
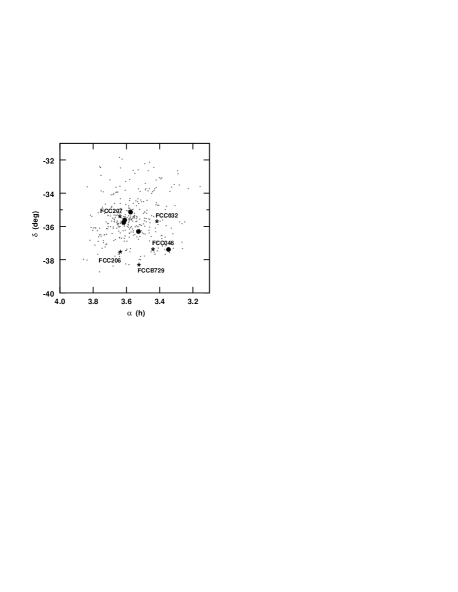
The H[N ii] luminosities can also be compared with those observed in the Local Group dEs: NGC147, NGC185, and NGC205, three companions of M31. Young & Lo (1997) have detected a central emission region and several compact emission objects in NGC185 with a total H[N ii] luminosity W. This is still an order of magnitude smaller than the H[N ii] luminosities of the dEs presented here. No extended H emission was detected in NGC205. NGC185 and NGC205 both contain a cold interstellar medium while NGC147 appears to be devoid of gas (Sage et al., 1998). Hence, the Fornax dEs presented in Paper 1 and in this paper, are comparatively rich in ionized gas. The stark contrast in environment (these dEs reside mostly in the outskirts of the Fornax cluster, see Fig. 13, while the M31 satellites are members of a rather compact group, orbiting a massive spiral galaxy) suggests that external factors, such as interactions, affect the gas-depletion rates of dwarf galaxies. N-body/SPH models of dwarf galaxies orbiting inside the Milky Way halo (Mayer et al., 2001) show that their gas reservoirs are depleted within a few gigayears after the first pericentre passage, due to both tidal stripping and star bursts occurring after each pericentre passage. These results for the Milky Way and its satellites should a fortiori be valid for M31 and its companions, given that they have been on bound orbits long enough.
4.3 H ii masses
The total mass in ionized hydrogen, , can be written as
| (11) |
with the total H luminosity, the mass of the hydrogen atom and the electron density in the gas. The hydrogen H emissivity is given by (Osterbrock, 1989)
| (12) |
in ’case B’ recombination, i.e. complete re-absorption of all Lyman photons in an optically thick nebula. Each Lyman photon emitted from a level with is later on converted to (a) Balmer photon(s) plus one Lyman photon, thus raising the flux in the Balmer lines. The production coefficient (calculated for K) is insensitive to the electron density (it changes by only 4 per cent if is raised from 1 cm-3 to cm-3) and varies as as a function of temperature. Using equations (11) and (12), the ionized hydrogen mass can be written concisely as (Kim, 1989):
| (13) |
with the distance to the galaxy.
In the following, we will assume the value cm-3 for the electron density to be in accord with most other authors and to be able to directly compare our ionized hydrogen masses with the literature (however, Spitzer (1978) advocates cm-3 as a typical value for both Galactic H ii regions with diameters of the order of 100 pc and for supernova remnants). Using equation (13), we derived ionized hydrogen gas masses between and M⊙ (see column 7 of Table 2).
5 Discussion
5.1 FCC032
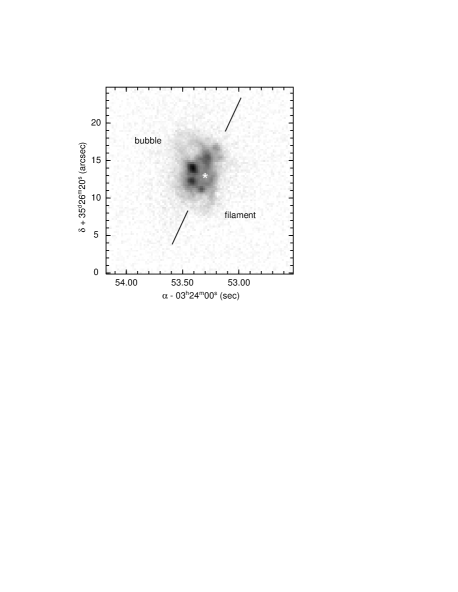
FCC032 is the most gas-rich galaxy in our sample and contains an extended ionized gas complex, about 10 arcsec ( pc) across. The bulk of the H emission in FCC032 is distributed over 4 different emission clouds, 2 of which are clearly visible in the -band. The other 2 are only visible in the pure-emission images. These clouds appear to lie on a semi-ellipse around the centre of the outer isophotes, with its major axis along the major axis of the galaxy. To the north of the centre, a superbubble is visible, with a diameter of 350 pc, capped with a pc thick shell. Towards the south, a gaseous filament (or bubble?) is extending pc away from the galaxy centre. A comparison of Fig. 8 with Fig. 5 shows that the low-surface brightness cavities in Fig. 8 cannot be due to dust-absorption. This image bears a very strong resemblance to Fig. 1, panel b, in Calzetti et al. (2004), which shows a high-resolution HST narrow-band image of the H emission in the starbursting dwarf galaxy NGC3077. The diameter of the bubble in FCC032 is comparable to those found in hydrodynamical simulations of supernova remnants (SNRs) (de Avillez & Berry, 2001) and those observed in irregular dwarf galaxies by Martin (1998), who measures (super)bubble diameters of to 2000 pc.
Such shells of ionized gas are quite common in more gas-rich and star-forming dwarf galaxies such as dwarf irregulars. Usually, these shells consist of gas that is shock-ionized by the supernova explosions and stellar winds leaving the starburst regions. In all, there appears to be a very strong energy feedback of the starburst into the interstellar medium. The strong resemblance between the shells in starbursting dwarf galaxies such as NGC3077 and the ones observed in FCC032, are strong evidence for recent or ongoing star-formation in this dE.
5.1.1 H i observations
We also observed FCC032 with the Australia Telescope Compact Array (ATCA) in May 2003 for a total of hours. The array configuration used was the EW352, and an 8 MHz-wide band was centered upon 1413 MHz. The number of channels used was 512, giving a frequency resolution of 15.6 kHz, equivalent to 3.3 km s-1 per channel. Sources 1934-638 and 0438-436 were also observed, the former for flux and bandpass calibration, and the latter for phase and gain calibration. All data reduction was carried out using MIRIAD.
We detected no H i gas in FCC032 and derived an upper H i mass limit for the galaxy using:
| (14) |
where is the H i mass, is the distance to the galaxy in Mpc, and is the integrated flux in Jy km s-1. Assuming a velocity width of the galaxy of 50 km s-1, a 3 detection would have an upper H i mass limit of M⊙.
In an H i study of 6 BCDs with a dE-like appearance, van Zee et al. (2001) found H i masses ranging between M⊙. Conselice et al. (2003) detected H i in 2 Virgo dEs with H i masses of 6 and 8 M⊙ which is around our detection limit. The non-detection of H i in FCC032 again argues for its classification as dE, rather than BCD.
5.2 FCC206
The emission in FCC206 comes from 3 separated emission clouds. The two brightest clouds are unresolved. There is also an extended emission region, about 4 arcsec ( pc) across, to the south-east of the centre. Cl2 and Cl3 are the only point sources in the -band image that coincide with an emission region. Cl1 and Cl4 could either be foreground stars or young globular clusters inside FCC206. Their blue colours, similar to the bluest Large Magellanic Cloud globular clusters, as reported by Caldwell & Bothun (1987), seem to argue for the latter interpretation although, clearly, only via spectroscopy can one shed light on the true nature of these point sources.
5.3 FCCB729
FCCB729 has an extended emission region in the centre, with faint extensions towards the west, along the galaxy’s major axis, and towards the north, along its minor axis. The emission peak coincides with the galaxy’s central nucleus.
6 Conclusions
6.1 Ionisation mechanisms
Combining the results of this paper and Paper 1, we find different ionized gas morphologies in these galaxies. This morphological diversity could also indicate a diversity in ionising processes.
All nucleated dEs in our sample, i.e. FCC046, FCC207 (Paper 1), and FCCB729 have an emission peak coinciding with their central nucleus, while the non-nucleated dEs lack such a bright central emission, suggesting a physical connection between the central emission and the presence of a nucleus. We are planning follow-up spectroscopy for these objects in order to identify the ionisation mechanism in the central regions (active galactic nucleus (AGN), starburst, post-AGB stars,…). The discovery of an AGN in a bona-fide dE would be of considerable interest for theories of the formation and evolution of dEs and their nuclei. Up to now, only one AGN in a dE has been reported: Barth et al. (2004) show evidence for a Seyfert 1 nucleus in the bright dE/faint E POX 52, its classification as either a dE or E made uncertain by its low Sérsic shape parameter , which means the galaxy is well described by a de Vaucouleurs profile, and its high luminosity. On the other hand, its position in the Fundamental Plane argues for a dE classification.
In three dEs of our sample (FCC032, FCC046 and FCC206) the emission comprises several emission clouds that argue for recent or ongoing star formation (H ii clouds, SNRs,…). In particular the ionized gas complex in FCC032 is similar to those observed in star-forming dwarf irregulars. Such dEs could be descendants of more fiercely star-forming dwarf galaxies, such as Blue Compact Dwarfs, which are not (or no longer) present in the Fornax Cluster. The fact that the number density of dEs with H or H i emission declines as a function of radius within their host cluster (Drinkwater et al., 2001; Conselice et al., 2003), indicates that environmental agents, such as ram-pressure stripping or gravitational interactions, play a very important role in the gas-depletion process.
6.2 Formation of the central nucleus
FCC206 is a non-nucleated dE but it contains 4 non-resolved star clusters, two of which show H emission. These knots have blue colours and luminosities comparable to globular clusters, which tempted Caldwell & Bothun (1987) to suggest we are witnessing the formation of a nucleus. This corroborates one currently popular hypothesis concerning the formation of nuclei in dEs, namely the merger of globular clusters that have been driven inward by dynamical friction (Oh & Lin (2000), Lotz et al. (2001)). Mouri & Taniguchi (2003) have estimated the orbital decay timescale of a typical globular cluster of mass M⊙, starting at a radius of about 1 kpc in a dwarf galaxy with a circular velocity of order km s-1 at yr. The tidal disruption timescale is much longer so a globular cluster would not dissolve before reaching the galaxy centre where it adds its stars to the nucleus. If the point sources near the centre of FCC206 are truly globular clusters belonging to this dE, their projected distances of the order of 100 pc would imply the formation of a nucleus within the next yr. Nucleated dEs, after being stripped from their stellar envelope by tidal forces during gravitational interactions, have been suggested as possible progenitors of both the recently discovered ultra compact dwarfs (Phillips et al., 2001) and of massive globular clusters like Cen (Gnedin et al., 2002) and G1 in M31 (Meylan et al., 2001).
Intermediate-mass black holes (IMBHs), with masses of the order M⊙, are predicted to grow in dense star clusters (Portegies Zwart & McMillan, 2002). According to this scenario, a massive black hole will grow in the nucleus of the host dE by the coalescence of several globular cluster IMBHs. If globular clusters contain massive black holes (e.g. Gebhardt et al. (2002), Gerssen et al. (2002)), which is still debated, and the nuclei in dE,Ns form from merging globular clusters, these nuclei could be expected to contain super-massive black holes (SMBHs). Thus understanding how the nuclei of dE,Ns form may also help us understand how SMBHs grow.
Acknowledgments
This work is based on observations collected at the European Southern Observatory, Chile (ESO Programme Nr. 072.B-0134). We would like to thank the service mode observers at Paranal for the excellent data. DM acknowledges DM acknowledges the financial support of the Bijzonder OnderzoeksFonds (BOF, Ghent University). SDR wishes to thank V. Debattista, A. Pasquali, and I. Ferreras for fruitful discussions about the origin and evolution of dE,N nuclei. WWZ acknowledges the support of the Austrian Science Fund (project P14753). This research has made use of the NASA/IPAC Extragalactic Database (NED) which is operated by the Jet Propulsion Laboratory, California Institute of Technology, under contract with the National Aeronautics and Space Administration.
References
- Barazza et al. (2003) Barazza F. D., Binggeli B., Jerjen H., 2003, A&A, 407, 121
- Barth et al. (2004) Barth A. J., Ho L. C., Rutledge R. E., Sargent W. L. W., 2004, ApJ, 607, 90
- Binette et al. (1994) Binette L., Magris C. G., Stasinśka G., Bruzual A. G., 1994, A&A, 292, 13
- Buson et al. (1993) Buson L. M., Sadler E. M., Zeilinger W. W., Bertin G., Bertola F., Danzinger J., Dejonghe H., Saglia R. P., de Zeeuw P. T., 1993, A&A, 280, 409
- Caldwell & Bothun (1987) Caldwell N., Bothun G. D., 1987, AJ, 94, 1126
- Calzetti et al. (2004) Calzetti D., Harris J., Gallagher J. S., Smith D. A., Conselice C. J., Homeier N., Kewley L., 2004, AJ, 127, 1405
- Conselice et al. (2003) Conselice C., O’Neil K., Gallagher J. S., Wyse R. F. G., 2003, ApJ, 591, 167
- de Avillez & Berry (2001) de Avillez M. A., Berry D. L., 2001, MNRAS, 328, 708
- De Rijcke & Debattista (2004) De Rijcke S., Debattista V. P., 2004, ApJL, 603, 25
- De Rijcke et al. (2003a) De Rijcke S., Dejonghe H., Zeilinger W. W., Hau G. T. K., 2003a, A&A, 400, 119
- De Rijcke et al. (2003b) De Rijcke S., Zeilinger W. W., Dejonghe H., Hau G. T. K., 2003b, MNRAS, 339, 225 (Paper 1)
- Drinkwater et al. (2001) Drinkwater M. J., Gregg M. D., Holman B. A., Brown M. J. I., 2001, MNRAS, 326, 1076
- Drinkwater & Hardy (1991) Drinkwater M. J., Hardy E. 1991, AJ, 101, 94
- Ferguson (1989) Ferguson H. C., 1989, AJ, 98, 367
- Ferguson & Binggeli (1994) Ferguson H. C., Binggeli, B., 1994, A&ARv, 6, 67
- Gebhardt et al. (2002) Gebhardt K., Rich R. M., Ho L. C., 2002, ApJ, 578, L41
- Gerssen et al. (2002) Gerssen J., van der Marel R. P., Gebhardt K., Guhathakurta P., Peterson R. C., Pryor C., 2002, AJ, 124, 3270
- Gnedin et al. (2002) Gnedin O. Y., Zhao H.-S., Pringle J. E., Fall S. M., Livio M., Meylan G., 2002, ApJ, 568, L23
- Kennicutt (1983) Kennicutt R. C., 1983, ApJ, 272, 54
- Kim (1989) Kim R. C., 1989, ApJ, 346, 653
- Lotz et al. (2001) Lotz J. M., Telford R., Ferguson H. C., Miller B. W., Stiavelli M., Mack J., 2001, ApJ, 552, 572
- Macchetto et al. (1996) Macchetto F., Pastoriza M., Caon N., Sparks W. B., Giavalisco M., Bender, R., Capaccioli M., 1996, A&AS, 120, 463
- Marcolini et al. (2003) Marcolini A., Brighenti F., D’Ercole A., 2003, MNRAS, 456, 1329
- Marlowe et al. (1999) Marlowe A. T., Meurer G. R., Heckman, T. M., 1999, ApJ, 522, 183
- Martin (1998) Martin C. L., 1998, ApJ, 506, 222
- Mayer et al. (2001) Mayer L., Governato F., Colpi M., Moore B., Quinn T., Wadsley J., Stadel J., Lake G., 2001, ApJ, 559, 754
- Meylan et al. (2001) Meylan G., Sarajedini A., Jablonka P., Djorgovski S. G., Bridges T., Rich R. M., 2001, AJ, 122, 830
- Michielsen et al. (2003) Michielsen D., De Rijcke S., Zeilinger W. W., Dejonghe H., Hau G. T. K., 2003, ApJL, 597, 21
- Moore et al. (1996) Moore B., Katz N., Lake G., Dressler A., Oemer A., Jr., 1996, Nature, 379, 613
- Mori et al. (1997) Mori M., Yoshii Y., Tsujimoto T., Nomoto K., 1997, ApJ, 479, L21
- Mori & Burkert (2000) Mori M., Burkert A., 2000, ApJ, 538, 559
- Mouri & Taniguchi (2003) Mouri H., Taniguchi Y., 2003, ApJ, 585, 250
- Oh & Lin (2000) Oh K. S., Lin D. N. C., 2000, ApJ, 543, 620
- Osterbrock (1989) Osterbrock D. E., 1989, “Astrophysics of gaseous nebulae and AGN”, University Science books, USA
- Phillips et al. (1986) Phillips M. M., Jenkins C. R., Dopita M. A., Sadler E. M., Binette L., 1986, AJ, 91, 1062
- Phillips et al. (2001) Phillips S., Drinkwater M., Gregg M., Jones J., 2001, ApJ, 560, 201
- Portegies Zwart & McMillan (2002) Portegies Zwart S. F., McMillan S. L. W., 2002, ApJ, 576, 899
- Ryden et al. (1999) Ryden B. S., Terndrup D. M., Pogge R. W., Lauer T. R., 1999, ApJ, 517, 650
- Sage et al. (1998) Sage L. J., Welch G. A., Mitchell G. F., 1998, ApJ, 507, 726
- Schlegel et al. (1998) Schlegel D. J., Finkheiner D. P., Davis M., 1998, ApJ, 500, 525
- Sérsic (1968) Sérsic J.-L., 1968, Atlas de galaxias australes, Observatorio Astronomico, Cordoba
- Spitzer (1978) Spitzer Jr., L., 1978, “Physical processes in the ISM”, John Wiley & sons, New York
- van Zee et al. (2001) van Zee L., Salzer J. J., Skillman E. D. 2001, AJ, 122, 121
- Young & Lo (1997) Young L. M., Lo K. Y., 1997, ApJ, 476, 127