Influence of UV radiation from a massive YSO on the chemistry of its envelope
We have studied the influence of far ultraviolet (UV) radiation ( eV) from a massive young stellar object (YSO) on the chemistry of its own envelope by extending the models of Doty et al. (Doty (2002)) to include a central source of UV radiation. The models are applied to the massive star-forming region AFGL for different inner UV field strengths. Depth-dependent abundance profiles for several molecules are presented and discussed. We predict enhanced column densities for more than species, especially radicals and ions. Comparison between observations and models is improved with a moderate UV field incident on the inner envelope, corresponding to an enhancement factor – at AU from the star with an optical depth –. The chemical networks of various species are explored. Subtle differences are found compared with traditional models of Photon Dominated Regions (PDRs) because of the higher temperatures and higher gas-phase H2O abundance caused by evaporation of ices in the inner region. In particular, the / ratio is not a sensitive tracer of the inner UV field, in contrast with the situation for normal PDRs: for low UV fields, the extra CN reacts with H2 in the inner dense and warm region and produces more HCN. It is found that the abundance is strongly enhanced and grows steadily with increasing UV field. In addition, the ratio / is increased by a factor of – depending on the inner UV flux. High- lines of molecules like CN and HCN are most sensitive to the inner dense region where UV radiation plays a role. Thus, even though the total column density affected by UV photons is small, comparison of high- and low- lines can selectively trace and distinguish the inner UV field from the outer one. In addition, future Herschel-HIFI observations of hydrides can sensitively probe the inner UV field.
Key Words.:
stars:formation – stars: individual: AFGL 2591 – ISM: molecules1 Introduction
A newly formed massive star in the earliest stages of evolution is surrounded by a dense envelope and is deeply embedded in its natal molecular cloud. Although highly obscured, these objects show signs of different stellar activity. Radio continuum observations reveal compact H ii regions close to the young star (e.g., Churchwell Churchwell (2002)) and molecular outflows have been observed toward numerous massive star-forming regions (Shepherd & Churchwell Shepherd (1996); Beuther et al. 2002a ). Outflows and high energy photons from the YSO can strongly affect both the physical and chemical structure of the envelope. Observational studies of massive YSO environments reveal rich molecular spectra with a large variety of species (see e.g., Blake et al. Blake87 (1987), Blake96 (1996); Turner Turner (1989); Helmich & van Dishoeck Helmich (1997); Gibb et al. Gibb00 (2000)). This molecular complexity is thought to be associated with a specific stage in the evolution of a massive young star —the so-called ‘hot core’ phase— in which selected molecules have just evaporated off the grains and drive a rich high temperature chemistry. However, there are also massive YSOs which do not show this molecular complexity, but where energetic phenomena can still cause chemical changes. Indeed, chemistry may be a unique diagnostic of the relative importance of different physical processes that occur within the YSO envelope, and a good understanding of chemistry is therefore crucial to comprehend the birth and evolution of massive stars.
Much effort has been put into the quest of understanding the physical and chemical structure of massive YSO envelopes in recent years. Van der Tak et al. (Tak1999 (1999), Tak2000 (2000)), Mueller et al. (Mue02 (2002)) and Beuther et al. (2002b ) investigated the physical structure of the envelopes around several massive young stars on – AU scales, using lines of the CS molecule and continuum data. Adopting the resulting density profiles as input, Doty et al. (Doty (2002)) calculated detailed gas temperature and chemical models to test these physical structures and, in particular, to study the chemical evolution of the high-mass star forming region AFGL . Self-consistent models of the gas and dust thermal balance, chemistry, and radiative transfer within YSO envelopes have also been performed by Doty & Neufeld (DotyN (1997)) for high-mass objects and Ceccarelli et al. (Ceccarellib (1996)) for low-mass sources. Most recently, Rodgers & Charnley (Rodgers (2003)) have modeled the chemistry of gravitationally collapsing low-mass YSO envelopes considering spatial density variations and gradual heating of the gas as well as temporal chemical evolution.
All of these models do not consider a central source of UV radiation, and include (at most) an external radiation field comparable to the average interstellar radiation field. The only exception is the work by Ceccarelli et al. (Ceccarellia (1991)), who modeled the chemistry around a low-mass YSO with central UV radiation and calculated radial abundances between – AU. Their assumed density profile was flat rather than a power-law, whereby UV photons can penetrate further. The results from such models resemble those from standard models of photon-dominated regions (PDRs), in which the UV radiation from a hot star impacts a nearby molecular cloud. In these regions the physical and chemical structure is determined by the incident FUV field ( eV eV; see e.g., Sternberg & Dalgarno Sternberg (1995), Hollenbach & Tielens Hollenbach (1999)). PDRs are characterized by bright atomic fine-structure lines, strong high CO emission, PAHs and specific molecules like CN, C2H or CO+ (e.g., Jansen et al. Jansen (1995), Störzer et al. Storzer (1996)). Thus, while there is no doubt that UV photons affect their surroundings in the later stages of massive star evolution when the envelope is being dispersed, their importance in the early stages is still unclear.
The question whether or not UV radiation plays a role in the chemistry of YSO envelopes has been a hotly debated subject for some time. Because of the limited penetration depth of UV photons (typically a few magnitudes of visual extinction ), the bulk of the envelope with mag must be unaffected. However, the presence of certain solid-state features, in particular the XCN or OCN- band at m, is often cited as an indicator of ‘energetic processing’ (e.g., Pendleton et al. Pendleton (1999)). Whether this indeed implies the presence of UV radiation or simply requires higher temperatures is still uncertain. Indeed, recent laboratory experiments by van Broekhuizen et al. (Broekhuizen (2004)) indicate that similar production efficiencies of OCN- can be obtained with thermal heating of HNCO-containing mixtures, reducing its diagnostic value. PAH emission is not detected in the earliest embedded stages, but this could be due either to freezing out of the PAHs onto grains or to the high extinction at infrared wavelengths. The aim of this paper is therefore to find other diagnostics of the inner UV field, in particular from molecular tracers whose (sub-)millimeter emission can penetrate the entire envelope.
We study here the chemistry in YSO envelopes under the influence of UV radiation from the central source as well as from an outside interstellar FUV radiation field. For this purpose, we have extended the time- and position-dependent detailed chemical model of Doty et al. (Doty (2002)) to allow the impact of a central UV field on the inner envelope. In addition, we have used the resulting abundance profiles to compute emission lines of selected species using the Monte Carlo code of Hogerheijde & van der Tak (Hogerheijde (2000)), for direct comparison with observations. Although our applications are focused on high-mass YSOs, the results should be equally applicable to the envelopes around low-mass sources, albeit that the origin of the UV radiation may be slightly different.
This paper is organized as follows. In Sect. 2, the physical and chemical model is described. The model is then applied to the envelope around AFGL and the results are discussed. We examine the highly abundant molecules , and in Sect. 3.1. In Sect. 3.2 we discuss the ‘PDR-related’ elements and ions , and . The reactive ions , recently observed toward the high-mass star forming region W IRS by Stäuber et al. (Stp (2004)), , and , which were also studied by Fuente et al. (Fuente (2003)) in PDRs, are examined in Sect. 3.3. Hydrides and ions like , , and are discussed in Sect. 3.4. These are important species for future space-borne observatories like Herschel where they will be observable with the high resolution spectrometer HIFI (de Graauw & Helmich HIFI (2001)). In Sect. 3.5, -bearing molecules are studied since they are thought to be sensitive to UV radiation and readily observable with existing instrumentation. Line emission of and is calculated and the results are presented and discussed in Sect. 4. We conclude by summarizing our results in Sect. 5.
2 Model


In order to calculate the abundances of each species at a certain time and distance from the central object, a physical and thermal model of the envelope is needed and initial conditions, i.e., initial abundances, have to be assumed. We adopt the values provided by Doty et al. (Doty (2002)) and refer to that paper and references therein for more detailed information. However, a brief outline is given in this section.
2.1 Physical and thermal model
Van der Tak et al. (Tak1999 (1999), Tak2000 (2000)) fitted their observations of AFGL with a spherical power-law density distribution ( cm-3, AU, ) by modeling CS emission lines over a large range of critical densities and fitting the continuum emission. Our model covers a region that extends from AU cm to AU cm. The dust temperature profile was determined from a self-consistent solution of the continuum radiative transfer problem. As shown by Doty & Neufeld (DotyN (1997)) and Doty et al. (Doty (2002)), the assumption that the gas and dust temperatures are equal, , holds throughout most of the envelope because of the high density. However, at the inner edge, photoelectric heating and other heating processes proportional to the radiation field (e.g., collisional de-excitation of vibrationally excited H2 pumped by FUV radiation) can become important (Tielens & Hollenbach Tielens (1985), Sternberg & Dalgarno Sternberg89 (1989)). Comparison of these heating rates with the cooling rate due to gas-dust collisions (Hollenbach & McKee HoK (1989)) shows that the difference in gas and dust temperatures is only a few K for low FUV fields (; see Sect. 2.2 and 2.3 for definition). For higher FUV fields, the gas temperature becomes significantly higher, with values up to a few thousand K at the edge.
Figure 1 illustrates the gas temperature in the inner region computed taking the above-mentioned processes into account for values of up to . The gas temperature drops quickly within and equals the dust temperature further in the cloud. The dust temperature —in particular the freeze-out radius ( K)— is not affected beyond , since the FUV photons are quickly re-distributed in frequency and the total luminosity of the system is unchanged (Doty & Leung DotyL (1994)). The physical structure is kept constant with time. Following the arguments summarized in van der Tak et al. (Tak1999 (1999)), we assume a distance to AFGL of kpc.
2.2 Chemical model
The chemical model is based upon the UMIST gas-phase chemical reaction network (Millar et al. Millar (1997)) and basically solves the equations for molecular evolution given by
| (1) |
where is the number density of species ; and are the rate coefficients for production and destruction of the given species. The main inputs of the model are the temperature and density distribution, the cosmic ray ionization rate s-1 for AFGL , and the strength of the FUV field with respect to the average interstellar flux at eV of erg cm-2 s-1. The model then calculates the time- and depth-dependent chemistry for species and reactions. The chemical abundances are calculated over a range of radial grid points, providing a time- and space-dependent chemical evolution. The approximate effects of freeze-out onto dust grains are included by initially depleting certain species below K. The effects of changing the cosmic-ray ionization rate have been investigated by Doty et al. (Doty (2002)) and are not further discussed in this paper.
2.3 UV radiation field
In our spherical model, the envelope can be irradiated by UV photons from the inside by a central source and from the outside by the interstellar radiation field (ISRF). The UV flux is characterized in units of (see Sect. 2.2). We therefore denote the enhancement factor due to the inner source and that connected to the ISRF , assuming the same spectral energy distribution. The rates for the photodissociation and photoionization reactions can then be approximated by (see also van Dishoeck Ewine (1988))
| (2) |
where and are fit parameters and and are the attenuation factors, approximated by , the total visual extinction . The values of at each depth are calculated from the total hydrogen column using the conversion factor cm-2, constrained from observations of translucent clouds by Rachford et al. (Rachford (2002)). For simplicity we start our model with an attenuation of at AU and vary the inner UV flux from to . We have also carried out different models by varying from up to but the changes of the total radial column densities due to different ISRF fluxes are very small. The standard value for the ISRF flux in our models is therefore .
To obtain a rough indication of the inner UV field, we assume a luminosity of L☉ and an effective temperature of K for the central source as suggested by van der Tak et al. (Tak1999 (1999)). A large fraction of this luminosity may be due to accretion (Osorio et al. Osorio (1999)). This luminosity and stellar temperature would yield at AU in the absence of any absorption. Hence an estimated UV field strength of corresponds to a dust optical depth at this distance. A first question is whether such a relatively low value for corresponds to a mass that is high enough to provide a typical mass accretion rate for high mass YSOs of – M☉ yr-1 (e.g., Behrend & Maeder Behrend (2001), McKee & Tan McT (2003)). Using the relation between the total visual extinction and the hydrogen column density given earlier in this Sect., mag corresponds to a column density of cm-2 or a density of cm-3 at AU. Assuming spherical free fall inflow and a central mass of M☉, this density would be consistent with an accretion rate of (e.g., Shu et al. Shu (1987)) M☉ yr-1. It is expected that these high accretion rates ‘choke off’ an incipient H ii region (Walmsley Walmsley (1995)) and that the hydrogen-ionizing photons ( eV) cannot travel far from the protostar before being absorbed by infalling matter. The result would be a small Strömgren sphere around the central protostar, with the non-ionizing photons allowed to escape to larger distances. Both the luminosity and effective temperature of the radiation are actually expected to evolve during the protostellar stage (e.g., McKee & Tan McT (2003)), but such detailed modeling is beyond the scope of this study. Note also that the geometry of this dust and inflowing material is not known and is therefore not included in our envelope model. If our model were extended inward to account for this extra material, only the first few radial positions in our grid up to would change.
Our models are spherically symmetric and do not include geometrical effects like outflow cones or clumps in the central regions that could allow UV photons to travel further into the envelope. The effects of UV radiation escaping through outflow cones and scattering back on the surrounding envelope have been studied by Spaans et al. (Spaans (1995)) for the case of low-mass YSOs. Finally, it should be mentioned that the photoreaction rates (2) are fitted for plane parallel models but are applied to spherical models. In spherical symmetry, the FUV photons can penetrate further on average, but the gas temperature is somewhat lower assuming the same density structure (Störzer et al. Storzer (1996)). The authors conclude that spherical geometry only becomes important for clouds with cm -3 exposed to FUV fields with intensities and a H2 column density of less than cm-2. We therefore neglect these effects.
3 Chemistry results
| Species | N [cm-2] | Ratio | N [cm-2] | Ratio | N [cm-2] | Ratio | N [cm-2] | Ratio |
| H | 4.5(19) | 5.9 | 1.3(20) | 17.6 | 2.3(20) | 30.1 | 1.4(21) | 187.1 |
| C | 1.0(17) | 95.2 | 1.9(17) | 172.7 | 4.4(17) | 400.8 | 8.0(17) | 727.2 |
| N | 7.4(16) | 2.1 | 1.4(17) | 3.9 | 2.8(17) | 8.0 | 4.9(17) | 14.0 |
| O | 5.7(18) | 1.0 | 6.1(18) | 1.1 | 7.0(18) | 1.2 | 8.8(18) | 1.6 |
| CH | 1.6(13) | 1.7 | 3.7(13) | 3.9 | 7.7(13) | 7.8 | 1.7(14) | 18.2 |
| CH2 | 1.2(14) | 59.3 | 2.0(13) | 9.6 | 1.7(13) | 8.3 | 6.6(13) | 32.1 |
| CH3 | 1.6(14) | 1.1 | 1.6(14) | 1.1 | 1.4(14) | 1.0 | 1.4(14) | 1.0 |
| OH | 1.2(16) | 1.3 | 1.6(16) | 1.7 | 2.0(16) | 2.1 | 1.2(16) | 1.3 |
| C2 | 1.2(14) | 4.8 | 1.0(14) | 3.9 | 1.5(14) | 5.7 | 1.7(14) | 6.8 |
| HCN | 1.4(17) | 238.6 | 6.3(16) | 105.5 | 8.2(15) | 13.7 | 4.7(14) | 0.8 |
| HCO | 1.8(12) | 1.0 | 1.7(12) | 0.9 | 1.5(12) | 0.9 | 1.3(12) | 0.7 |
| OCS | 4.0(14) | 1.5 | 1.1(14) | 0.4 | 7.1(13) | 0.3 | 4.9(13) | 0.2 |
| CN | 3.1(14) | 5.6 | 4.2(14) | 7.5 | 1.8(14) | 3.3 | 9.2(13) | 1.7 |
| CS | 1.0(15) | 2.4 | 7.9(14) | 1.9 | 4.2(14) | 1.0 | 3.7(14) | 0.9 |
| HCS | 3.3(14) | 34.1 | 1.1(13) | 1.1 | 1.4(11) | 1(-2) | 1.5(11) | 2(-2) |
| C2H | 1.5(15) | 221.4 | 1.4(14) | 20.5 | 8.5(13) | 12.7 | 7.3(13) | 10.8 |
| C3 | 2.9(13) | 1.6 | 3.0(13) | 1.7 | 2.9(13) | 1.7 | 2.2(13) | 1.2 |
| C3N | 2.3(13) | 1.4 | 1.8(13) | 1.1 | 1.7(13) | 1.0 | 1.6(13) | 1.0 |
| C | 7.0(12) | 1.3 | 7.3(12) | 1.4 | 6.8(12) | 1.3 | 5.9(12) | 1.1 |
| CN | 6.3(11) | 2.0 | 3.2(11) | 1.1 | 2.2(11) | 0.7 | 1.9(11) | 0.6 |
| HNC | 2.0(15) | 2.7 | 1.2(15) | 1.6 | 7.3(14) | 1.0 | 6.5(14) | 0.9 |
| HC3N | 4.6(14) | 1.6 | 3.0(14) | 1.0 | 2.9(14) | 1.0 | 2.9(14) | 1.0 |
| C2S | 6.6(14) | 14.0 | 1.5(14) | 3.2 | 9.6(13) | 2.1 | 1.2(14) | 2.6 |
| C3S | 2.6(13) | 4.2 | 1.5(13) | 2.4 | 1.1(13) | 1.8 | 6.6(12) | 1.1 |
| CH2CN | 1.3(16) | 1074.3 | 6.8(15) | 566.0 | 6.2(14) | 51.9 | 7.4(12) | 0.6 |
| CH3CN | 8.9(13) | 28.7 | 6.1(13) | 19.9 | 1.2(13) | 3.8 | 2.7(12) | 0.9 |
| H2CS | 5.3(14) | 0.4 | 3.9(14) | 0.3 | 3.0(14) | 0.2 | 2.2(14) | 0.1 |
| H+ | 4.0(13) | 1.0 | 7.1(13) | 1.8 | 3.8(15) | 93.4 | 2.4(16) | 612.7 |
| C+ | 3.6(14) | 1.2 | 7.2(16) | 229.1 | 1.9(17) | 634.7 | 1.0(18) | 3220.0 |
| O+ | 3.1(08) | 1.3 | 7.9(09) | 31.4 | 6.0(11) | 2389.0 | 6.3(12) | 2.5(4) |
| S+ | 3.5(14) | 164.9 | 1.2(15) | 554.6 | 3.3(15) | 1558.5 | 8.4(15) | 3909.8 |
| CH+ | 3.0(09) | 495.9 | 1.5(11) | 2.5(4) | 3.3(12) | 5.4(5) | 2.4(13) | 4.0(6) |
| CH | 2.4(09) | 15.9 | 1.3(11) | 826.8 | 2.4(12) | 1.6(4) | 6.5(12) | 4.2(4) |
| OH+ | 2.2(09) | 1.1 | 1.5(10) | 7.3 | 1.3(12) | 651.9 | 1.8(13) | 8931.1 |
| H3O+ | 9.0(13) | 1.3 | 8.1(13) | 1.2 | 7.0(13) | 1.1 | 6.2(13) | 0.9 |
| CO+ | 3.1(08) | 1.5 | 4.9(10) | 243.1 | 5.5(11) | 2728.0 | 4.5(11) | 2244.5 |
| HCNH+ | 3.2(13) | 30.5 | 2.3(13) | 22.2 | 2.1(12) | 2.0 | 6.1(11) | 0.6 |
| HCO+ | 4.1(14) | 1.1 | 4.3(14) | 1.2 | 5.7(14) | 1.5 | 3.9(14) | 1.0 |
| HOC+ | 1.1(10) | 27.0 | 3.4(10) | 87.7 | 1.6(12) | 4168.1 | 4.5(11) | 1138.3 |
| NO+ | 2.6(12) | 2.8 | 3.2(12) | 3.5 | 1.9(12) | 2.1 | 1.0(12) | 1.1 |
| HCS+ | 1.9(12) | 3.8 | 1.8(12) | 3.5 | 9.5(11) | 1.9 | 7.8(11) | 1.5 |
| SO+ | 6.5(12) | 24.3 | 1.3(13) | 47.1 | 5.8(12) | 20.8 | 1.4(12) | 5.2 |
| CO | 3.9(19) | 1.0 | 3.9(19) | 1.0 | 3.8(19) | 1.0 | 3.7(19) | 1.0 |
| H2O | 4.5(18) | 1.1 | 4.2(18) | 1.0 | 3.6(18) | 0.8 | 3.0(18) | 0.7 |
| CO2 | 1.2(18) | 0.9 | 1.2(18) | 0.9 | 1.1(18) | 0.9 | 1.1(18) | 0.9 |
| N2 | 7.3(18) | 1.0 | 7.3(18) | 1.0 | 7.3(18) | 1.0 | 7.2(18) | 1.0 |
-
a(b) means . The ratio is the enhancement relative to the model without an inner UV source, i.e.
We have modeled the envelope around AFGL with different UV fluxes at the inner boundary and compared our results to those of Doty et al. (Doty (2002)), representing the model in this paper. Photodissociation and photoionization processes are generally fast for the main species in the regions where they are significant ( s-1) so that the effects are not significantly different for and years. The results are therefore presented for years, the chemical age of AFGL as proposed by Doty et al. (Doty (2002)). Total column densities for a selection of species are predicted in Table 1. The selection criteria are: (i) the species have a column density larger than cm-2; (ii) the relative difference of the total column densities with and without an inner UV source is more than %; and (iii) the species are observable with present or future instrumentation. In addition we show the abundances of the model predictions for basic molecules (other than ) such as , , and at the bottom of Table 1. In general, the species whose abundances are particularly enhanced are the same as those found in traditional PDR models, i.e., radicals and ions, and their chemically related species. The reason that most ratios given in Table 1 are is that small differences in very abundant species like CO or H2O can make large differences in much less abundant species.
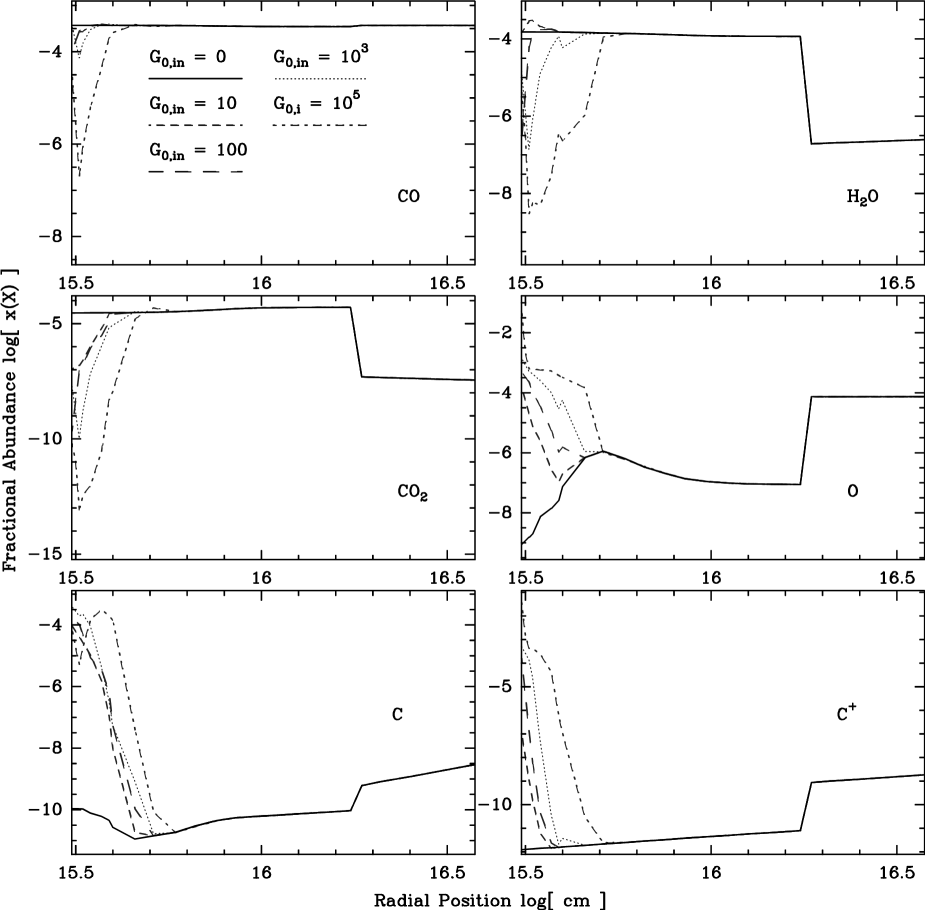
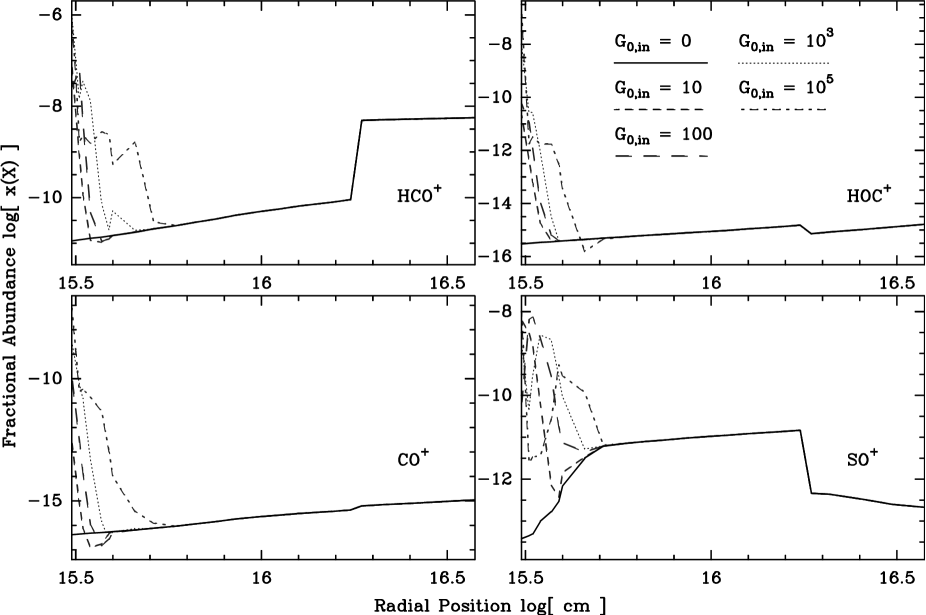
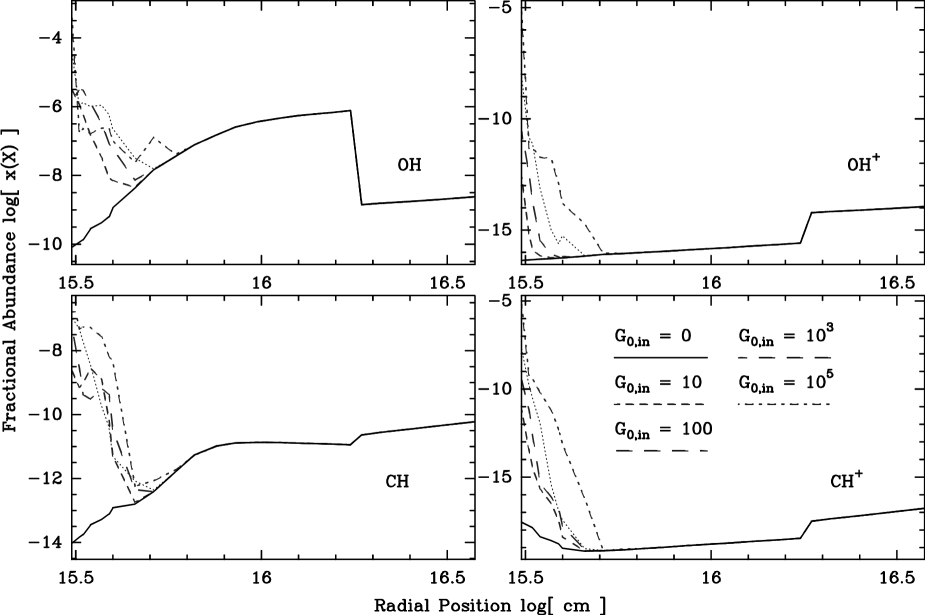
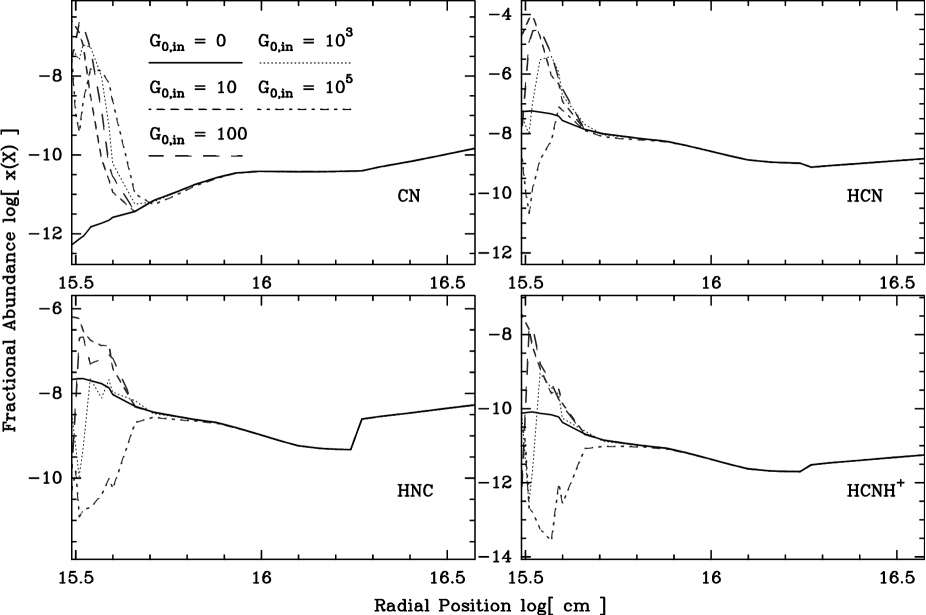
In Fig. 2, the column densities for various molecules as functions of are presented, normalized to the values for . Figs. 3 to 6 show the depth-dependent fractional abundances for selected species in the inner AU. The radial scale is taken to be somewhat smaller in these plots than the full extent of the envelope ( AU, ) in order to emphasize the region which is influenced most by the inner UV field (see Doty et al. Doty (2002) for variations in the outermost regions). Even for the highest values of , the effects of the UV radiation do not penetrate beyond the freeze-out radius at K ().
Several molecules shown in Figs. 3 to 6 have local minima or maxima at certain positions (for example H2O at for or HCO+ at for ). These peaks are not caused by numerical artifacts but are due to different chemical affects, some of which are explained in the following sections.
Table 1 lists the radial column densities . For comparison of observed emission lines to model-predicted column densities, beam-averaged column densities defined by / have to be calculated, where is the impact parameter and is the beam response function. Beam averages are centered on the source whereas the calculated radial column densities are through the cloud center. , generally has slightly lower values than for typical observing beams. Rather than calculating , however, we have computed the actual line fluxes by solving the equations of molecular excitation and radiative transfer throughout the envelope and convolving the emerging emission with the telescope beam (see Sect. 4).
3.1 Basic molecules: , , and
As seen in Table 1 and Fig. 3, the total radial column densities of the high abundance molecules , and are not affected significantly by an inner UV field. The major destruction mechanism for these molecules is photodissociation. Measurable changes can only be seen for relatively high UV fields in the dense region within AU from the central source. For another efficient destructive reaction is the production of and through reactions with . The slight increase in the relative abundance of at cm for and is caused by the protonation of through which leads to and , and by the high-temperature reaction of molecular hydrogen with , also producing . All reactants are slightly increased by a moderate UV field, enough to speed up these reactions. At cm the relative abundance of is the same for all UV fields. This is slightly closer to the star than the enhancement of for high UV fields (see also Fig. 5) and since is the dominant reaction to produce gas-phase , the enhancement of leads to the small increase of between – cm for . The sudden decrease of the and abundances at cm ( K) is due to the effects of their freeze-out onto grains (see Doty et al. Doty (2002) for more information). The abundance minima of H2O, CO and CO2 for are due to the higher gas temperature for these high FUV fields: the abundances are rising again toward the protostar.
is a highly abundant molecule in our model with a column density of the order of cm-2. Boonman et al. (BoonmanCO2 (2003)) derive a total column density of cm-2 for AFGL from observations with the Infrared Space Observatory. Even high UV fields do not reduce much . This overprediction of has also been discussed by Doty et al. (Doty (2002)), and our new models add little to this discussion: enhanced UV photodissociation does not solve the problem.
3.2 PDR-related species: , , and
Fig. 3 also shows the dominant line emitters, and thus coolants, in a PDR: , and . Photodissociation of is the main source for both carbon and oxygen. The major destruction mechanism for carbon in a low () UV field is the reaction with leading to and atomic hydrogen. Photoionization of carbon becomes important for higher UV fields and is the main production channel of . The somewhat unexpected jump of at cm can be explained by the freeze-out of : the main destroyer of at this distance is depleted onto grains below K. The relatively high atomic oxygen abundance for K is due to our initial elemental abundance, consistent with Meyer et al. (Meyer (1998)) for diffuse clouds.
The main production channel for is not the photoionization of atomic oxygen (which cannot occur for photon energies less than eV) but the reactions and .
The observed column density of atomic carbon toward AFGL ( cm-2, see Doty et al. Doty (2002)) can be reproduced with a UV field of . The high abundances ( cm-2) are consistent with a UV field of . However, as discussed in Sect. 4, the observed antenna temperatures require high abundances of C and C+ to be extended over a larger region than just the inner few hundred AU. Thus, these species likely trace the outer radiation field, , rather than an inner UV field.
3.3 Reactive ions
From Table 1, it is seen that is much more affected by the strength of the UV field than . The reason for this is that in our models is basically formed by the two reactions and , which are both highly dependent on the ionization fraction and thus on the incoming UV field. In contrast more production channels are possible for , e.g., , thus more than is produced. Another reason for the much higher abundances of is the jump at K where H2O freezes out: since is the main destruction channel, much more remains in the region below K. Water is important, however, to produce , hence the HOC+ abundance is lower once water has depleted onto grains.
The / abundance ratios predicted by our chemical models are in the range of – which is at the upper limit of the ratios observed toward PDRs. Fuente et al. (Fuente (2003)) reported ratios of – toward the reflection nebula NGC — the lowest ratio measured so far — up to toward the planetary nebula NGC . Our models only reproduce such low values for . However, the observed peak values of HOC+ toward several PDRs are in the range of the predicted column densities for –.
Van der Tak et al. (Tak1999 (1999)) find HCO+ abundances of the order of , which are well fitted by our models with . Unfortunately, there are no observations of toward AFGL to date. The question therefore is whether these low ratios also hold in massive star-forming regions.
For low UV fields the reactive ion is produced mainly by and . For higher UV fields the reaction is the most efficient to build up . Its destruction for all UV fields is mainly by reactions with . The most efficient pathway to is . Its destruction is caused mainly by dissociative recombinations with electrons.
3.4 Hydrides

As in traditional PDR models, the abundances of unsaturated hydrides are strongly increased by UV radiation. and CH3 are the species that are the least affected by the inner UV field. on the other hand is enhanced by more than a factor of even for a moderate UV field and its column density grows steadily with increasing UV field strength. To date, there are observations only of for AFGL reporting (see Doty et al. Doty (2002)). This column density is well fitted by our models for the region K. Our models, however, produce much more OH in the warmer, inner region (see Fig. 5). Without UV radiation, is mainly produced through collisions of atomic oxygen with molecular hydrogen in the inner warm part. In the presence of a UV field, photodissociation of H2O becomes the dominant production route. The OH destruction is primarily through , and for very high UV fields () the photodissociation of becomes important too. For UV fields with , is efficiently produced in the warm inner regions by reactions of with molecular hydrogen. For smaller UV fields, is produced mainly by the reaction . For higher UV fields, photoionization of becomes the main mechanism for production. In all our models, is mainly destroyed in collisions with H2.
For smaller UV fields, is mainly destroyed through and built up by the reverse reaction. is primarily produced by collisions of singly ionized oxygen with molecular hydrogen. The jump at cm is due to the increase of atomic oxygen. Charge exchange reactions then enlarge the abundances, in particular the reaction . is most efficiently reduced in collisions with . and play a crucial role in the gas-phase chemistry of water.
Several species such as and are not only excellent tracers of enhanced UV fields but also of the strength since their abundances rise steadily with increasing field strengths. The fact that C+ can also be enhanced by an outer UV field reduces its value as a diagnostic, however. An alternative tracer is the / ratio, which is – times higher if the inner UV is included. The column density ratio is shown in Fig. 7 as a function of . Similar arguments hold for other hydrides such as CH2 and CH which are less easily observable. Hydrides like CH and are also important for building complex hydrocarbons (see e.g., van Dishoeck & Hogerheijde Vhog (1999)); indeed, a rich carbon chemistry has been observed in PDR layers (e.g., Hogerheijde et al. Hogerheijde95 (1995), Teyssier et al. Teyssier (2004)).
It is somewhat surprising that CH3 is much less affected by the inner UV field than, e.g., CH2. This is only partly true since the production and destruction mechanisms of CH3 do change by the impact of the inner UV field. Without the inner UV source CH3 is efficiently built up by the reaction He+ CH3OH OH+ CH3 He. With the onset of an inner UV field, CH3 is mainly the photodissociation product of species like CH3CN, CH4 and CH3OH. CH3 forms H2CO when it reacts with O, which is the main destruction channel. Since an inner UV field clearly enhances atomic oxygen (see Fig. 3), this reaction is very efficient deeper in the cloud where CH3 is destroyed fast. Thus, although CH3 is first enhanced in the very inner region, it becomes less abundant deeper in the cloud. This leads to an average radial column density more or less equal to that where no inner UV radiation is considered.
3.5 -bearing species
The chemistry of and is thought to be strongly affected by UV radiation and the / ratio has been proposed to be a good tracer of PDR chemistry (Fuente et al. FuenteCN (1995), Jansen et al. Jansen (1995)). Since our envelopes are more extended than normal PDRs, we predict lower CN/HCN ratios than those observed in PDRs where the ratio is typically in the shielded regions and in regions exposed to UV radiation. Observations of and toward AFGL confirm these low ratios. The observed abundance of (see Doty et al. Doty (2002)) is well fitted with –. The chemistry is discussed in detail by Doty et al. (Doty (2002)), especially the situation in the warm gas-phase ( K) region where a jump has been suggested from to by Boonman et al. (BoonmanHCN (2001)). The observed HCN column density is reproduced in our models for within a factor of , whereas it is underproduced in models without an inner UV field. Alternatively, the model could be extended inward to the radius where high temperature chemistry may enhance the abundances. However, a closer position to the star also means an increased UV field, and is more vulnerable to photodissociation. UV radiation may therefore be an explanation for the relatively high observed abundances. The / ratio is only enhanced for . For lower UV fields, the ratio is even smaller than that without UV irradiation (see also Fig. 7). Hence, the / ratio is not a good UV tracer for this high mass star-forming region, in contrast with the situation for PDRs.
Fig. 6 shows the radial dependences of the abundances of , , and the reactive molecular ion . In the warm high density regime, the production of through collisions of with H2 is slightly more efficient than photodissociation of , hence more is produced than . Collisions of with , however, produce water and , which can recombine to form or . Since this is the main path to in our models, more is produced compared to . is generated through , whereas the association of with plays a minor role. and are also photodissociated to . No grain surface production and subsequent evaporation of CH3CN are assumed. The following network is valid for UV-affected CN chemistry in our models:
The / ratio is – for low UV fields. The ratio is approximately unity for and slightly higher () for high UV fields (). The variation of the ratio is mainly due to the changing abundances. The observed HNC/HCN ratio varies strongly from source to source but is generally . For AFGL , the observed ratio is /, which is in good agreement with a low UV field.
4 Calculated line emission
The temperature, density and abundance profiles presented in Sect. 3 have been used as input to the excitation and Monte Carlo radiative transfer code of Hogerheijde & van der Tak (Hogerheijde (2000)) to compute the emerging line intensities. The intrinsic (turbulent) line profile is taken to be a Gaussian with a Doppler parameter ( width) of km s-1, independent of radius. The line profiles are convolved to an appropriate telescope beam size. The low-lying transitions trace primarily the low density outer YSO envelope whereas the higher-lying lines are only excited in the high density inner envelope. Thus, the intensities of the higher-lying transitions of species like or , whose abundances are affected by UV irradiation, are expected to be enhanced and the effect on the lines ratios should be observable.
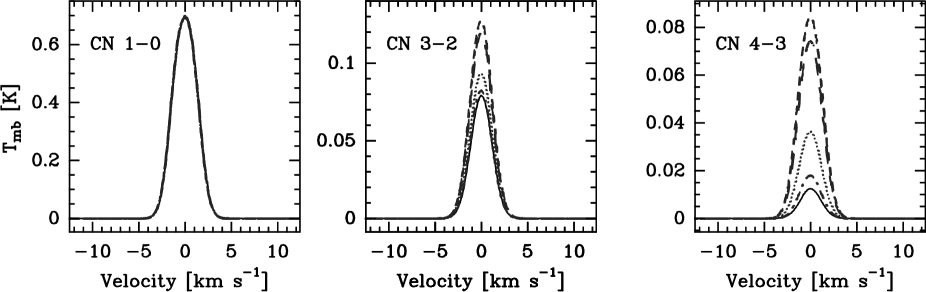
4.1 CN and HCN emission lines
Fig. 8 shows emission lines of for different inner UV fields. While the lowest transition – line has the same intensity for all UV fields, the higher transitions show clear differences for different UV strengths. The – line intensity is increased by a factor of for and . The enhancement is even more noticeable in the – transition. The lines for and , respectively, are times stronger than that for , which in turn is approximately twice as strong as that for and . Since these enhancements are clearly larger than the typical % observational errors, the impact of central UV photons on the inner envelope is predicted to have measurable consequences for higher CN transitions. The line ratios for are –/–/– //, whereas for they are approximately // and for CN –/–/– //.
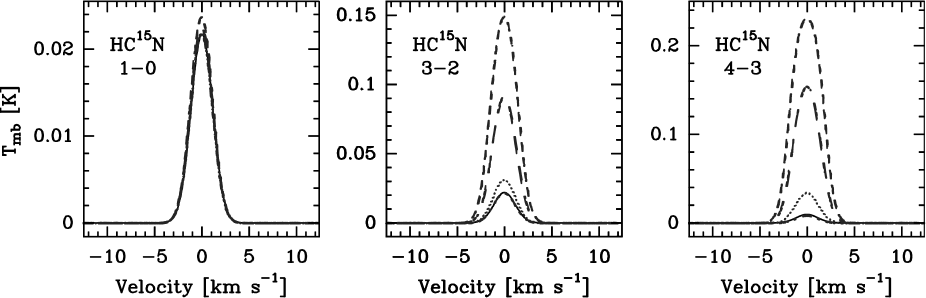
In Fig. 9, it is seen that the higher-lying lines are similarly enhanced for a moderate UV field with . The optically thin isotope is modeled, since the synthetic lines are optically thick and therefore not ideal to show the effects of inner UV enhancement (see also the discussion by van der Tak et al. Tak1999 (1999) on HCN modeling). The / ratio is taken to be (Wilson & Rood Wiro (1994)). The line is enhanced by a factor of and the line a factor of for moderate UV fields. For the lowest transition, all line intensities are the same, except that for , which is approximately % higher and thus not distinguishable from the other lines if calibration errors are taken into account. The intensity ratios for are –/–/– //, for –/–/– // and for they are approximately //.
Line intensities have also been calculated for an outer UV field of –. It is found, however, that the CN and HCN lines are not very sensitive to the outer UV field due to the much lower densities in those regions, with enhancements in line intensities of only –%. Thus, the and lines trace the central UV field rather than the outer interstellar radiation field. This is in contrast with species such as C and C+, whose transitions are readily excited at low densities in the outer envelope (see below). High spatial resolution interferometry observations of both low- and high-J CN and HCN lines should be able to directly constrain the extent over which the inner and outer UV field affect the chemistry.
4.2 C and C+ emission lines
In addition to the molecular lines mentioned above, the line profiles of the fine-structure transitions of and C+ have been calculated. Although the abundances of both species are strongly enhanced by the inner UV field, the resulting antenna temperatures are much lower than observed by van der Tak et al. (Tak1999 (1999)). Thus, even though the column densities including an inner UV field match those derived from observations, the beam dilution of the inner region is so large that the resulting fluxes fall short by – orders of magnitude. Therefore, models have also been run in which the outer radiation field is enhanced above the average ISRF. Such outer enhancements could be due to other nearby young stars. For example, for AFGL a nearby H ii region ( AU projected distance) has been found (see e.g., van der Tak et al. Tak1999 (1999), Trinidad et al. Trinidad (2003)), whose exciting star could illuminate (part of) the outer AFGL envelope. An outer UV field with and an enhanced gas temperature due to photoelectric heating matches the [C I] GHz observations best. Since C+ is mainly produced through photoionization of atomic carbon (ionization energy eV), the same issue may be true for the [C II] line.
5 Summary and conclusions

We have extended the detailed chemical models of Doty et al. (Doty (2002)) to study the influence of UV irradiation from AFGL on the chemistry in the surrounding envelope on – AU scales. From Figs. 3 to 6, it is seen that an inner UV flux affects only the region within – AU from the star. The species whose abundances are most enhanced are radicals and ions, similar to the case of normal PDRs. However, the chemistry differs from that in normal PDRs in various details owing to the higher temperature and higher H2O abundance in the inner YSO envelope.
By comparing our results to those of Doty et al. (Doty (2002)), we find that agreement with the observed column densities is improved with a moderate UV field of –. This is seen quantitatively in Fig. 10, which shows the absolute differences between the model results and the observations, , summed over all species. Species like CN and HCN are particularly improved with a modest UV field. However, the high temperature chemistry of in the inner region still needs further investigation. The / ratio is found not to be a good tracer for for AFGL . For low UV fields, the extra CN reacts with H2 to HCN in the warm, dense region thus enhancing HCN more than CN, in contrast to typical PDRs. However, enhanced intensities of the – and – lines of and are predicted compared with the lower lines, which should be observable both with single dishes and with submillimeter interferometers. Another strong indicator for enhanced UV fields is the / ratio with values between and . Neither species can readily be observed with ground based observatories, but are excellent targets for Herschel-HIFI.
Most other species have their maximum column density at lower UV fields (see Table 1). This is due to different preferred chemical networks for each strength of the UV field; in particular, many species are photodissociated away for very high UV fields. Like in Doty et al. (Doty (2002)), the column density is overpredicted by a factor of in our model. In this sense, UV irradiation from the central star proves not to be an efficient destruction mechanism for . Impulsive heating events and X-ray chemistry may destroy carbon dioxide more efficiently.
Our model results indicate strongly that UV radiation from the high mass YSO AFGL cannot be neglected in the surrounding envelope chemistry. The inferred value of – for an inner UV field is reasonable for a young massive star like AFGL and the corresponding column density and dust opacity can be justified by the mass inflow rate even though we do not present a fully self-consistent model (see Sect. 2.3). Our models assume a spherical symmetry and neglect geometric effects. High spatial resolution data of species like CN should also be able to establish the importance of non-spherical effects, such as the escape of UV photons through the outflow cones.
In recent years it has become clear that YSOs are also strong X-ray emitters. The observed X-ray luminosities range from approximately 1028.5 to 1033 erg s-1 (Feigelson & Montmerle Feig (1999), Preibisch Preibisch (1998)). X-rays can also penetrate deeper into clouds than UV photons due to smaller absorption cross sections at high energies. Most recently Doty et al. (Doty04 (2004)) suggested that X-rays may be responsible for a higher ionization rate in the low-mass hot core IRAS –. It is therefore important to also investigate the effects of X-rays on the chemistry in the envelopes of YSOs and such work is in progress (Stäuber et al. 2004, in preparation).
6 Acknowledgments
The authors are grateful to Michiel Hogerheijde and Floris van der Tak for the use of their Monte Carlo code. We thank the anonymous referee for the valuable comments. This work was partially supported under grants from The Research Corporation (SDD). Astrochemistry in Leiden is supported by the Netherlands Research School for Astronomy (NOVA) and by a Spinoza grant from the Netherlands Organization for Scientific Research (NWO).
References
- (1) Bakes, E. L. O. & Tielens, A. G. G. M. 1994, ApJ, 427, 822
- (2) Behrend, R. & Maeder, A. 2001, A&A, 373, 190
- (3) Beuther, H., Schilke, P., Sridharan, T. K., Menten, K. M., Walmsley, C. M., & Wyrowski, F. 2002a, A&A, 383, 892
- (4) Beuther, H., Schilke, P., Menten, K. M., Motte, F., Sridharan, T. K., & Wyrowski, F. 2002b, ApJ, 566, 945
- (5) Blake, G. A., Sutton, E. C., Masson, C. R., & Phillips, T. G. 1987, ApJ, 315, 621
- (6) Blake, G. A., Mundy, L. G., Carlstrom, J. E., Padin, S., Scott, S. L., Scoville, N. Z., & Woody, D. P. 1996, ApJ, 472, L49
- (7) Boonman, A. M. S., Stark, R., van der Tak, F. F. S., van Dishoeck, E. F., van der Wal, P. B., Schäfer, F., de Lange, G., & Laauwen, W. M. 2001, ApJ, 553, L63
- (8) Boonman, A. M. S. & van Dishoeck, E. F. 2003, A&A, 403, 1003
- (9) Boonman, A. M. S., van Dishoeck, E. F., Lahuis, F., & Doty, S. D. 2003, A&A, 399, 1063
- (10) Ceccarelli, C., Saraceno, P., & Zerilli, M. 1991, Memorie della Societa Astronomica Italiana, 62, 859
- (11) Ceccarelli, C., Hollenbach, D. J., & Tielens, A. G. G. M. 1996, ApJ, 471, 400
- (12) Churchwell, E. 2002, ARA&A, 40, 27
- (13) de Graauw, T. & Helmich, F. P. 2001, in Proc. ESA Symp., The Promise of the Herschel Space Observatory, ESA SP-460, 45
- (14) Doty, S. D. & Leung, C. M. 1994, ApJ, 424, 729
- (15) Doty, S. D. & Neufeld, D. A. 1997, ApJ, 489, 122
- (16) Doty, S. D., van Dishoeck, E. F., van der Tak, F. F. S., & Boonman, A. M. S. 2002, A&A, 389, 446
- (17) Doty, S. D., Schöier, F. L., & van Dishoeck, E. F. 2004, A&A, 418, 1021
- (18) Feigelson, E. D. & Montmerle, T. 1999, ARA&A, 37, 363
- (19) Fuente, A., Martin-Pintado, J., & Gaume, R. 1995, ApJ, 442, L33
- (20) Fuente, A., Rodrıguez-Franco, A., Garcıa-Burillo, S., Martın-Pintado, J., & Black, J. H. 2003, A&A, 406, 899
- (21) Gibb, E., Nummelin, A., Irvine, W. M., Whittet, D. C. B., & Bergman, P. 2000, ApJ, 545, 309
- (22) Helmich, F. P. & van Dishoeck, E. F. 1997, A&AS, 124, 205
- (23) Hogerheijde, M. R., Jansen, D. J., & van Dishoeck, E. F. 1995, A&A, 294, 792
- (24) Hogerheijde, M. R. & van der Tak, F. F. S. 2000, A&A, 362, 697
- (25) Hollenbach, D. & McKee, C. F. 1989, ApJ, 342, 306
- (26) Hollenbach, D. J. & Tielens, A. G. G. M. 1999, Rev. Mod. Phys., 71, 173
- (27) Jansen, D. J., Spaans, M., Hogerheijde, M. R., & van Dishoeck, E. F. 1995, A&A, 303, 541
- (28) McKee, C. F. & Tan, J. C. 2003, ApJ, 585, 850
- (29) Meyer, D. M., Jura, M., & Cardelli, J. A. 1998, ApJ, 493, 222
- (30) Millar, T. J., Farquhar, P. R. A., & Willacy, K. 1997, A&AS, 121, 139
- (31) Mueller, K. E., Shirley, Y. L., Evans, N. J., & Jacobson, H. R. 2002, ApJS, 143, 469
- (32) Osorio, M., Lizano, S., & D’Alessio, P. 1999, ApJ, 525, 808
- (33) Pendleton, Y. J., Tielens, A. G. G. M., Tokunaga, A. T., & Bernstein, M. P. 1999, ApJ, 513, 294
- (34) Preibisch, T. 1998, A&A, 338, L25
- (35) Rachford, B. L., Snow, T. P., Tumlinson, J. et al. 2002, ApJ, 577, 221
- (36) Rodgers, S. D. & Charnley, S. B. 2003, ApJ, 585, 355
- (37) Shepherd, D. S. & Churchwell, E. 1996, ApJ, 472, 225
- (38) Shu, F. H., Adams, F. C., & Lizano, S. 1987, ARA&A, 25, 23
- (39) Spaans, M., Hogerheijde, M. R., Mundy, L. G., & van Dishoeck, E. F. 1995, ApJ, 455, L167
- (40) Stäuber, P., Benz, A. O., Doty, S. D., van Dishoeck, E. F., Jørgensen, J. K. 2004, in Proceedings of the 4th Cologne-Zermatt Symposium, ed. S.Pfalzner, C. Kramer, C. Straubmeier, & A. Heithausen (Springer-Verlag Berlin), 91, CD 1-5, [astro-ph/0311022]
- (41) Sternberg, A. & Dalgarno, A. 1989, ApJ, 338, 197
- (42) Sternberg, A. & Dalgarno, A. 1995, ApJS, 99, 565
- (43) Störzer, H., Stutzki, J. & Sternberg, A. 1996, A&A, 310, 592
- (44) Teyssier, D., Fossé, D., Gerin, M., Pety, J., Abergel, A., & Roueff, E. 2004, A&A, 417, 135
- (45) Tielens, A. G. G. M. & Hollenbach, D. 1985, ApJ, 291, 722
- (46) Turner, B. E. 1989, ApJS, 70, 539
- (47) Trinidad, M. A., Curiel, S., Cantó, J. et al. 2003, ApJ, 589, 386
- (48) van Broekhuizen, F. A., Keane, J. V., & Schutte, W. A. 2004, A&A, 415, 425
- (49) van der Tak, F. F. S., van Dishoeck, E. F., Evans, N. J., Bakker, E. J., & Blake, G. A. 1999, ApJ, 522, 991
- (50) van der Tak, F. F. S., van Dishoeck, E. F., Evans, N. J., & Blake, G. A. 2000, ApJ, 537, 283
- (51) van Dishoeck, E. F. 1988, in Rate Coefficients in Astrochemistry, ed. T. J. Millar & D. A. Williams (Kluwer), 49
- (52) van Dishoeck, E. F. & Hogerheijde, M. R. 1999, in The Origin of Stars and Planetary Systems, ed. C. J. Lada & N. D. Kylafis (Kluwer Academic Publishers), 97
- (53) Walmsley, M. 1995, Rev. Mexicana Astron. Astrofis. Ser. Conf., 1, 137
- (54) Wilson, T. L. & Rood, R. 1994, ARA&A, 32, 191