A highly collimated, extremely high velocity outflow in Taurus
We present the first case of a highly collimated, extremely high velocity bipolar outflow in Taurus. It is powered by the low-luminosity (0.4 ) source IRAS 04166+2706 and contains gas accelerated up to 50 km s-1 with respect to the ambient cloud both toward the blue and the red (uncorrected for projection). At the highest velocities, the outflow collimation factor exceeds 20, and the gas displays a very high degree of spatial symmetry. This very fast gas presents multiple maxima, and most likely arises from the acceleration of ambient material by a time-variable jet-like stellar wind. When scaled for luminosity, the outflow parameters of IRAS 04166 are comparable to those of other extremely high velocity outflows like L1448, indicating that even the very quiescent star-formation mode of Taurus can produce objects powering very high energy flows ().
1 Introduction
The ejection of supersonic gas in a bipolar outflow is one of the first signatures of stellar birth and very likely a required element in the physics of star formation. Outflows have been found towards young stellar objects (YSOs) of nearly all masses, and in most cases, their molecular component (traced in CO) presents a weak degree of collimation and a prevalence of low velocity gas (Lada 1985). A small group of outflows, however, appears dominated by an extremely high velocity (EHV) molecular component having a speed over 20 km s-1 (Mach for gas at 10 K) and a very high degree of collimation (length/width , see Bachiller 1996). This group of highly collimated EHV outflows seems associated with the youngest protostars (Class 0, André et al. 1993), and probably represents a specially energetic initial stage in the evolution of a bipolar flow (e.g., Bontemps et al. 1996).
Although the nearby Taurus cloud contains a large population of outflows (Heyer et al. 1987; Moriarty-Schieven et al. 1992; André et al. 1999), no Taurus YSO has been found so far to power an EHV flow. This is surprising since other nearby clouds like Perseus and Ophiuchus contain EHV flows (Bachiller et al. 1990, 1991; McCaughrean et al. 1994; André et al. 1990), and it may at first suggest that the gas conditions in Taurus prevent the formation of this type of systems. In this paper, however, we report the identification of the first highly collimated EHV outflow in Taurus, which is associated with the low luminosity (0.4 L⊙) source IRAS 04166+2706 (I04166 hereafter). The youth of this source has been previously recognized (Heyer et al. 1987; Kenyon et al. 1990; Barsony & Kenyon 1992; Chen et al. 1995; Shirley et al. 2000; Motte & André 2001; Park & Kenyon 2002), but only a poorly collimated outflow and weak [SII] emission have been reported so far (Bontemps et al. 1996; Gómez et al. 1997). In the following sections we present the newly found EHV outflow and discuss some implications for outflow and star-formation studies. A future paper will describe the shock-induced chemistry of this flow (Santiago et al. 2004, in preparation).
2 Observations
We observed CO(J=2–1) with the 9-pixel HERA receiver array on the IRAM 30m telescope in 2004 April. In order to obtain flat baselines, we observed in wobbler switching (WSW) mode chopping away in azimuth. This procedure contaminated the spectra at low velocities due to the extended Taurus emission, so we also observed in position switching (PSW) mode using a reference more than 1 degree away and free of CO emission at the velocities of interest; these observations have been used to reconstruct the emission at low velocities. In addition, 4 selected positions were observed in CO(1–0) using WSW mode to help estimating excitation conditions. All these data were taken with the VESPA correlator set to velocity resolutions of 0.4 and 0.8 km s-1 for CO(2–1) and CO(1–0), respectively. Cross scans of bright continuum sources were used to correct the telescope pointing, and standard efficiencies were used to convert the data into the main beam brightness scale. The FWHM of the telescope beam was and for CO(1–0) and CO(2–1), respectively.
We observed NH3(1,1) and NH3(2,2) simultaneously toward I04166 with the 100m telescope of the MPIR at Effelsberg in 1998 October. We used frequency switching mode and the AK90 autocorrelator to achieve a velocity resolution of 0.03 km s-1. Cross scans of continuum sources were used to correct the telescope pointing, and an observation of L1551 was used to calibrate the data. The telescope beam FWHM was .
3 The outflow
3.1 Morphology and kinematics
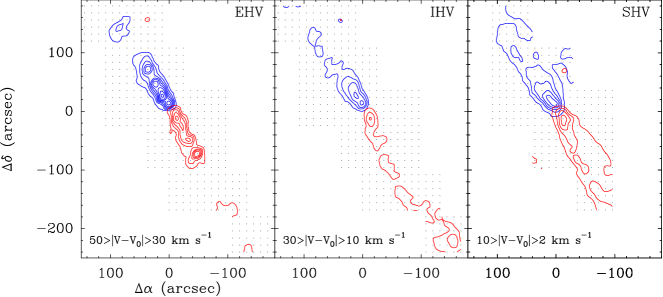
Figure 1 presents integrated maps of the CO(2–1) emission toward I04166 for three velocity ranges. These ranges are offset on average from the cloud systemic velocity ( km s-1) by 40, 20, and 8 km s-1, and will be referred hereafter as the extremely high velocity (EHV), intermediate high velocity (IHV), and standard high velocity (SHV) regimes, respectively. In all maps, the CO emission forms two well-separated lobes that have I04166 near their apex, clearly indicating the presence of a bipolar outflow powered by this source. At the most extreme velocities, the outflow emission is unresolved transversally by our beam, so even if we only consider the innermost (connected) region of emission ( long), the implied collimation factor is at least 20. This factor makes the I04166 system one of the most collimated outflows known (see Bachiller 1996).
As Figure 1 shows, each EHV component consists of a connected lobe (0.07 pc) long near I04166 and additional emission at further distance. Both blue and red connected lobes break up into peaks almost symmetrically located with respect to the IRAS source. Each of these lobes ends in a prominent peak, and while the blue lobe contains three additional maxima, the red one has two and a hint of a third one in between. These presence of symmetric peaks is common in EHV outflows from low mass stars, like L1448 and I03282 (so-called “bullets”: Bachiller et al. 1990, 1991), and is suggestive of a discontinuous, even periodic, mass ejection mechanism. Dividing the average CO speed of the EHV gas (40 km s-1) by the average peak separation (), we infer an ejection period of 350 yr.
More than away from the IRAS source, both EHV lobes contain additional discrete peaks. The prominent blue peak near (, ) seems to have a counterpart near (, ) (unfortunately not fully mapped due to lack of time), and there is a hint of an additional EHV peak in the southernmost part of the blue lobe. This peak is probably part of a bright IHV component, and may have a weak blue counterpart at the northernmost part of our map. Overall, the EHV emission shows a high degree of blue-red symmetry.
The IHV emission (middle panel of Fig. 1) shows a more diffuse distribution and a lower degree of symmetry (but see energetics below). The blue IHV lobe follows the EHV emission and deviates slightly to the east at large distance from the IRAS source. The red lobe also deviates east at intermediate distances but lies again close to the outflow axis by the end of our map, where it presents a discrete peak. As mentioned before, there is a hint of blue IHV emission at the north end of our map, but even if we discount this region (which needs further mapping), the IHV extends more than , which corresponds to more than 0.3 pc at the distance of Taurus (140 pc). Dividing this projected distance by the average radial velocity extent of this component we derive a dynamical age of 7500 yr, and using the highest outflow speed reduces the estimate to 3000 yr.
Finally, the SHV emission forms two conical lobes with the same axis as the EHV gas and relative maxima close to the apex. Again there is a slight enhancement toward the east, but the bulk of the SHV emission is rather symmetric and envelopes the EHV emission. This suggests a stratification of the outflow gas, with the EHV gas moving along the axis and the slower SHV material at further distances (see Gueth & Guilloteau 1999 for a similar case in HH211). The overall high collimation of the outflow allows to separate it from the [SII] jet-like feature HH 390 identified by Gómez et al. (1997), which seems powered by a separate source almost north of I04166 (J. Bally and J. Walawender, private communication).
3.2 Energetics and central core
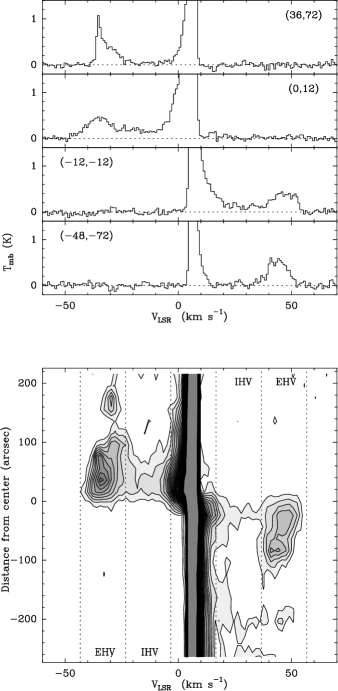
Fig. 2 shows a series of CO(2–1) spectra (top) and a position-velocity (PV) diagram along the outflow (bottom) illustrating the three velocity regimes. The slower SHV gas appears as a wing in the spectra, while the weaker IHV gas forms a flat, low level component more extended toward the south. The EHV gas, on the other hand, forms discrete maxima in the spectra, like the EHV features found in other highly collimated outflows (Bachiller et al. 1990, 1991). This component seems to decrease in velocity slightly along the outflow axis ( km s-1), and its spectral signature varies significantly with position (compare the top two spectra).
Given the distinct nature of the velocity components (see Sect. 4 for further discussion), we estimate their energetics content separately. We assume that the CO(2–1) emission is optically thin and we do not correct for projection, so our results are strict lower limits. We estimate the CO excitation temperature from the 2–1/1–0 ratio at selected outflow positions, which we find to range between 1 and 2.5. Since these ratios imply excitation temperatures between 7 and 20 K, we use a mean value of 15 K, as also suggested by the highest S/N CO(1–0) spectra, and which gives rise to the lowest column density for a given integrated intensity. We also assume a CO abundance of (Frerking et al. 1982).
-
a
Values in parenthesis are blue/red ratios
The results of our outflow energetics are shown in Table 1, and can be summarized by saying that the outflow has a mass of at least 0.01 , a momentum of 0.1 km s-1, and an energy of erg. A look at the distribution of these parameters among the outflow components shows that most of the mass lies at low velocities while most of the momentum and energy is in the fastest gas. Quantitatively, the EHV component contains only 13% of the mass but carries 50% of the outflow momentum and more than 75% of its kinetic energy.
Comparing the parameters of the blue and red gas (ratios in parenthesis in Table 1), we find a high degree of symmetry in the outflow energetics: the blue/red ratio is 1.2 for the EHV gas and even closer to 1.0 for the IHV component, despite the lower symmetry of its CO spatial distribution (Fig. 1). The SHV regime, on the other hand, has a factor of 3 more blue gas, but the study of this component is limited by the ambient emission. The energetics measurements, therefore, confirm the indications of the maps in Fig. 1 that at least the fastest part of the I04166 outflow has a very high degree of symmetry.
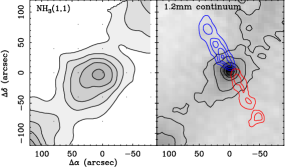
To complete the description of the I04166 system we present in Fig. 3 NH3(1,1) and 1.2mm continuum maps of the IRAS source vicinity (see Motte & André 2001 for a similar continuum map). These maps show that the dense core is nearly round and clearly peaked toward the IRAS source, and that it forms part of a SE-NW chain of cores (to be discussed in a future paper). Using standard NH3 analysis, we derive a gas kinetic temperature of 10 K, a turbulent component of 0.2 km s-1 (FWHM), and assuming a typical Taurus average para-NH3 abundance of (Tafalla et al. 2004), we derive a mass of 1.5 M⊙, all typical of a Taurus core (Jijina et al. 1999).
4 Discussion
The most striking element of the I04166 outflow is the EHV gas, with its high degree of collimation, large radial velocity, and strong blue/red symmetry. Because of its limited location and high velocity dispersion ( km s-1, Fig. 2), the EHV gas is unlikely to represent the (still mysterious) agent that drives the outflow, although its extreme properties suggest that it must be closely connected to the outflow driving agent. Given the geometry of the EHV gas (Fig. 1), this agent has to be jet-like (or have an important jet-like component), and in this context it seems natural to interpret the EHV gas as ambient cloud material prompt-entrained by a jet bow shock. Numerical simulations of jet-driven outflows (e.g., Lee et al. 2001), however, predict that gas accelerated by a bow shock will present a PV diagram with a “spur” feature having the fastest gas at the tip of the jet, in contrast with the almost constant velocity of the separate EHV component seen in Fig. 2. A possible solution to this discrepancy is the existence of multiple bow shocks, as suggested by the multiplicity of peaks in the maps of Fig. 1. High resolution observations of the I04166 outflow and realistic models of gas acceleration by time/angle variable jets are needed to test this interpretation and attempt to understand the origin of the EHV gas, a problem not peculiar to the I04166 system but common to all EHV outflows (e.g., Bachiller 1996).
Comparing the I04166 outflow to other EHV outflows like L1448, I03282, or VLA1623 we conclude that it is a bone fide member of the class for its morphology, kinematics, and energetics content. The I04166 outflow, in fact, seems a scaled-down version of the L1448 outflow, as it contains about 5% of its momentum and energy while it has a central source with about 5% of its luminosity. This simple scaling (plus a similar kinematic age) shows that the I04166 outflow is almost as mechanically efficient () as L1448, and therefore belongs to the group of outflows an order of magnitude more powerful than typical Class I outflows (Bontemps et al. 1996). The I04166 source, on the other hand, is a typical Taurus object both in the parameters of its dust envelope (Motte & André 2001) as well as in the turbulence and temperature of its core (Sect. 3.2). This implies that the (still unexplained) conditions required to produce an EHV outflow can be realized in the quiescent Taurus environment, and in addition, they can be achieved by a source with a luminosity as low as 0.4 L⊙ (the lowest of all EHV sources). Such a combination of circumstances argues for EHV outflows resulting from a special (early) evolutionary stage in the protostellar phase, almost independent of their luminosity and environment.
Finally, we note that despite the similarities between the I04166 outflow with the outflows from L1448, I03282, or VLA1623, the spectral energy distribution of I04166 is characterized by a bolometric temperature of 90-140 K, while the from the other sources with EHV outflows is closer to 30-60 K (Chen et al. 1995; Shirley et al. 2000). This relatively large value makes I04166 a Class I candidate (Chen et al. 1995), and therefore unexpectedly “evolved” compared with the other exciting sources of EHV flows. The recent non detection of a K band point source associated with I04166 by Park & Kenyon (2002), however, suggests that I04166 may still be a truly Class 0 source. A better characterization of I04166 in the FIR with current (Spitzer) and future (Herschel) telescopes is therefore necessary.
Acknowledgements.
We thank the staff of the IRAM 30m telescope for help during the observations, and J. Bally and J. Walawender for information on the HH390 system. MT, JS, and RB acknowledge support from grant AYA2003-07584 of the Spanish DGES.References
- André et al. (1990) André, P., Martín-Pintado, J., Despois, D., Montmerle, T. 1990, A&A, 236, 180
- André et al. (1993) André, P., Ward-Thompson, D., & Barsony, M. 1993, ApJ, 406, 122
- André et al. (1999) André, P., Motte, F., & Bacmann, A. 1999, ApJ, 513, L57
- Bachiller et al. (1990) Bachiller, R., Cernicharo, J., Martín-Pintado, J., Tafalla, M., & Lazareff, B. 1990, A&A, 231, 174
- Bachiller et al. (1991) Bachiller, R., Martín-Pintado, J., & Planesas, P. 1991, A&A, 251, 639
- Bachiller (1996) Bachiller, R. 1996, ARA&A, 34, 111
- Barsony & Kenyon (1992) Barsony, M., & Kenyon, S.J. 1992, ApJ, 384, L53
- Bontemps et al. (1996) Bontemps, S., André, P., Terebey, S., & Cabrit, S. 1996, A&A, 297, 98
- Chen et al. (1995) Chen, H., Myers, P.C., Ladd, E.F., Wood, D.O.S. 1995, ApJ, 445, 377
- Frerking et al. (1982) Frerking, M.A., Langer, W.D., & Wilson, R. W. 1982, ApJ, 262, 590
- Gómez et al. (1997) Gómez, M., Whitney, B.A., & Kenyon, S.J. 1997, AJ, 114, 1138
- Gueth & Guilloteau (1999) Gueth, F., & Guilloteau, S. 1999, A&A, 343, 571
- Heyer et al. (1987) Heyer, M., Snell, R.L., Goldsmith, P.F. & Myers, P.C. 1987, ApJ, 321, 370
- Jijina et al. (1999) Jijina, J. Myers, P.C., Adams, F.C. 1999, ApJS, 125, 161
- Kenyon et al. (1990) Kenyon, S.J., Hartmann, L.W, Strom, K.M., & Strom, S.E. 1990, AJ, 99, 869
- Lada (1985) Lada, C.J. 1985, ARA&A, 23, 267
- Lee et al. (2001) Lee, C.-F., Stone, J.M., Ostriker, E.C., Mundy, L.G. 2001, ApJ, 557, 429
- McCaughrean et al. (1994) McCaughrean, M.J., Rayner, J.T., & Zinnecker, H. 1994, ApJ, 436, L189
- Moriarty-Schieven et al. (1992) Moriarty-Schieven, G.H., Wannier, P.G., Tamura, M., & Keene, J. 1992, ApJ, 400, 260
- Motte & André (2001) Motte, F., & André, P. 2001, A&A, 365, 440
- Park & Kenyon (2002) Park, S., & Kenyon, S.J. 2002, AJ, 123, 3370
- Shirley et al. (2000) Shirley, Y., Evans II, N.J., Rawlings, J.M.C., & Gregersen, E.M. 2000, ApJS, 131, 249
- Tafalla et al. (2004) Tafalla, M., Myers, P.C., Caselli, P., & Walmsley, C.M. 2004, A&A, 416, 191