Beppo-SAX temperature maps of galaxy clusters in the Corona Borealis supercluster: A2061, A2067 and A2124
Abstract
In this paper we present the analysis of Beppo-SAX observations of the cluster pairs A2061–A2067 and A2122–A2124, located in the Corona Borealis supercluster, which have been selected as candidate merging clusters. The aim of this work is to study the physics of the intracluster medium and to look for the possible presence of merging signatures. We derived the global temperatures and abundances and the temperature profiles and maps for these clusters. We do not find any significant evidence of interaction between the clusters forming the pairs, but we detect a candidate shock inside A2061. On the basis of the X-ray and optical properties of this cluster we propose a scenario in which a group is falling inside A2061. This interaction is in the phase in which the cores have not encountered yet and in which the formation of a shock is expected.
keywords:
X-rays: galaxies: clusters - galaxies: clusters: general - galaxies: clusters: individual: A2061 - galaxies: clusters: individual: A2067 - galaxies: clusters: individual: A2122 - galaxies: clusters: individual: A2124 -1 Introduction
Clusters of
galaxies are by now recognized to form in a hierarchical way, by the
gravitational merger of smaller clusters and groups. This kind of events are
the most energetic ones in the Universe since the Big Bang, with a release of
erg on a time scale of the order of few Gyrs
(Sarazin, 2000).
Numerical simulations (Tormen, 1997) revealed that mergings happen along
preferential directions which define matter flow regions, at whose
intersection rich clusters form. The environment of these intersections is
represented by the core of superclusters: given the high local
density and the small volumes involved, the “cross section” for merging
between clusters or group-cluster is strongly enhanced and the dynamical
processes are accelerated. Therefore, the central part of superclusters are
unique and ideal laboratories where to study this astrophysical event.
Applying a percolation algorithm to cluster catalogues, in order to
individuate density enhancements of clusters over the mean density,
Zucca et al. (1993) obtained catalogues of superclusters at various density
excesses:
among the richest structures found there are the Shapley Concentration in the
Southern hemisphere and the Corona Borealis supercluster in the Northern one.
Our group already performed an extensive, multiwavelength study of the Shapley
Concentration in the X-ray, optical and radio bands
(Bardelli et al., 1996; Ettori et al., 1997; Bardelli et al., 1998; Venturi et al., 2000): in this region three
“cluster complexes” are found, which present cluster merging events at
various evolutionary stages.
In order to extend the statistics, we decided to study
systems of clusters belonging to the central region of the Corona Borealis
supercluster.
In this paper we present the results of Beppo-SAX observations of the cluster
pairs A2061–A2067 and A2122–A2124.
The plan of the paper is the following. In Sect. 2 we introduce the Corona
Borealis supercluster and in Sect. 3 and 4 we describe the data reduction and
the determination of the temperature profiles and maps, respectively.
In Sect. 5, 6 and 7 we present the analysis of A2061, A2067, and
A2124 respectively. Finally in Sect. 8 we discuss and summarize the results.
We assume a flat cosmology (=1) with =0.3,
=0.7 and a value for the Hubble constant of
=100 km s-1 Mpc-1.
2 The Corona Borealis supercluster
The Corona Borealis supercluster, at (Postman et al., 1988),
is the most prominent supercluster in the Northern sky.
At an overdensity in number of clusters of
(Zucca et al., 1993) this supercluster is made up
of ten clusters: A2019, A2056, A2061, A2065, A2067, A2079, A2089, A2092, A2122
and A2124 (see also Cappi & Maurogordato 1992).
The central part of the Corona Borealis supercluster covers a region of
centred on ,
and is made up of seven clusters: four of them
(A2056, A2065, A2079 and A2089) are grouped together in the Southern part,
A2061 and A2067 are close together in the Northern part, and
A2092 is isolated in the North–Eastern part (see also figure 1 in
Small et al. 1998).
A2122 and A2124 are located at the North-East periphery of this central region
( from the centre of the supercluster).
According to Bahcall (1992) the entire supercluster extends for at
least 100 h-1 Mpc on the plane of the sky, while according
to Small et al. (1997) it is only 40 h-1 Mpc along the line of sight.
The dominant cluster of Corona Borealis is A2065 (=0.0726, Struble & Rood
1999): located in the Southern part of the supercluster, it is the only
cluster of the supercluster
of richness class 2. It shows a late stage merging (Markevitch et al., 1999).
Inside this supercluster two pairs of candidate interacting clusters at high
density excess have been found: A2061–A2067 ( ) and A2122–A2124
( ). All these clusters have richness class 1.
In the present work we firstly focus on the clusters A2061 and A2067.
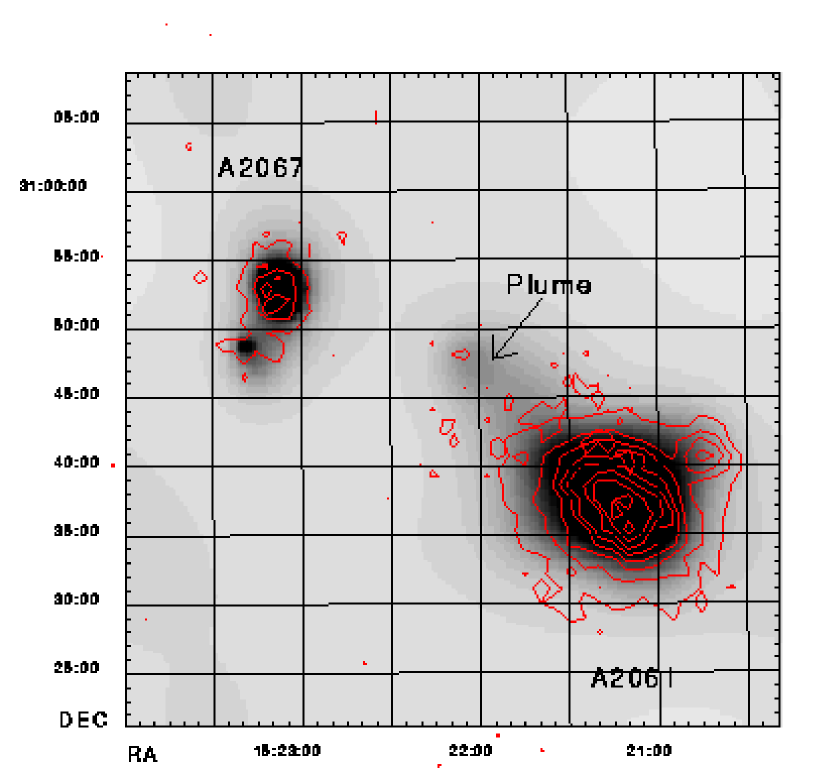
In order to show the relative position of the two clusters, we present
in Figure 1 the X-ray isophotes from the two MECS
observations
in the [2–10] keV energy range superimposed on
a gray scale image of the existing archive ROSAT PSPC pointed observation which
contains both clusters.
Unfortunately, the PSPC observation is offset by arcmin, and
therefore the PSF is degradated.
It can be seen from the PSPC observation that A2061 seems to be elongated
towards A2067.
This plume of X-ray emission might indicate the presence of interaction between
the two clusters. Note that in the Beppo-SAX data there is no trace of this
elongation because part of it falls under the detector entrance window
supporting structure
(called strongback). From
this image we can estimate that the distance between the centres of the two
clusters on the plane of the sky is 30 arcmin: at the redshift of the
clusters ( 0.076) this distance corresponds to 1.8 h-1 Mpc ,
i.e. less than 2 Abell radii
( 3 h-1 Mpc ). On the other hand the velocity difference
between A2061 and A2067 is
1533 km s-1 (Oegerle & Hill, 2001): if this was due purely
to Hubble flow, the separation between these two clusters would be
15.44 h-1 Mpc , therefore too large for a cluster interaction.
However this velocity difference results from the composition of the
unknown relative peculiar velocity and the cosmological distance of
the two clusters.
| Target | (2000) | (2000) | date | exp.time | count–rate | |
|---|---|---|---|---|---|---|
| h m s | o ′ ′′ | ksec | cts/s | cm-2 | ||
| Abell 2061 | 15 21 16.13 | +30 36 43.93 | 2000 Aug 8–9 | 51.2 | 9.03 | 1.96 |
| Abell 2067 | 15 23 08.53 | +30 52 51.33 | 2000 Jul 28–29 | 50.6 | 0.92 | 1.98 |
| Abell 2124 | 15 45 00.00 | +36 03 57.60 | 2001 Feb 5–8 | 133.0 | 5.19 | 1.65 |
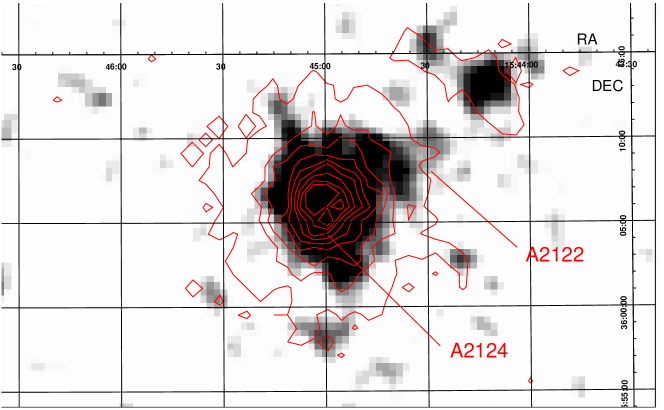
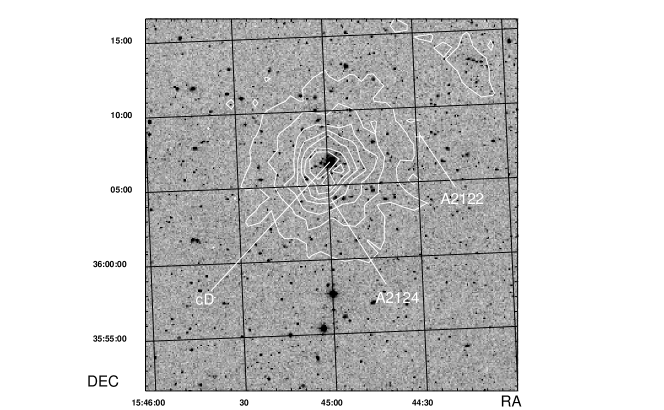
Secondly we study the clusters A2122 and A2124. These clusters are so nearby (their is 150 km s-1, while the distance on the plane of the sky is 7 arcmin) that there are no data about them as pair in literature: there is a lot of information about A2124, while there are very few data about A2122, and sometime they are considered as a single cluster. Because of their small distance on the plane of the sky, they have been observed with a single Beppo-SAX pointing centred on the cluster A2124. In Figure 2 we present an Einstein IPC image of the diffuse gas of these clusters superimposed to the X-ray isophotes from the MECS observation in the [2–10] keV energy range: the nominal ACO centres are indicated with arrows.
3 Observations and data reduction
The clusters A2061, A2067 and A2124 were observed by the Beppo-SAX satellite
(Boella et al., 1997a) in the periods 2000 August 8–9, 2000 July 28–29 and
2001 February 5–8, respectively.
We discuss here the data from two of the instruments on board Beppo-SAX: the
Medium–Energy Concentrator Spectrometer (MECS) and the Low–Energy
Concentrator Spectrometer (LECS, used here only for A2067).
The MECS (Boella et al., 1997b) is composed by two units, working in the
[1–10] keV energy range. At 6 keV, the spectral resolution is
and the angular resolution is (FWHM). The LECS (Parmar et al., 1997)
consists of an imaging X-ray detector, working in the [0.1–9] keV
energy range, with 20 spectral resolution and
(FWHM) angular resolution (both computed at 1 keV). Standard
reduction procedures and screening criteria have been adopted to
produce linearized and equalized event files. The MECS (LECS) data
preparation and linearization were performed using the Saxdas
(Saxledas) package under Ftools environment.
We also analysed PDS (Phoswich Detector System) data for these clusters:
we found that no significant detection is present for A2061 and for A2067.
For A2124 we found a small excess in the [15–40] keV energy range possibly
associated
with the X-ray source EXSS 1543.1+3615 (Oppenheimer et al., 1997).
We have taken into account the PSF-induced spectral distortions
(D’Acri et al. 1998) in the MECS analysis using effective
area files produced with the effarea program. Note that, due to
the displacements of the two MECS units, the region masked by the
support window is different in MECS2 and in MECS3: this fact allows to
recover, at least partly, the information in the region 8–12 arcmin
from the field center.
A detailed explanation of the MECS analysis is given in De Grandi & Molendi (2001).
All MECS and LECS spectra have been background subtracted using spectra
extracted from blank sky event files in the same region of the
detector as the source (Fiore et al., 1999).
The observation log is reported in Table 1. We recall that
A2122 and A2124 belong to a single Beppo-SAX observation.
The coordinates reported in this table are the pointing coordinates.
The observed
count–rates for A2061, A2067 and A2124 for the 2 MECS units and within
the central 8 arcmin (corresponding to 0.50 h-1 Mpc ) are also reported
in the table.
Recently, Perri & Capalbi (2002) found that a systematic error affects the sky
coordinates derived from the LECS and MECS instruments.
The corrections depend on the spacescraft roll angle and are of the order
of arcsec for our observations.
From now on all the X-ray coordinates will be corrected for this systematic
error.
4 Temperature profiles and maps
In order to find the global temperature, we extracted a circular region
of 8 arcmin ( 0.50, 0.48 and 0.40 h-1 Mpc for A2061, A2067
and A2124 respectively) from the centre of the MECS data in the range
[2–10] keV. This region, although smaller than the extension of the clusters,
has been chosen because it is not affected by the absorption caused by
the strongback.
We fitted the spectrum with a mekal (Mewe, 1995; Kaastra, 1992) model
with an absorbing Galactic hydrogen column
(wabs model), as implemented in the XSPEC package (Ver. 10.00).
After having checked that the fitted Galactic absorption is consistent
with the literature measurement (Dickey & Lockman, 1990), we fixed it to this value.
The values for each cluster are reported in Table 1.
In analysing temperature profiles and maps we used only the MECS data,
for which the correction for the PSF-induced spectral distortions is
available.
The cluster emission has been divided into concentric annuli, centred on the
X-ray emission peak: out to arcmin the annuli are wide, beyond this
radius the annuli are wide.
However, we limited all the fitting procedures to the cases in which the source
counts are more than of the total (i.e. source plus background) counts
(see the discussion in De Grandi & Molendi 2002): indeed when the source
counts are low, the spectral features of the background could dominate the
results.
In order to explore if there is an asymmetry of the temperature distributions
we divided the cluster maps in four sectors. Sector I is North–West of the
image and the numbers increase clockwise. The value of temperature referred
to the 0–2 arcmin region is the same for all the sectors because a circular
region was used to fit data. This analysis has been possible only for
A2061 and A2124, being A2067 too faint to permit meaningful temperature
determinations in sectors.

5 The cluster A2061
Abell 2061 is a cluster of richness class 1 and Bautz–Morgan class III;
the ACO (Abell et al. 1989) coordinates
are and .
On the basis of 118 redshifts Oegerle & Hill (2001) found that the biweight
estimate of the
observed location was Cbi =23699 70 km s-1 and that the biweight
estimate of the scale was Sbi=780 km s-1.
At the redshift of the cluster
1 arcmin corresponds to 62.70 h-1 kpc.
We observed this cluster using an exposure time of 51163 seconds and
in Figure 3 we present the MECS isophotes in the
[2–10] keV band superimposed on the optical image from the Digital Sky Survey.
The centroid of diffuse emission has coordinates
,
and is 1.8 arcmin from the ACO centre,
corresponding to 0.11 h-1 Mpc .
The hot gas distribution appears to be elongated in the NE–SW direction,
i.e. toward A2067.
Two bright galaxies are located approximately
along the major axis of the ellipse described by the isophotes. One of them
(dubbed North dominant) is located 3.1 arcmin ( 0.19 h-1 Mpc )
NE from the X-ray centre; it has a velocity of =23725 23 km
s-1 (Oegerle & Hill, 1998) and therefore it is at rest with respect to
the cluster mean velocity.
The other dominant galaxy (dubbed South dominant), located 2.6 arcmin
( 0.16 h-1 Mpc ) SW from the X-ray centre, has a velocity of
=22720 20 km s-1 (Oegerle & Hill, 1998),
and therefore it has a
980 km s-1 with respect to the centroid. The R
magnitudes of the two galaxies are RAPM=12.24 and 12.84, respectively.
In the NW direction, at 7.9 arcmin ( 0.50 h-1 Mpc ) from the X-ray centre,
there is a significant unresolved X-ray peak
(,
). Near this position two different objects
are located: a galaxy (,
; R=13.93)
without a measured redshift, at arcsec from the peak, and a
Seyfert 1 galaxy (,
; R=15.27)
at arcsec from the peak, at =0.0772 (Small et al., 1997), that we
associate to the X-ray peak.
5.1 Spatial analysis
Looking at MECS X-ray isophotes of the cluster (see Figure 3), it is clear that it is characterized by an elongated diffuse emission. For this reason we fitted the surface brightness distribution using an elliptical corrected King law
| (1) |
where
in order to take into account the inclination angle of the cluster.
The variables to be estimated are the normalization ,
the positions (, ) of the centre of the
cluster, the inclination angle of the cluster (, computed clockwise
from the North),
its core radii ( and ), the exponent of the King law (). The
background () has been estimated from the background map (see Sect. 3)
and, after having rescaled it by the exposure times, resulted to be
0.09 cts pix-1.
The fit has been performed on a region of 9 arcmin radius by minimizing the
variable between the model and the data, after having masked a circle
of diameter centered on the second X-ray peak described in
Sect. 5.
The resulting reduced is 1.044 with 1254 degrees
of freedom. The results of the fit, done in the [2–10] keV energy range, are
reported in Table 2.
We found =0.634, while the mean value of the core radius
is 0.265 h-1 Mpc , larger than the average value of 0.08 h-1 Mpc found by
Ettori & Fabian (1999) from a sample of 27 clusters.
This observed large value of the core radius indicates, together with
the other properties described in the previous section, that the cluster
is not completely relaxed and the ICM is still settling after a major
disturbance induced from a merger (see the discussion in Sect.8).
| Normalization | ||||
|---|---|---|---|---|
| cts pix-1 | pix | pix | ||
| erg str-1 cm-2 s-1 | h-1 Mpc | h-1 Mpc |
From the normalization of the King function it is possible to obtain the central surface brightness, using the appropriate conversion factor from counts to intrinsic flux (i.e. corrected for absorption). Assuming a bremsstrahlung emission from a hot gas with temperature of 4.52 keV, an abundance of 0.10 and a hydrogen column density of 1.96 atoms cm-2 (see Sect. 5.2), the central surface brightness in the [2–10] keV range resulted to be = 3.13 erg s-1 cm-2 str-1.
5.2 Global temperature and abundance
We found that the global temperature of this cluster, obtained from the
MECS instrument, is keV with
an abundance of ,
where the errors are at the confidence level.
The reduced is with 109 degrees of freedom.
In Figure 4 we show the MECS spectrum of
A2061, overplotted to the fit, and the corresponding confidence ellipse
of the temperature and abundance parameters.
We determined the temperature and the abundance also in a larger
region (within 16 arcmin, corresponding to 1 h-1 Mpc ), finding
keV and abundance
with a reduced of 0.98 and
127 degrees of freedom. These values are well consistent with the previous
estimate.


Following the relation of Lubin & Bahcall (1993)
[ km s-1], the temperature of =4.52 keV
implies a velocity dispersion of km s-1, consistent
with the value estimated by Oegerle & Hill (2001).
Another way to estimate the correspondence between the velocity dispersion and
the hot gas temperature is to calculate (Cavaliere & FuscoFemiano, 1976):
where is the mean
molecular weight,
is the proton mass, is the velocity
dispersion of galaxies and is the temperature of the cluster gas.
Using the value obtained by Oegerle et al. for the velocity dispersion,
and the temperature we found, we obtained
=0.84, lower than the typical value of 1.1 (Sarazin, 1988).
With the temperature estimated in the region 0–16 arcmin, the
total luminosity within this region
is h-2 erg s-1,
corresponding to a bolometric luminosity of
=2.45 h-2 erg s-1;
the flux we obtained in the same region is erg cm-2 s-1.
We found these two values after having
subtracted the contribution of the second X-ray peak described in Sect. 5.
Ebeling et al. (1996) reported the flux for this cluster from the ROSAT All
Sky Survey, assuming a temperature of 5.5 keV: they found =1.46
erg cm-2 s-1, i.e. 15% lower than our value.
From the X-ray luminosity function of clusters in the [2–10] keV band,
Edge et al. (1990) found =2 h-2 erg
s-1: the luminosity we estimated is 39% lower than .
5.3 Temperature profiles and maps
The next step is the description of the temperature distribution within
the cluster by dividing the frame in rings and sectors.
Given the low count statistics, the abundance resulted not constrained by
the data, so we fixed it to the
value of 0.10, according to the value found with MECS data within 8 arcmin.
The spectral analysis was performed after having masked a circle
of radius centered on the second X-ray peak described in
Sect. 5. This peak affects annuli 6′–8′ and 8′–12′.
The results are reported in Table 3.
Figure 5 shows the temperature profile of A2061
in annuli around the cluster centre. The vertical bars correspond to the
errors and the horizontal bars represent the bins used to extract the
counts. The dotted line corresponds to the value obtained from the global
temperature fit.
From this figure we note that the profile is slightly decreasing, a part the
second point, which is higher than the global value: this is due to a
temperature increase in a specific area of the cluster (see below).
| Radius () | kT () | Reduced (d.o.f.) |
|---|---|---|
| 0 - 2 | ||
| 2 - 4 | ||
| 4 - 6 | ||
| 6 - 8 | ||
| 8 - 12 |

| R () | Sector | kT () | Reduced (d.o.f.) |
|---|---|---|---|
| 2 - 4 | I | ||
| II | |||
| III | |||
| IV | |||
| 4 - 6 | I | ||
| II | |||
| III | |||
| IV | |||
| 6 - 8 | I | ||
| II | |||
| III | |||
| IV | |||
| 8 - 12 | I | ||
| II | |||
| III | |||
| IV |


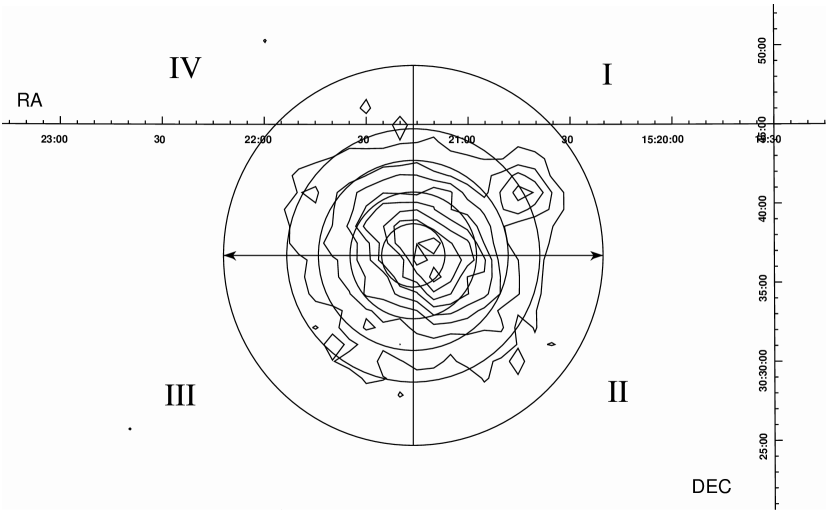
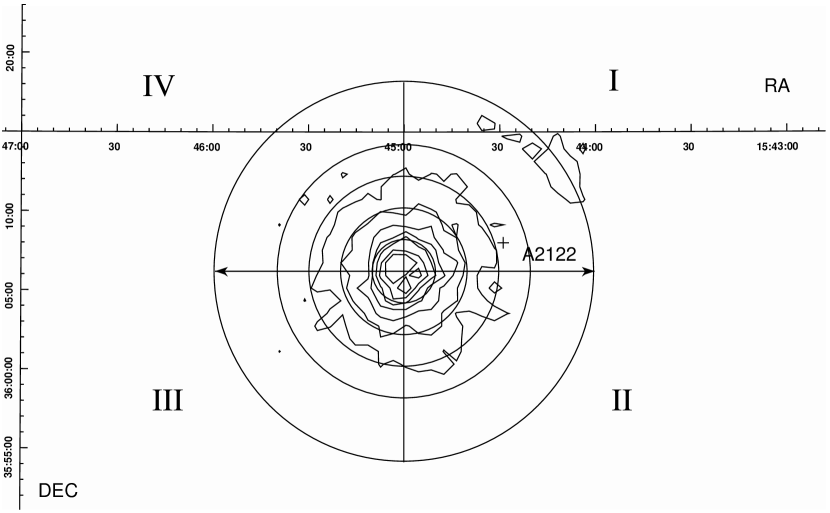
In order to explore if there is an asymmetry of the temperature distribution
due to the interaction of the intracluster medium with possible
material of the A2067 cluster (see Figure 1), we divided
the cluster map in four sectors as shown in Figure 6.
Sector IV points towards the A2067 cluster.
Also in this case, we masked the second X-ray peak, which is located in
sector I.
The results are reported in Table 4.
Note that in the 8′–12′
annuli, sectors I, II and III, the source counts are 20.0 %, 17.8% and 18.7%,
respectively, of the total counts, that is the background
contribution becomes dominant.
In Figure 7 the temperature profiles in the four
sectors are presented.
Looking at the image it is possible to note that
the temperature distribution is quite isothermal up
to 8 arcmin, with the exception of sector IV, for which there is a remarkable
increase of the temperature around the 3 arcmin bin which is not consistent
(at 2.5 sigma) with that of the global fit. This result leads us to suppose
that the
discrepancy with respect to the global value found in the temperature radial
profile in the 2′–4′ arcmin annulus (see Figure 5) is
due to the presence of this excess.
The spectral fit of the data in the 2–4 region of sector IV is shown in
Figure 8: the temperature is
keV (the errors are at the 68% confidence level) and the reduced is
0.96 with 44 degrees of freedom.
In order to check the robustness of the temperature determined in this region,
we repeated the fit,
forcing the abundance to different values in the range 0.00–1.00: the derived
temperatures are in the range
9.06–11.45 keV, in any case not consistent with the value from the global fit.
Moreover we checked whether the data could be described by a bremsstrahlung
plus a power law: the fit, although formally acceptable, does not constraint the
photon index of the power law.
This result might suggest the presence of a candidate internal shock due to
the merger of an infalling group into the main body of the cluster, as we
discuss in Sect. 8.
6 The cluster A2067
Abell 2067 is a cluster of richness class 1 and Bautz-Morgan class III; its
centre has coordinates ,
(Abell et al., 1989).
On the basis of 44 redshifts, Oegerle & Hill (2001) estimated
Cbi=22166 79 km s-1 and
Sbi=536 km s-1.
At the redshift of the cluster
1 arcmin corresponds to 59.98 h-1 kpc.
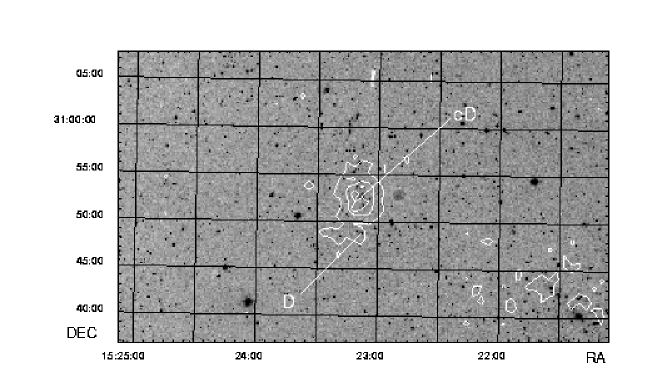
In Figure 9 we present the MECS X-ray isophotes superimposed
on the optical image from the Digital Sky Survey: the isodensity contours of the
cluster are taken in the energy range [2–10] keV.
The centroid of diffuse emission has coordinates
,
and is 1.9 arcmin from the ACO centre,
corresponding to 0.11 h-1 Mpc .
This cluster does not appear significantly elongated but shows a diffuse
excess in the Southern part, in correspondence of a galaxy overdensity.
Kopylova & Kopylov (1998) reported that A2067 is
characterized by the presence of a central dominant galaxy
(, ),
but we found that this object is 22.6 arcmin (1.36 h-1 Mpc ) far from the
X-ray centre.
Studying the morphological classification of galaxies which belong to A2067 we
found out two dominant galaxies: one of them, a central dominant galaxy, is
located 0.5 arcmin ( 0.03 h-1 Mpc ) from the X-ray centre,
has a velocity of =22061 54 km s-1 (Postman et al., 1988)
and its RAPM magnitude is 12.44.
The other dominant galaxy, with a velocity of
=21576 50 km s-1 (Postman et al., 1988) is located 4.3 arcmin
( 0.26 h-1 Mpc ) from the X-ray centre (,
) and its RAPM magnitude is 15.97.
These dominant galaxies are indicated as cD and D in Figure
9.
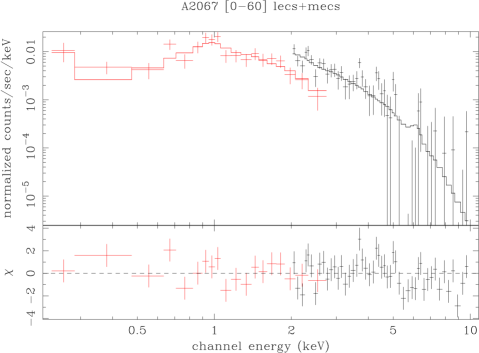
6.1 Global temperature and abundance
Fitting the data
extracted from a circular region of 8 arcmin from the centre of the MECS data in
the range [2–10] keV we found
keV (errors are at the 90% confidence level)
with a reduced of 1.52 with 46 degrees of freedom, but the abundance is
not constrained. Therefore in order to use all the information present in the
Beppo-SAX observation, we considered also the data of the LECS instrument in
the [0.2–3] keV band extracted from the same region: we obtained
keV and an abundance of ,
with a reduced of 1.08 with 16 degrees of freedom.
The temperature is consistent with the MECS value.
We have repeated the fit with the MECS data in the region 0–8 arcmin fixing the
abundance to the value found from LECS data: we obtained
keV
with a reduced of 1.50 with 47 degrees of freedom.
Finally we used the combined LECSMECS data.
In this case, we ran the fits by estimating also the relative normalization
between the two instruments: we obtained a value similar to that found by
Bardelli et al. (2002) and by Ettori et al. (2000). Therefore we fixed it to the
value 0.50.
From the LECSMECS data we found keV and an
abundance of ,
with a reduced of 1.39 with 64 degrees of freedom. The temperature
is consistent at 0.6 sigma with that obtained from MECS data and at
0.4 sigma with that obtained from LECS data; the abundance is consistent at 0.1
sigma with the value found out from LECS data.
In Figure 10 we show the combined LECSMECS spectrum of
A2067, overplotted to the fit.
The temperature of =1.54 keV implies a velocity dispersion of
km s-1 (errors are at 68% confidence level) which is
consistent with the value estimated by Oegerle & Hill (2001).
From MECS data we found that the total luminosity within 8 arcmin is
h-2 erg s-1,
corresponding to a bolometric luminosity of
=2.11 h-2 erg s-1.
According to McKee et al. (1980), the X-ray luminosity in the range [2–10] keV of
A2067 is 1.31 h-2 erg s-1.
Our value is 97% lower than the value given by Edge et al. (1990).
| Radius () | kT () | Reduced (d.o.f.) |
|---|---|---|
| 0 - 2 | ||
| 2 - 4 | ||
| 4 - 6 |
6.2 Temperature profiles
In analysing temperature profiles we fixed the abundance
to the value of 0.18, according to the value found with LECS data.
The results are reported in Table 5. Note that in the
4′–6′
annulus the source counts are 27.1 % of the total counts, i.e. lower than 30%
of the total and therefore on the border of our acceptability criterium.
In Figure 11 we report the temperature profile of A2067
in annuli around the cluster centre.
Looking at the figure it is possible to note that the temperature is roughly
constant, i.e. it is isothermal up to 6 arcmin ( 0.36 h-1 Mpc ).
Given the low statistics of counts we were not able to divide the cluster in
sectors as done for A2061 and it was not possible to do a bidimensional
analysis.

7 The cluster A2124
Abell 2124 is a richness class 1 cluster and Bautz-Morgan class I; its
centre has coordinates ,
(Abell et al., 1989).
On the basis of 61 redshifts Oegerle & Hill (2001) estimated
Cbi=19684 110 km s-1 and
Sbi=862 km s-1.
At the redshift of the cluster 1 arcmin corresponds to 52.92 h-1 kpc.
We observed this cluster with an exposure time of 133017 seconds.
In Figure 12 we present the MECS X-ray isophotes
superimposed on the optical image from the Digital Sky Survey.
The X-ray centre has coordinates ,
.
A2124 is dominated by a single cD galaxy (,
), with a velocity of =19810 km s-1
and R magnitude of 12.49 (Kopylova & Kopylov, 1998).
Blakeslee & Metzger (1999) identified an arclike object at =0.573
located 27 arcsec along the major axis from the centre of this cD galaxy.
As discussed in Sect. 2., in this Beppo-SAX observation
another Abell cluster (A2122) is included with a position
NW from A2124 (in Figure 12
we indicate the ACO centre of both clusters).
Abell 2122 is reported as a cluster of richness 1 and Bautz-Morgan
class II-III; its
centre has coordinates ,
(Abell et al., 1989)
and its velocity is =19830 km s-1 (Struble & Rood, 1999).
There is apparently a lot of confusion in the literature about A2122 and A2124.
These two clusters are at a projected separation of 7.3 arcmin.
Abell (1958)
classified both of them as richness 1 clusters, but assigned distance class 3
to A2122 and distance class 5 to A2124. Looking at the DSS images centred on
the two clusters, A2124 appears indeed as a poorer concentration of fainter
galaxies 3 arcmin South to the cD (but at the same right ascension). However,
the centre of A2122 falls West of the cD, in a region which apparently does not
correspond to any significant galaxy concentration. Quite confusingly, in the
NED database only A2122 is associated to a Zwicky cluster, while the SIMBAD
database gives wrong
coordinates for A2122, and (instead of and
, as reported in NED).
The available redshift measurements show that the two clusters are at the same
distance, at : this means that the separation of 7.3 arcmin
corresponds to only
h-1 Mpc; on this basis and taking into
account the X–ray map, we conclude that A2122 and A2124 should be
identified with the same cluster.
| Normalization | ||||
|---|---|---|---|---|
| cts pix-1 | pix | pix | ||
| erg str-1 cm-2 s-1 | h-1 Mpc | h-1 Mpc |
7.1 Spatial analysis
As done in Sect. 5.1., we fitted the surface brightness distribution
using an elliptical King law;
the background () has been estimated from the background map, and resulted
to be 0.205 cts pix-1.
The resulting reduced is 0.956 with 1254 degrees of freedom.
The results of the fit, done in the [2–10] keV energy range and within a
region of 9 arcmin radius, are
reported in Table 6.
We found =0.586, while the average value of the core radius
is 0.122 h-1 Mpc .
With these values and the temperature profile (see Sect.7.3) we derive
a total mass within 0.45 h-1 Mpc of h-1 M⊙.
7.2 Global temperature and abundance
For the MECS global temperature we found =4.41 keV and
an abundance of 0.29, where the errors are
at the 90% confidence level. The reduced is 0.98 with 132 degrees
of freedom.
The temperature found implies a velocity dispersion
of 809 km s-1 (errors are at 68% confidence level), which
is consistent with the value estimated by Oegerle & Hill (2001).
Using the value obtained by Oegerle for the velocity dispersion,
and the temperature we found from MECS data in the 0-8
arcmin region, we obtained =1.05,
similar to the typical value of 1.1 (Sarazin, 1988).
From MECS data we found that the total luminosity within 8 arcmin is
h-2 erg s-1,
corresponding to a bolometric luminosity of
=0.56 h-2 erg s-1;
the flux we obtained in the same region is
erg cm-2 s-1
to be compared with
=0.48 erg cm-2 s-1, estimated
by Ebeling et al. (1996).
The luminosity we estimated is 86% lower than the value
given by Edge et al. (1990).
7.3 Temperature profiles and maps
In analysing temperature profiles we used the MECS data,
and divided the cluster emission in the same way as done for A2061 and A2067
(see Sect. 5.3 and 6.2).
Abundance is fixed to the
value of 0.29, according to the value found from the global fit.
The results are reported in Table 7.
In Figure 13 we report the temperature profile of A2124
in annuli around the cluster centre.
Looking at the figure it can be seen that the temperature is not constant, but
shows a decrease with the radius increase.
In order to explore if there is an asymmetry of the temperature distribution,
we divided the cluster map in four sectors
as shown in Figure 14. The cluster A2122 belongs to the
sector I, annulus 6–8 arcmin, and, unfortunately, part of its emission
falls under the strongback.
The results of the analysis are reported in Table 8.
Note that in the 8′–12′
annulus, sector I, the source counts are 28.9 % of the total counts,
while in the remaining sectors of the same annulus the source counts are lower
than 16%, that is the background contribution becomes dominant.
In Figure 15 the temperature profiles in the four
sectors are presented.
For the 0–2 arcmin region a circular region was used to fit data.
Because of a shift between the X-ray centroid and the MECS centre, the
strongback support falls partly in the 6′–8′ annulus: this fact causes
a loss of counts in sectors I and IV, which produces bad constraints in the
temperature determination, seen as exceedingly high 90% errors (see Table
8).


| Radius () | kT () | Reduced (d.o.f.) |
|---|---|---|
| 0 - 2 | ||
| 2 - 4 | ||
| 4 - 6 | ||
| 6 - 8 |
| R () | Sector | kT () | Reduced (d.o.f.) |
|---|---|---|---|
| 2 - 4 | I | ||
| II | |||
| III | |||
| IV | |||
| 4 - 6 | I | ||
| II | |||
| III | |||
| IV | |||
| 6 - 8 | I | ||
| II | |||
| III | |||
| IV | |||
| 8 - 12 | I |
8 Discussion and conclusions
The aim of this work has been to study the gas temperature distribution of two
pairs of clusters (A2061–A2067 and A2122–A2124) located in the inner part of
the Corona Borealis supercluster, using Beppo-SAX observations.
Although the emission of A2122 falls under the window support of the detector,
in the region between the centres of A2122 and A2124
we did not find any evidence of interaction.
Also for the pair A2061–A2067 we did not find any clear sign of
interaction: on one side A2061 is significantly elongated towards A2067, but on
the other hand
the velocity difference between the two clusters is too large to be
entirely due to peculiar velocity.
In order to have an estimate of the relative peculiar motion we assumed a simple
model for the collapse of two bodies approaching from infinity. We derived the
masses of A2061 and A2067 using the relation Yee & Ellingson (2003),
finding 390 km s-1, i.e. only 25% of the ,
therefore the distance between A2061 and A2067 is too large to have significant
effects on the intracluster medium.
In Table 9 we summarize some information
about these clusters obtained during our study.
In Figure 16 we show the relation for a sample of 167
clusters from Wue et al. (1999), adding our data for A2061 (triangle), A2067
(square) and A2124 (pentagon).

Looking at this figure it can be seen that all the studied clusters are in
agreement with the relation. It can also be noticed that A2067 is more similar
to a galaxy group than to a cluster, given its low temperature and its
position in the plane.
Analysing temperature profiles and maps of these clusters we found that their
temperature distributions do not show strong deviations from an isothermal
behaviour. The only exception is represented by a region in A2061: we found
that, in the bin 2–4 arcmin sector I, there is a significant increase of
temperature (=10.67 keV) which is not
consistent at 2.5 sigma with that
of the global fit (=4.52 keV).
This feature likely corresponds to the presence of an internal shock.
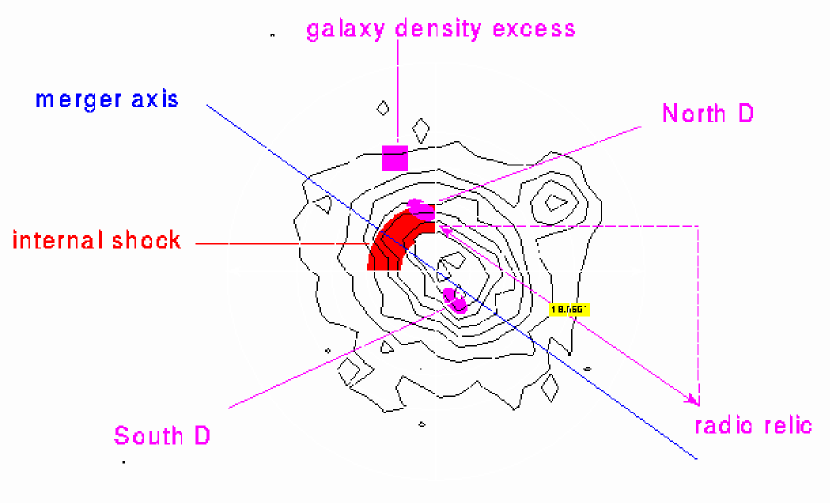
Our scenario is that a group is falling inside
A2061 and forms the shock in the major cluster. The infall is
along the axis individuated by the elongation of the cluster
(), as shown in Figure 17, that
summarizes the geometry projected on the plane of the sky.
Note that in the same direction, but on the opposite side, at
18 arcmin ( 1.05 h-1 Mpc ) from the X-ray centre, a relic is
located, a radio source normally associated with an ongoing merging
(Kempner & Sarazin, 2001).
However, the spatial resolution of Beppo-SAX is not able to separate the
emission of the infalling group from that of A2061.
This hypothesis is consistent with the behaviour of the two dominant galaxies:
the North D galaxy is at rest in the velocity space with respect to the
cluster, but is significantly offset with respect to the
centre of the X-ray emission (at a projected distance of 0.19 h-1 Mpc ).
At a projected distance of 0.16 h-1 Mpc from the X-ray centre there is
another dominant galaxy, which has a velocity difference with respect to the
cluster of
980 km s-1. It is important to note that both the dominant
galaxies axis inclinations ( and , respectively) are similar to that of the
merger axis.
By studying the bidimensional distribution of optical galaxies we found a
significant galaxy excess in the position reported as a square in Figure
17. It is likely that these galaxies
are part of the infalling group.
We suppose that the group and A2061 are in the phase of interaction in which
the cores have not
encountered yet: in this phase the formation of a shock between the cores is
expected.
If the gas within the shocked region
is nearly isothermal, we can calculate the ratio between the velocities after
() and before () the shock (Markevitch et al. 1999, equation (2))
as:
where we used the temperatures keV and keV.
We used for the value derived for sector II, annulus 2–4 arcmin,
which is specular to the shock position with respect to the cluster center.
Given this value, the expected surface brightness ratio is:
Actually we find that the ratio between the counts in the bin 2–4 arcmin
sector IV (position of the shock) and
II (at a specular position with respect to the centre of the cluster)
is nearly 1. This inconsistency is probably due to the fact that the region
interested by the interaction is much smaller than the analysed bin and than
the MECS PSF. From simulations, produced with the same characteristics of
our observations, we estimated that this shock could be detected only if
its sizes exceed h-1 kpc .
A higher spatial resolution of observation (f.i. with Chandra or XMM)
is needed to assess this scenario.
The resulting difference of the gas flow after and before the shock is
(Markevitch et al. 1999, equation (1)):
where we assume a plasma with mean molecular weight . Note that this
value
of is similar to that of the cluster A3667 (Markevitch et al., 1999).
On the other hand, if we assume that the kinetic energy is completely converted
into thermal energy, following Shibata et al. (1999), we find:
These two values found for , arising from different physical
hypotheses, can be considered as upper and lower limits.
This velocity range corresponds to a Mach number in the range
These values can be compared with the typical value of 1.4 given by
the semi-analytical models by Gabici & Blasi (2003): however, considering the
Mach number distribution of mergers happened in the last one billion years,
the same authors (see their figure 8) show a significant tail at .
In conclusion, the global scenario can be the following.
A group of galaxies, arriving from North–East, impacted on the cluster A2061.
As a consequence of the interaction of these two structures, the galaxies of
the group precede its intracluster medium, as predicted by numerical simulation
(see e.g. Tormen et al. 2003).
Indeed the X-ray emission excess seen in Figure 1
North–East of A2061 (labelled as Plume) could be the remnant of the group
ICM, while its galaxies can be located
in correspondence of the optical overdensity shown in Figure
17.
The fact that the merging axis points towards A2067 can be an indication of the
existence of a filament, on which both A2061 and A2067 lie and along which the
group merged in A2061.
| Cluster | kTglobal | Lbol | F[2-10]keV | L[2-10]keV | Cbi | Sbi |
|---|---|---|---|---|---|---|
| keV | erg s-1 | erg cm-2 s-1 | erg s-1 | km s-1 | km s-1 | |
| Abell 2061 | 4.52 | 2.45 h-2 | 1.72 | 1.21 | 23699 70 | 780 |
| Abell 2067 | 1.54 | 0.21 h-2 | 8.62 | 0.58 | 22166 79 | 536 |
| Abell 2124 | 4.41 | 0.56 h-2 | 0.58 | 0.28 | 19684 110 | 862 |
Acknowledgments
This research has made use of linearized event files produced at the Beppo-SAX Science Data center. This work has been partially supported by the Italian Space Agency grants ASI-I-R-037-01 and ASI-I-R-063-02, and by the Italian Ministery (MIUR) grant COFIN2001 “Clusters and groups of galaxies: the interplay between dark and baryonic matter”. This research has made use of the NASA/IPAC Extragalactic Database (NED) which is operated by the Jet Propulsion Laboratory, California Institute of Technology, under contract with the National Aeronautics and Space Administration. This research has made use of the SIMBAD database, operated at CDS, Strasbourg, France. We thank the referee (dr. H.Ebeling) for helpful comments.
References
- Abell (1958) Abell G.O., 1958, ApJS, 3, 211
- Abell et al. (1989) Abell G.O., Corwin H.G.Jr., Olowin R.P., 1989, ApJS, 70, 1
- Bahcall (1992) Bahcall J.N., 1992, in Clusters and Superclusters of Galaxies, ed. A. Fabian (Dordrecht: Kluwer), 275
- Bardelli et al. (1996) Bardelli S., Zucca E., Malizia A., Zamorani G., Scaramella R., Vettolani G., 1996, A&A, 305, 435
- Bardelli et al. (1998) Bardelli S., Zucca E., Zamorani G., Vettolani G., Scaramella R., 1998, MNRAS, 296, 599
- Bardelli et al. (2002) Bardelli S., Venturi T., Zucca E., De Grandi S., Ettori E., Molendi S., 2002, A&A, 396, 65
- Blakeslee & Metzger (1999) Blakeslee J.P., Metzger M.R., 1999, ApJ, 513, 592
- Boella et al. (1997a) Boella G., Butler R.C., Perola G.C., Piro L., Scarsi L., Bleeker J.A.M., 1997a, A&AS, 122, 299
- Boella et al. (1997b) Boella G., et al., 1997b, A&AS, 122, 327
- Cappi & Maurogordato (1992) Cappi A., Maurogordato S., 1992, A&A, 259, 423
- Cavaliere & FuscoFemiano (1976) Cavaliere A., Fusco-Femiano R., 1976, A&A, 49, 137
- D’Acri et al. (1998) D’Acri F., De Grandi S., Molendi S., 1998, Nucl.Phys., 69/1-3, 581
- De Grandi & Molendi (2001) De Grandi S., Molendi S., 2001, ApJ, 551, 153
- De Grandi & Molendi (2002) De Grandi S., Molendi S., 2002, ApJ, 567, 163
- Dickey & Lockman (1990) Dickey J.M., Lockman F.J., 1990, ARA&A, 28, 215
- Ebeling et al. (1996) Ebeling H., Voges W., Böhringer H., Edge A.C., Huchra J.P., Briel U.G., 1996, MNRAS, 281, 799
- Edge et al. (1990) Edge A.C., Stewart G.C., Fabian A.C., Arnaud K.A., 1990, MNRAS, 245, 599
- Ettori et al. (1997) Ettori S., Fabian A.C., White D.A., 1997, MNRAS, 289, 787
- Ettori & Fabian (1999) Ettori S., Fabian A.C., 1999, MNRAS, 305, 843
- Ettori et al. (2000) Ettori S., Bardelli S., De Grandi S., Molendi S., Zamorani G., Zucca E., 2000, MNRAS, 318, 239
- Fiore et al. (1999) Fiore F., Guainazzi M., Grandi P., 1999, Cookbook for Beppo-SAX NFI Spectral Analysis
- Gabici & Blasi (2003) Gabici S., Blasi P., 2003, ApJ, 583, 695
- Kaastra (1992) Kaastra J.S., 1992, An X-Ray Spectral Code for Optically Thin Plasma, Internal SRON-Leiden report, updated version 2.0
- Kempner & Sarazin (2001) Kempner J.C., Sarazin C.L., 2001, ApJ, 548, 639
- Kopylova & Kopylov (1998) Kopylova F.G., Kopylov A.I., 1998, AstL, 24, 4
- Lubin & Bahcall (1993) Lubin L.M., Bahcall, N.A., 1993, ApJ, 415, L17
- Markevitch et al. (1999) Markevitch M., Sarazin C.L., Vikhlinin A., 1999, ApJ, 521, 526
- McKee et al. (1980) McKee J.D., Mushotzky R.F., Boldt E.A., Holt S.S., Marshall F.E., Pravdo S.H., Serlemitsos P.J., 1980, ApJ, 242, 843
- Mewe (1995) Mewe R., Kaastra J., Liedhal K., 1995, Legacy 6, 16
- Oegerle & Hill (1998) Oegerle W.R., Hill J.M., 1998, AJ, 116, 1529
- Oegerle & Hill (2001) Oegerle W.R., Hill J.M., 2001, ApJ, 122, 2858
- Oppenheimer et al. (1997) Oppenheimer B.R., Helfand D.J., Gaidos E.J., 1997, AJ, 113, 2134
- Parmar et al. (1997) Parmar A.N., et al., 1997, A&AS, 122, 309
- Perri & Capalbi (2002) Perri M., Capalbi M., 2002, A&A, 396, 759
- Postman et al. (1988) Postman M., Geller J.M., Huchra J.P., 1988, AJ, 95, 267
- Sarazin (1988) Sarazin C.L., 1988, X-ray emission from the cluster of galaxies, Cambridge University Press
- Sarazin (2000) Sarazin C.L., 2000, in Costructing the universe with Clusters of Galaxies, Durret F. & Gerbal D. eds., electronic proceedings http://www.iap.fr/Conferences/Colloque/coll2000/contributions
- Shibata et al. (1999) Shibata R., Honda H., Ishida M., Ohashi T., Yamashita K., 1999, ApJ, 524,603
- Small et al. (1997) Small T.A., Sargent W.L.W., Hamilton D., 1997, ApJS, 111, 1
- Small et al. (1998) Small T.A., Ma C., Sargent W.L.W., Hamilton D., 1998, ApJ, 492, 45
- Struble & Rood (1999) Struble M.F., Rood H.J., 1999, ApJS, 125, 35
- Tormen (1997) Tormen G., 1997, MNRAS, 290, 411
- Tormen (2004) Tormen G., Moscardini L., Yoshida N., 2004, MNRAS, 350, 1397
- Venturi et al. (2000) Venturi T., Bardelli S., Morganti R., Hunstead R.W., 2000, MNRAS, 314, 594
- Wue et al. (1999) Wue X., Xue Y., Fang L., 1999, ApJ, 407, 470
- Yee & Ellingson (2003) Yee H.K.C., Ellingson E., 2003, ApJ, 585, 215
- Zucca et al. (1993) Zucca E., Zamorani G., Scaramella R., Vettolani G., 1993, ApJ, 407, 470