Long time-scale variability in GRS 1915105
Abstract
We present very high resolution hydrodynamical simulations of accretion discs in black hole X-ray binaries accreting near the Eddington limit. The results show that mass loss, irradiation and tidal interactions all have a profound effect on the observed behaviour of long period X-ray transients. In particular, the interplay of all of these effects in the outer regions of the accretion disc is able to drive long time-scale (weeks to years) variability is these objects, and is a possible origin for some of the extreme variability of GRS 1915+105.
keywords:
accretion, accretion discs - binaries: close - stars: individual: GRS 1915105.1 Introduction
The outbursts of long period X-ray binaries involve accretion rates close to the Eddington limit. Consequently, the evolution of the massive accretion discs in these objects is expected to be highly influenced by mass loss and irradiation by the central X-ray source. Outbursts of this nature are thought to power the most luminous stellar X-ray sources such as the galactic microquasars and at least some of the recently discovered ultra-luminous X-ray sources in nearby galaxies (King, 2002). In this paper we investigate the evolution of accretion discs and the origin of the long-term variability in the outbursts of long period X-ray transients, using the galactic microquasar GRS 1915+105 as an example system.
The galactic microquasar GRS 1915+105 (V1487 Aql) was discovered as an X-ray transient in 1992 (Castro-Tirado, Brandt & Lundt, 1992), and has been observed to be extremely luminous ever since. This binary system contains a 14 black hole (Greiner, Cuby & McCaughrean, 2001) accreting from a late-type giant of mass (Harlaftis & Greiner, 2004) via Roche lobe overflow. GRS 1915+105 is unique among accreting Galactic black holes spending much of its time at super-Eddington luminosities (Done, Wardzinski & Gierlinski, 2004). It is an extremely variable source, exhibiting dramatic, aperiodic variability on a wide range of timescales, from milliseconds to months. Figure 1 shows the Rossi X-ray Timing Explorer All-Sky Monitor observations of X-ray flux from GRS 1915+105 over the past decade.
The fundamental origin of this spectacular behaviour is thought to be an outburst similar to those exhibited by other X-ray transients, but of a much longer duration. The outbursts of X-ray transients are believed to be initiated by a thermal-viscous accretion disc instability, and prolonged by the heating effect of the central, irradiating X-ray source (King & Ritter, 1998; Dubus, Hameury & Lasota, 2001; Truss et al., 2002). The extremely long time-scale of the outburst of GRS 1915+105 is a consequence of its long 33.5 day orbital period, which implies a very large disc size (). Such a large disc can accumulate an enormous amount of mass during quiescence, which is able to support a subsequent super-Eddington outburst over many decades.
So far, most models of the variability of GRS 1915+105 have concentrated on explaining the origin of the short time-scale luminosity changes associated with the inner regions of the accretion disc (for example, Belloni et al. 1997), although King et al. (2004) have proposed a mechanism for generating variability on a wider range of time-scales, in which outflows of mass from the disc are driven by localised magnetic dynamo processes . However, the origin of longer-term, aperiodic variations on timescales of hundreds of days remain poorly understood as these are most likely driven by dynamical evolution of the outer disc.
In this paper we present the results of two-dimensional (2D) calculations of the long-term evolution of an accretion disc in a long-period X-ray binary accreting close to the Eddington limit, using GRS 1915+105 as an example system. We include the effects of tidal instability, central irradiation and mass loss on the disc evolution. We show that the interplay of these effects in the outer regions of the disc can induce similar variability to that observed in GRS 1915+105.

2 Numerical Model
In this section we discuss several key refinements that have been made to an existing smooth particle hydrodynamics (SPH) code.
SPH is a Lagrangian scheme used to describe the dynamics of fluid flow. A continuous gas is described by an ensemble of particles moving with the local fluid velocity. Local properties such as velocity, density and temperature are determined by an interpolation over the neighbouring particles and in this way the fluid equations may be solved. In the continuum limit (that is, for a large enough number of neighbour particles), the SPH equations for momentum, thermal energy and so on reduce to the exact fluid equations. The reader is referred to Monaghan (1992) for a review.
The code used for this work is based on a vectorised version of the three-dimensional accretion disc code developed by Murray (1996). There are four key elements of physics that must be included in a code that attempts to describe the behaviour of a system like GRS 1915105, accreting near the Eddington limit: an implementation of the viscous instability to drive the outburst, a description of the tidal forces of the secondary star on the disc, the effect of self-irradiation of the disc by the X-rays generated near the primary and mass loss when the Eddington limit is breached. We will describe each of these in turn.
2.1 Viscous instability
The disc instability, which is driven by the onset of ionization in the temperature range 6,000 to 7,000 K, is implemented by a viscous switch based on the local disc conditions. The viscosity, , is given by the formula of Shakura & Sunyaev (1973):
| (1) |
where is the local sound speed, the scale height and is the viscosity parameter. It is well known that the increase in temperature at the transition from quiescence to outburst is insufficient to provide the angular momentum transport required to drive the mass accretion rates observed during an outburst. Hence, it is inferred that the heating is accompanied by an increase in the viscosity parameter . In previous SPH studies of outbursts in accretion discs, was allowed to change instantaneously (Murray, 1998), or on some fixed time-scale (Truss et al., 2000), but was kept fixed. Here, we allow the sound speed as well as the viscosity parameter to vary on a time-scale that is determined by the local conditions. Recently, a similar method was applied to the outbursts of cataclysmic variables (Truss, Wynn & Wheatley, 2004). The method is able to reproduce a full, realistic outburst amplitude with none of the scaling factors required by the previous schemes that used a constant sound speed everywhere. In this approach, we would not reproduce the expected temperature profile of a disc in steady state, where , because we have lower and upper bounds to the sound speed (but allow a continuum of states between). However, as we shall see, once the outburst is underway the disc as a whole spends little or none of its time in a single state and most of its behaviour is governed by local processes; changes in sound speed and mass loss occur in relatively small regions, rather than globally across the disc. It is not clear, then, that a fully self-consistent calculation - computationally, this remains inviable in a two-dimensional hydrodynamic simulation of this magnitude - would produce vastly different results. Until this becomes possible, we believe that the method we describe here, which allows for realistic local changes in sound speed, offers a better prospect than the fully-isothermal schemes of the past.
The sound speed and temperature are changed in response to the local surface density calculated at the position of each particle. We define critical surface densities, and to trigger an outburst and to return to quiescence respectively. These critical values scale almost linearly with radius in the disc (Ludwig, Meyer-Hofmeister & Ritter, 1994). When the surface density at a particle crosses one of these values, both the sound speed and the viscosity parameter are changed smoothly according to
| (2) |
and
| (3) |
The thermal time-scale for the change, , is defined as the ratio of the heat content per unit (projected) area of the disc, , to the total rate of energy loss per unit area, which taking into account both faces of the disc is . Therefore, the thermal time-scale
| (4) |
2.2 Tidal forces and mass transfer
The calculations are performed in the full Roche potential of a binary system. In this way the tidal influence of the secondary star is intrinsic to the scheme. For the mass ratio inferred for GRS 1915105, we expect the tides to have a significant effect on the orbits near the outer edge of the accretion disc, and to launch a two-armed spiral wave. Mass transfer from the secondary star is implemented by the injection of particles at the inner Lagrangian point. The rate of mass injection is independent of the physical conditions at the edge of the disc and is kept constant throughout the calculation, regardless of whether the disc is quiescent or in outburst.
2.3 Irradiation
We use a simple model due to King & Ritter (1998), in which the X-rays emitted near the black hole keep the disc in the hot, high viscosity state out to a certain radius which is determined by the central accretion rate. Matching the irradiation temperature to the minimum temperature to keep hydrogen ionised, , we have
| (5) |
where is the accretion efficiency and is a factor dependent on the albedo, the disc geometry and the form of the irradiating source. For the typical parameters of a disc around a black hole given in King & Ritter (1998), we have
| (6) |
where is the central accretion rate in units of . In the calculations, all particles within are given the high state viscosity and sound speed .
2.4 Mass loss
In the next section we will discuss the results of three calculations of outbursts in GRS1915105. In each calculation, the mass loss due to the Eddington limit being exceeded is dealt with in a different way. In the first, which is intended to act as a control case, the limit is ignored and is allowed to evolve for accretion rates beyond the Eddington limit. In the second, is only allowed to increase up to a maximum value corresponding to a central accretion rate equal to the Eddington rate.
In the third calculation, individual particles are removed locally from the accretion disc where the Eddington limit is breached, not just at the inner boundary. The local mass accretion rate at each radius in the disc is calculated from
| (7) |
The Eddington accretion rate at a radius is
| (8) |
where is the Eddington luminosity. Particles are removed from the disc before they cross the inner disc boundary wherever , or
| (9) |
where is the radius of the inner boundary.
It is of primary concern in such a scheme, where particles or groups of particles are being removed from the flow, that spatial resolution is not degraded severely. With this in mind, we use a smoothing length that varies according to the local density. The response of the smoothing length is such that each particle maintains at least 50 nearest neighbour particles.
3 Results
In this section we present the results of three very large two-dimensional SPH calculations of accretion discs in a binary system with parameters similar to those of GRS 1915105: , and . We use , , which correspond to mid-plane temperatures of and respectively, assuming a mean molecular weight , appropriate for a fully ionised mixture of gases (strictly, of course, this value of is not self-consistent for the neutral gas in the low state. A better estimate of in the low state would be higher, although this would have little effect on the global evolution of the disc through an outburst in the simulations).
The accretion efficiency is set to . Our choice of viscosity parameters, and , is slightly higher than we would ideally choose, but is necessitated by our need to simulate a very long time series of data with a limited amount of dedicated supercomputer time. We discuss the implications of using different viscosity parameters fully in Section 4.
The mass transfer rate is calculated from the formula of Ritter (1999):
| (10) |
which is appropriate for nuclear time-scale-driven mass transfer from an evolved companion star. In this case, the formula gives . This is already close to the Eddington rate (near the black hole); the implications of such a rate are also discussed in Section 4.
Each of the three simulations have identical initial conditions: a steady-state accretion disc with particles. This places these simulations among the largest accretion disc simulations ever attempted with SPH. The simulations were run on the UK Astrophysical Fluids Facility (UKAFF) during allocated time awarded in late 2003.
3.1 Simulation 1

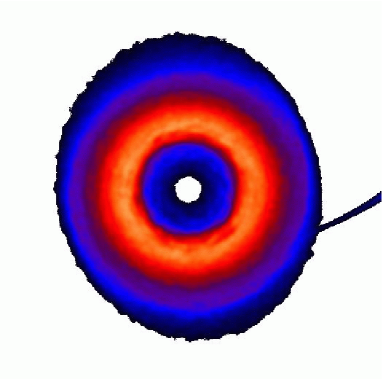
The accretion disc was allowed to evolve through an outburst with no restriction on the irradiation radius and no mass loss. Figure 2 shows the resulting time-variations in total rate of energy dissipation per unit mass in the disc (summed over all particles), , central accretion rate and irradiated radius, .
The central accretion rate rises by two orders of magnitude to a peak at , and the entire disc is irradiated. The outburst profile that results is very simple: as the disc is kept in the hot, highly viscous state by the central X-rays, we see an exponential decay as the classic ’flat-top’ to the outburst. After six months or so, the irradiation radius has retreated to the inner edge of the disc, and we see a rapid decline to the quiescent state, which persists until the end of simulation. The number of particles remaining at the end of the outburst is 189,307, corresponding to the net accretion of of the total mass of the disc. Each particle has a mass , so the total mass accreted during the outburst is .
Clearly, this simulation cannot explain GRS 1915105, but the behaviour is consistent with the results of simulations of the short period X-ray transient A0620-003 in Truss et al. (2002), where a similarly simple outburst was obtained in the case where the entire disc becomes irradiated by the central X-ray flux.
3.2 Simulation 2

In this simulation, we assume that the Eddington limit holds at the inner boundary of the accretion disc. Material accreting at a rate higher than is assumed to be lost from the system and does not contribute to increasing the fraction of the disc that is illuminated by the central X-rays.
Therefore, the irradiated fraction of the disc is limited to a maximum value corresponding to accretion at the Eddington rate through the inner boundary. We use , which gives , where is the binary separation.
The contrast between the resultant outburst, shown in Figure 3, with that of the previous simulation is stark. As expected with identical initial conditions, the initial rise to outburst maximum proceeds exactly as before. However, after a short time, reaches its maximum value, and remains there for about two orbits of the binary while the central accretion rate is super-Eddington. Following this plateau, the accretion rate declines and enters a phase of aperiodic variability that is reflected in the energy dissipation rate in the disc. We note from the lower two panels of Figure 3 that the maximum central accretion rate during these flares does not exceed the Eddington rate at the inner boundary. The flaring behaviour continues until the end of the simulation at orbits, long after the last data point shown in the figure. Of course, we do not know for sure if the system would return to quiescence if the simulation could be run indefinitely. However, from the data we have, it seems that the system has found a quasi-steady state: the time-averaged accretion rate over the whole simulation is very close to , which is the rate at which mass is added to the disc from the secondary star.

Figure 4 shows the evolution of the surface density profile of the disc during the initial stages of the simulation. While the central accretion rate is super-Eddington, a large spike of gas builds up at the hot/cold boundary. As the highly viscous, hot gas spreads, most of the gas outside is pushed over the critical limit and starts to participate in the outburst. However, this plot does not seem to explain the origin of the flaring behaviour. The surface density profiles are produced by averaging over azimuth, and much information about the structure of the flow is lost in producing them.
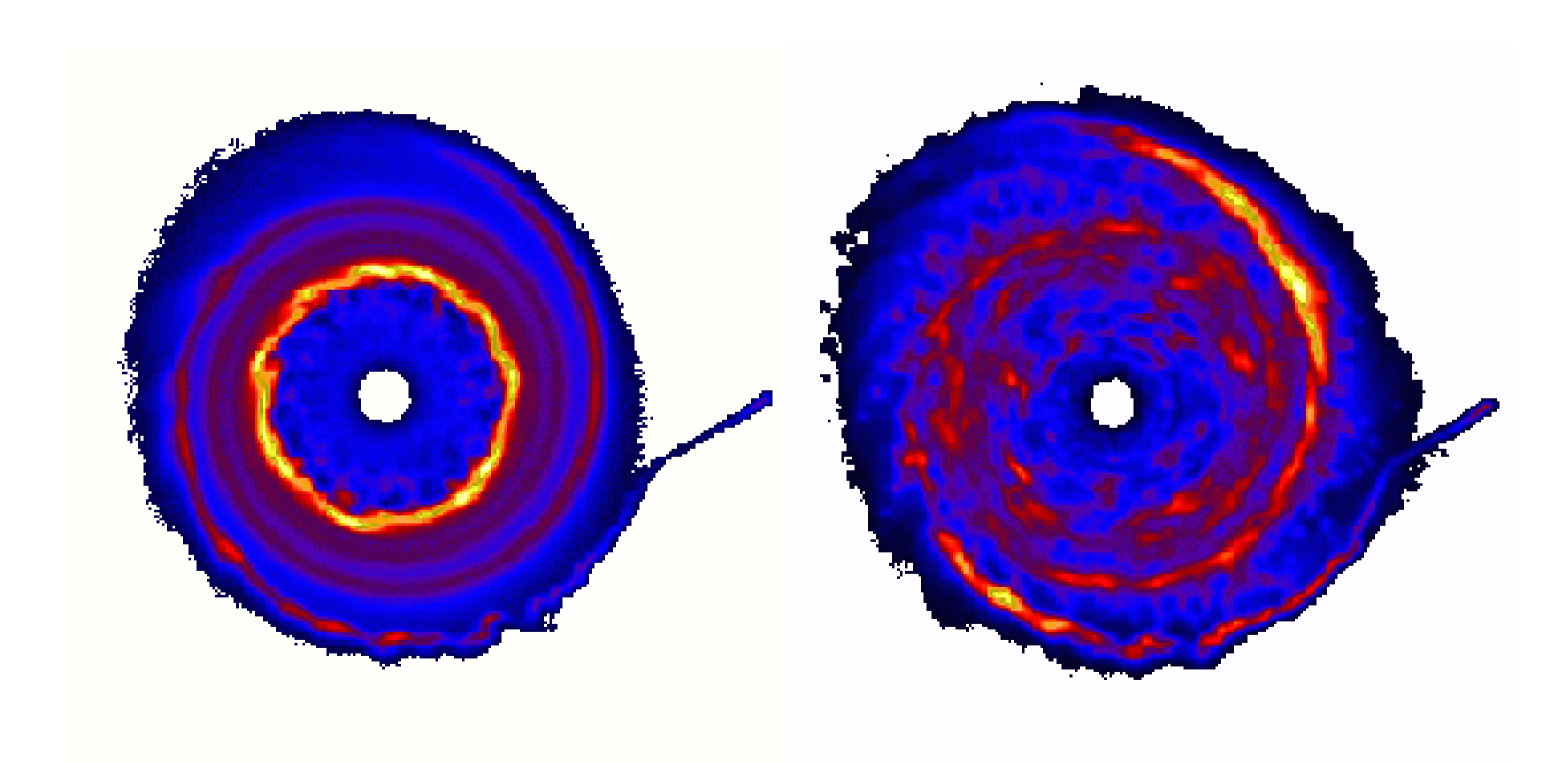
Figure 5 shows the full density structure of the flow at two times during the simulation; at maximum at =0.4, and later on during the flaring behaviour at =5.0. The initial state of the disc is rather smooth with some weak spiral arm features (these can still be seen in the outer part of the disc in the left-hand image of Figure 5). After the onset of the outburst, however, it can be seen immediately that the flow through the fixed hot/cold boundary is neither steady nor smooth. The disc is left with a clumpy, inhomogeneous structure, and it is the accretion of the over-dense clumps of gas that lead to the subsequent flaring behaviour. This is a direct consequence of fixing for a short time when the accretion rate onto the black hole is super-Eddington. We have already seen in simulation 1 that this structure does not develop if is not fixed.
It is interesting to note that the tidally-induced features are preserved as the outer edge of the disc expands during the outburst. Despite the unevenness of the flow, a strong two-armed spiral wave is evident by =5.0 orbits (right hand side of Figure 5) that penetrates deep into the disc. In fact, it is the interaction of the spiral arms with the hot/cold boundary that leads to the variability in this simulation. While the gross structure of the spiral arms is preserved, locally their structure is determined by the fluctuations in pressure and density induced at .
The gas near the outer edge moves on eccentric orbits, and this eccentric structure does indeed precess in a prograde fashion in exactly the manner expected for a tidally-unstable disc. There is no evidence of superhumps: the periodic variations in dissipation rate observed in tidally-unstable cataclysmic variables that are caused by gas in orbits resonant with the orbital frequency of the binary. However, this is unsurprising because here the dominant component of the energy dissipation rate comes from the irradiated inner disc, not the tidally stressed outer orbits.

The local mass accretion rate through the disc during the outburst is extremely high. Figure 6 shows the evolution of the local accretion rate profile for the same time slices as the surface density plots in Figure 4. The initial steady-state profile is given in the top panel and is reproduced as a dotted line in the lower panels to aid comparison. The mass transfer rate at the outer edge of the disc remains constant at all times and save for some structure associated with the spiral arms near =0.4, the steady-state profile is constant with radius at a value close to - the rate of mass transferred from the donor star. When the spike of gas develops at the irradiated boundary, the local accretion rate rises to a maximum near , well sufficient to sustain a super-Eddington central rate. By =5 orbits, when the main part of the outburst is over and the flaring behaviour is underway, the profile approaches that of the steady initial state, but varies in response to the local inhomogeneity of the flow caused by the clumps and spiral structure.
3.3 Simulation 3

Here, mass is removed from the disc locally whenever the accretion rate exceeds the local Eddington accretion rate. This is the condition that has been defined in equation 9, where we use and as before. No restriction on is necessary, because by the time the gas reaches the inner boundary, the accretion rate is by definition less than or equal to the Eddington rate. The results are shown in Figure 7. Again, the outburst starts in the same way as before, but here, when the large spike in surface density and local accretion rate develops at , a large amount of gas is blown away. Unlike in the previous simulations, this gas never reaches the inner boundary, and although variability in the central accretion rate is produced, there is less mass involved and the appearance of the outburst profile is simplified. This is reflected in the depleted appearance of the disc, especially near the inner boundary, at times later than orbits (Figure 8). The flares appear to be more regular than in the previous case, although there is some evolution in the variability. This is in response to the large mass-loss rate at the beginning of the simulation. Figure 9 shows an expanded section of the mass accretion rate through the inner boundary in three 1000-day sections. The periodicity of the variations decreases gradually, but by the flares have settles into a quasi-steady state, recurring on a time-scale of . It should be noted that the time-scale of these flares is inextricably linked to the amount of mass lost in the disc, and this depends on the value of and the accretion efficiency. We discuss this in more detail in Section 4 below. In order to minimise noise, the central accretion rate is calculated over intervals of 50 time-steps during the simulation, rather than considering the highly discretized case of counting an integer number of particles accreted during a single finite time-step. 50 time-steps correspond to 1.3 days in Figure 9, hence we are confident that even the shorter time-scale variations that we find in the simulations are not attributable to noise.
The bottom panel of Figure 7 shows the rate at which mass is removed from the disc before it reaches the black hole. After the initial burst, the mass loss rate settles down and oscillates around a mean value of .

4 Discussion
Our results show that mass loss, irradiation and tidal interactions all have a profound effect on the observable properties of long period X-ray transients. In particular, the interplay of all of these effects in the outer regions of the accretion disc is able to drive long time-scale (i.e. months to years) variability is these objects, and is a possible origin for some of the extreme variability of GRS 1915+105.
The physical process that drives these variations occurs in three main stages. In the first stage, after the onset of an outburst, the mass accretion rate rises and the disc becomes irradiated out to a certain radius . If the Eddington limit holds, this radius is limited to a maximum value corresponding to accretion at the Eddington rate at the inner boundary of the disc. We have shown that the flow through a fixed hot/cold boundary is neither steady nor smooth. Gas in the unirradiated part of the disc rapidly crosses the critical threshold for the disc instability and the remainder of the accretion disc now makes the transition to the hot, high viscosity state. In the third and final stage, the interaction of non-axisymmetric structure (here, the spiral waves induced by the tidal stresses of the companion star on the disc) with the unsteady hot/cold boundary produces a rather inhomogeneous flow. The local variations in density and mass accretion rate produce the variations in accretion rate seen in our models. A further layer of complexity in the variations is added when local mass loss from the disc (here assumed to be in the form of a wind) is taken into account.
The variable which has the most impact on the variability that is predicted by this model is the magnitude of , the radius to which the disc can be irradiated for accretion at the Eddington limit. This is sensitive to the geometry of the disc and the illuminating X-ray source and to the accretion efficiency. It is probable that self-shadowing and radiative warping of the disc will play some part in the behaviour, which we have not considered here. If the accretion efficiency is particularly low, is correspondingly closer to the black hole, perhaps at some radius smaller than we can resolve for the inner boundary of our disc in these simulations. While this will impact upon the time-scale of the variations caused by local mass loss - the rate of mass loss depends on the local Eddington rate, which increases with radius - any variations caused by mass loss at smaller radii will occur on shorter time-scales and not affect the gross long-term behaviour that we find in simulation 3. Furthermore, the inhomogeneity that starts to appear near the hot/cold boundary rapidly spreads to the whole disc outside . The triggering factor for the long time-scale variability is that the boundary remains fixed, regardless of its magnitude.
A related issue is the duration of the initial high central accretion rates, which we find at the beginning of simulations 2 and 3. Whether such an event is present in the observed X-ray light curve in Figure 1 is debatable: the case rests on whether the initial high state that decays over the first 100 days or so of the outburst is part of a single, coherent event or not. We can, however, comment upon the mechanism that produces the initial high state in the simulations. It is caused by the accretion of material that starts off inside , and becomes irradiated. It follows that the duration of this initial burst will depend on the viscous time-scale at the position of , which in turn depends on the factors discussed above. Here, our choice of accretion efficiency, and produce a value of that is well outside the inner boundary of the simulated disc. If nature conspires to make smaller than this estimate, the duration of the initial burst would be shorter.
The postulate that the local wind-loss mechanism must occur at small radii and produce short time-scale variations is indeed supported by the results of simulation 3. The mean wind loss rate in the simulation from radii greater than the radius of the inner boundary () is . This is far less than the estimate of to made by Kotani et al. (2000) to explain the hydrogen column density inferred from absorption line spectra. It is more likely that this kind of mass loss rate is generated at much smaller radii in the disc, where is much lower.
A fully realistic model for the viscous processes at work in these discs requires non-ideal magnetohydrodynamics (MHD), as the equivalent value of is likely to vary with disc radius, vertical displacement from the mid-plane and with time. While for numerical reasons the values of which we have used in this work are a little higher than are usually assumed for these discs, the discrepancy is not marked. The entire disc spends almost all of its time in the high viscosity state during an outburst. MHD calculations have shown that the magneto-rotational instability can sustain a mean equivalent viscosity parameter of (Tout & Pringle, 1992). While we use here, the viscosity is dominated by the sound speed, scaling as . The slight overestimate in is easily compensated by our rather conservative estimate of sound-speed in the hot state (described at the beginning of Section 3).
We close by commenting on other factors that contribute to such incredibly high accretion rates during an outburst. If, during a long quiescent period the inner regions of the accretion disc are absent through evaporation, the accretion disc may build up a very large reservoir of mass. This could lead to extremely high accretion rates during a subsequent outburst. In the case of GRS1915105, however, we expect an unusually high mass transfer rate from the companion star, and this could be a fundamental factor in the ability of such systems to achieve and maintain accretion rates near, and perhaps beyond, the Eddington limit. Mass-transfer rates of the order are only achievable in low-mass X-ray binaries that contain significantly evolved companion stars, transferring mass on a time-scale governed by nuclear expansion of the secondary. It is no surprise, then, that GRS 1915105, with its long orbital period and huge accretion disc is one of the few systems in which such behaviour has been observed.
Acknowledgments
MRT acknowledges a PPARC postdoctoral fellowship. The simulations were performed on the UK Astrophysical Fluids Facility (UKAFF). The authors are grateful to Chris Done and also to the referee for helpful and insightful comments. The RXTE light curve was provided by the RXTE/ASM team at MIT and RXTE SOF and GOF at NASA Goddard SFC.
References
- Belloni et al. (1997) Belloni T., Mendez M., King A.R., van der Klis M., van Paradijs J., 1997, ApJ, 488, L109
- Castro-Tirado, Brandt & Lundt (1992) Castro-Tirado A.J., Brandt S., Lundt N., 1992, IAUC, 5590, 2
- Done, Wardzinski & Gierlinski (2004) Done C., Wardzinski G., Gierlinski, M., 2004, MNRAS, 349, 393
- Dubus, Hameury & Lasota (2001) Dubus G., Hameury J.-M., Lasota J.-P., 2001, A&A, 373, 251
- Ebisuzaki et al. (2001) Ebisuzaki T. et al., 2001, ApJ, 562, L19
- Frank, King & Raine (2002) Frank J., King A.R., Raine D.J., 2002, Accretion Power in Astrophysics, 3rd edn. Cambridge University Press
- Greiner, Cuby & McCaughrean (2001) Greiner J., Cuby J.G., McCaughrean M.J., 2001, Nature, 414, 422
- Harlaftis & Greiner (2004) Harlaftis E.T., Greiner J., 2004, A&A, 414, L13
- King (2002) King A.R., 2002, MNRAS, 335, L13
- King & Ritter (1998) King A.R., Ritter H., 1998, MNRAS, 293, L42
- King et al. (2004) King A.R., Pringle J.E., West R.G., Livio M., 2004, MNRAS, 348, 111
- Kotani et al. (2000) Kotani T., Ebisawa K., Dotani T., Inoue H., Nagase F., Tanaka Y., Ueda Y., 2000, ApJ, 539, 413
- Ludwig, Meyer-Hofmeister & Ritter (1994) Ludwig K., Meyer-Hofmeister E., Ritter H., 1994, A&A, 290, 473
- Monaghan (1992) Monaghan J.J., 1992, ARA&A, 30, 543
- Murray (1996) Murray J.R., 1996, MNRAS, 279, 402
- Murray (1998) Murray J.R., 1998, MNRAS, 297, 323
- Ritter (1999) Ritter H., 1999, MNRAS, 309,360
- Shakura & Sunyaev (1973) Shakura N.I., Sunyaev R.A., 1973, A&A 24, 337
- Tout & Pringle (1992) Tout C.A., Pringle J.E., 1992, MNRAS, 259, 604
- Truss et al. (2000) Truss M.R., Murray J.R., Wynn G.A., Edgar R.G., 2000, MNRAS, 319, 467
- Truss et al. (2002) Truss M.R., Wynn G.A., Murray J.R., King A.R., 2002, MNRAS, 337, 1329
- Truss, Wynn & Wheatley (2004) Truss M.R., Wynn G.A., Wheatley P.J., 2004, MNRAS, 347, 569