The stellar disk thickness of LSB galaxies
Abstract
We present surface photometry results for a sample of eleven edge-on galaxies observed with the 6m telescope at the Special Astrophysical Observatory (Russia). The photometric scale length, scale height, and central surface brightness of the stellar disks of our sample galaxies are estimated. We show that four galaxies in our sample, which are visually referred as objects of the lowest surface brightness class in the Revised Flat Galaxies Catalog, have bona fide low surface brightness (LSB) disks. We find from the comparison of photometric scales that the stellar disks of LSB galaxies are thinner than those of high surface brightness (HSB) ones. There is a clear correlation between the central surface brightness of the stellar disk and its vertical to radial scale ratio. The masses of spherical subsystems (dark halo + bulge) and the dark halo masses are obtained for the sample galaxies based on the thickness of their stellar disks. The LSB galaxies tend to harbor more massive spherical subsystems than the HSB objects, whereas no systematic difference in the dark halo masses between LSB and HSB galaxies is found. At the same time, the inferred mass-to-luminosity ratio for the LSB disks appears to be systematically higher than for HSB disks.
1 Introduction
Low surface brightness spiral galaxies (hereafter, LSB galaxies) have been studied extensively in recent years. Their main distinctive feature from ”regular”, high surface brightness (HSB) galaxies, is roughly a two magnitude lower central surface brightness of their stellar disks. They are thought to harbor massive dark halos (de Blok et al., 2003). The LSB rotation curves are shallower in their central parts (McGaugh et al., 2001), which points toward a large dark matter fraction.
By observing the thickness of the stellar disk in a galaxy, one can constrain the relative mass of the dark halo (Zasov et al., 1991). Until recently, only few edge-on LSB galaxies have been explored in detail (e.g. UGC 7321 Matthews (2000) and IC 5249 van der Kruit et al. (2001)).
We conducted a study of a small uniform sample of LSB and HSB galaxies observed with the same instrument to compare their structural parameters. Here we present the results of photometric observations in the V and R bands of a sample of eleven edge-on galaxies. The paper is structured as follows: in section 2 we describe the sample of galaxies and observations. In section 3 we discuss the data reduction and present the structural parameters of our galaxies. In section 4 we use the inferred disk thickness to estimate the dark halo mass. Section 5 contains a discussion of selection effects and relations between the inferred parameters. The main results are summarized in section 6.
2 Sample of galaxies and observations
Our sample is based on the Revised Catalog of Flat Galaxies (Karachentsev et al. (1999), RFGC hereafter). All galaxies included in this catalog are highly inclined objects. We select object from the faintest surface brightness (SB) class (IV according to RFGC) as candidates to LSB galaxies, and objects from intermediate or high surface brightness classes as reference HSB objects. We narrowed the sample of objects to galaxies large enough for srtuctural studies (major axis size 2 ′ in RFGC) which fit inside the 3.5 ′ field-of-view of our CCD imager. In three observing nights of our program we obtained data for 11 galaxies.
Photometric observations were performed with the prime focus camera on the 6-m telescope at the Special Astrophysical Observatory of the Russian Academy of Sciences. This setup provides a plate scale of 0.2 arcsec/pixel and good sensitivity for faint regions of galaxies. The data were taken on April 27, 28, and 30, 2000 in the Johnson-Cousins V and R photometric bands. The V-band images were utilized mostly for calibration purposes, while the R images were used for the measurements of structural parameters. For most of the galaxies in our sample we made two to four images shifted by a few pixels in both photometric bands.
The Landolt photometric standards (Landolt, 1992) were observed every night. Table 1 summarizes our observations listing object names, surface brightness class (according to RFGC), date of the observation, total integration time in every photometric band, number of exposures, and average seeing when the target was observed.
3 Data reduction and results
The data were reduced using standard tools in the MIDAS package. The images of galaxies and photometric standards were corrected for the bias and dark current, and flat fielded. The images were then sky subtracted, aligned, and combined. We checked the quality of flat fielding and sky subtraction by comparing the background level in those parts of the image that are free of foreground stars and are located close to a sample galaxy. The large-scale pattern of the background does not introduce uncertainties above 0.1%. Three galaxies have very bright stars in their fields, which raises the large-scale background fluctuations up to 0.2%.
Eight and twelve Landolt’s stars from three selected areas were available on April 27 and 30, respectively. The residuals for photometric solutions were 0.m02 for April 27 (in both V and R bands), and 0.m04 (in both V and R bands) for the night on April 30. The sky brightness level is tabulated in Table 1. The surface brightness corresponding to a 3 level of the background noise in the final combined images is shown in Table 1 as well.
The observing conditions were non-photometric during part of the night on April 28. However, most of our galaxies have the major axes photometric profiles in the R band published by Karachentsev et al. (1992). It enables us to verify the calibration and to adjust it for the non-photometric night. The mean difference between the surface brightnesses we derived and those published by Karachentsev et al. (1992) is of the order of 0.m3. The largest source of the discrepance comes from the use of different procedures of the major axis profiles extraction.
Comparison of the sky brightness in R images can be used to estimate roughly the zero point of calibration for the objects taken on April 28. If we use this way of calibration, the R-band surface brightnesses of UGC 9138 and UGC 9556 would be lower than those used in the present paper.
The combined and calibrated images were utilized to obtain the radial scale length , vertical scale height , and ”face-on” central surface brightness of the stellar disk, as well as bulge-to-disk luminosity ratio .
The images were rotated to align the galactic plane parallel to the horizontal axis. Choosing the rotation angle, we point our attention at the intermediate regions of galactic disks where a possible bulge does not reveal itself and the signal-to-noise ratio (S/N hereafter) is high enough.
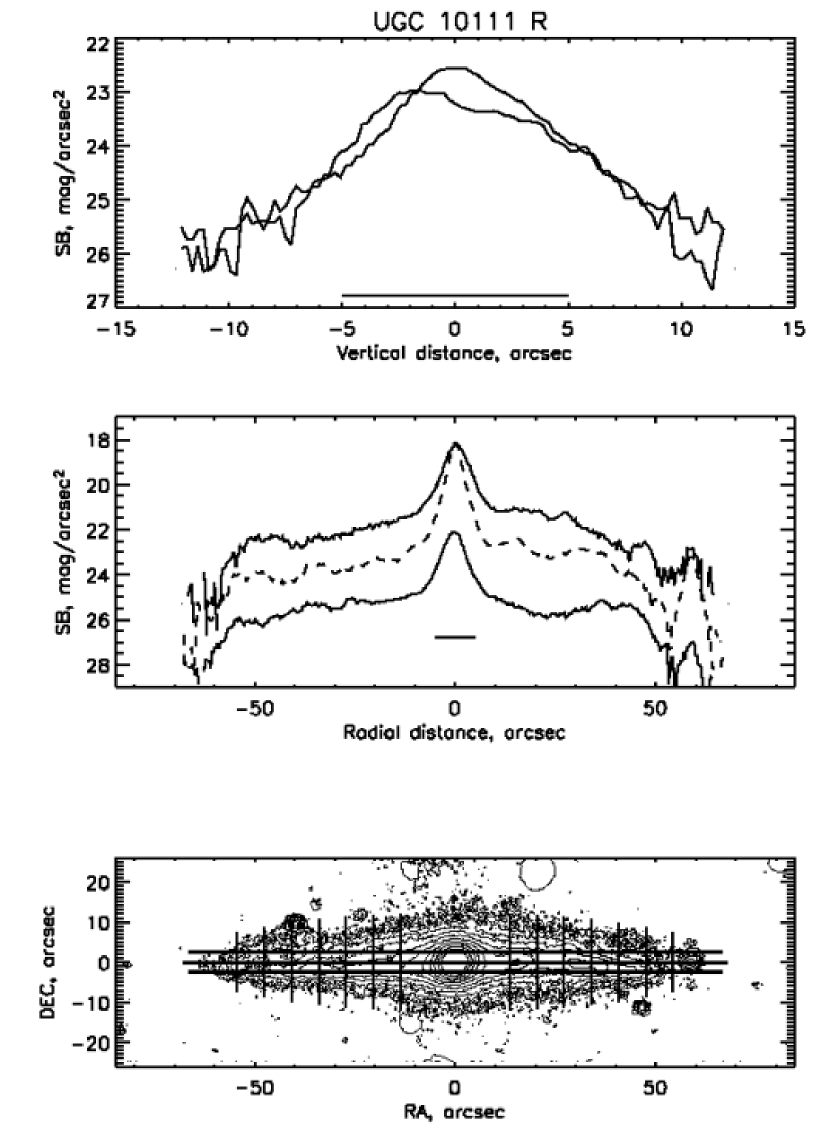
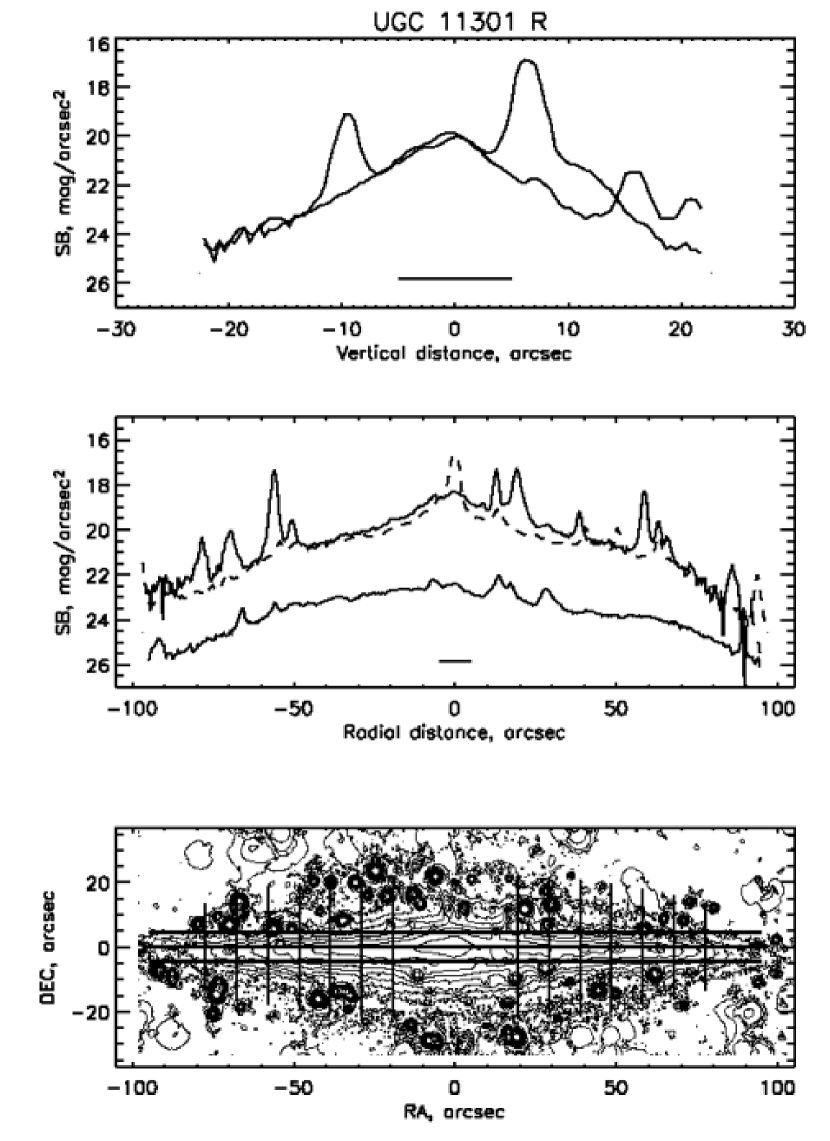
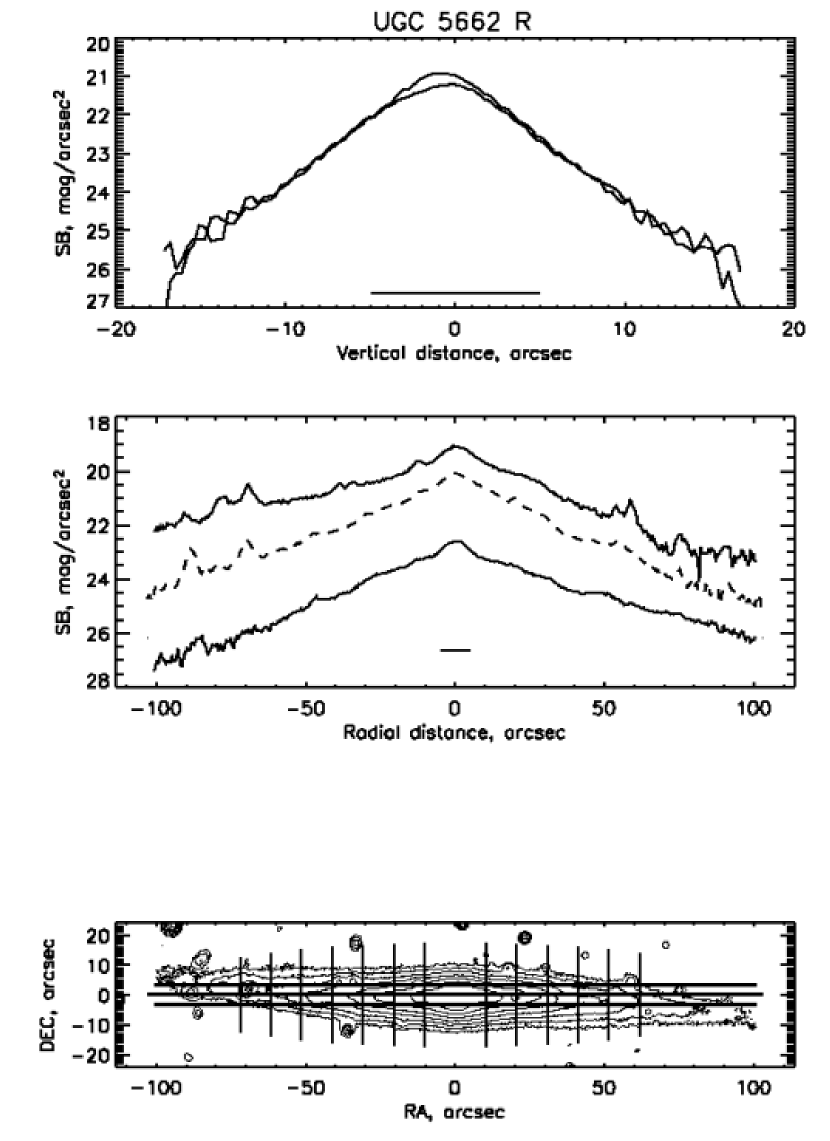
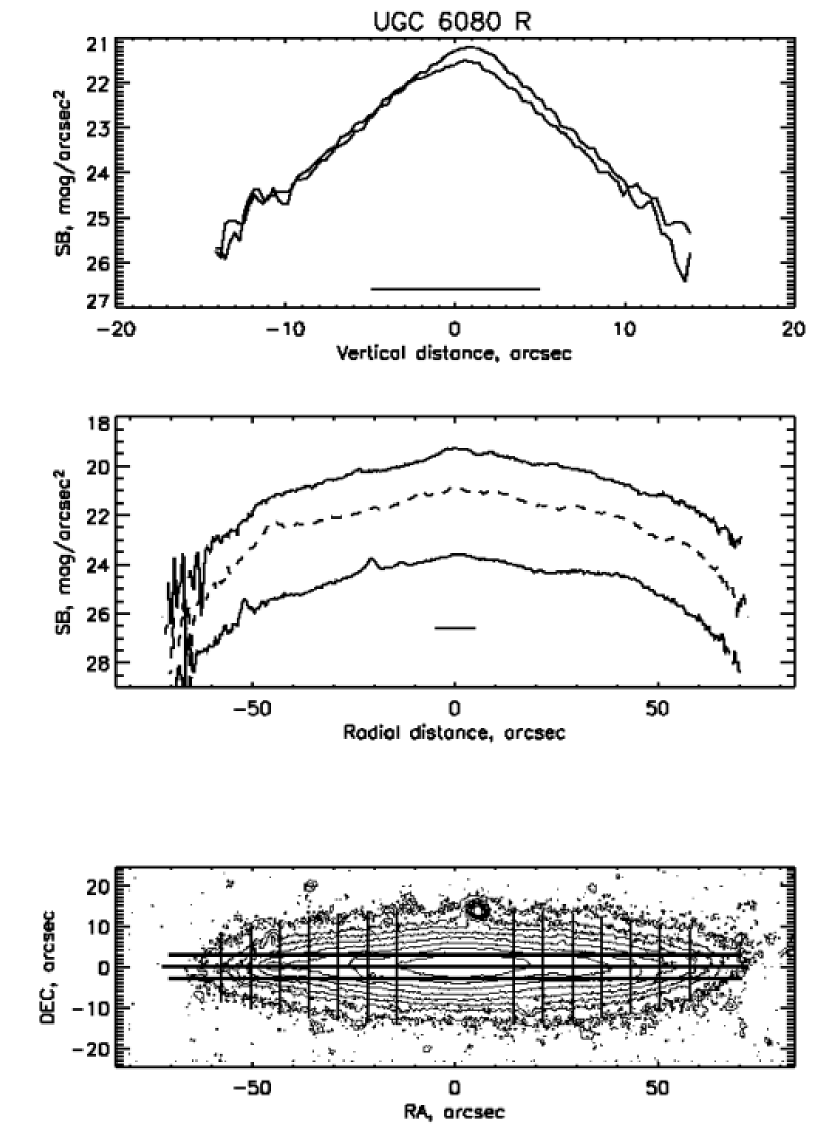
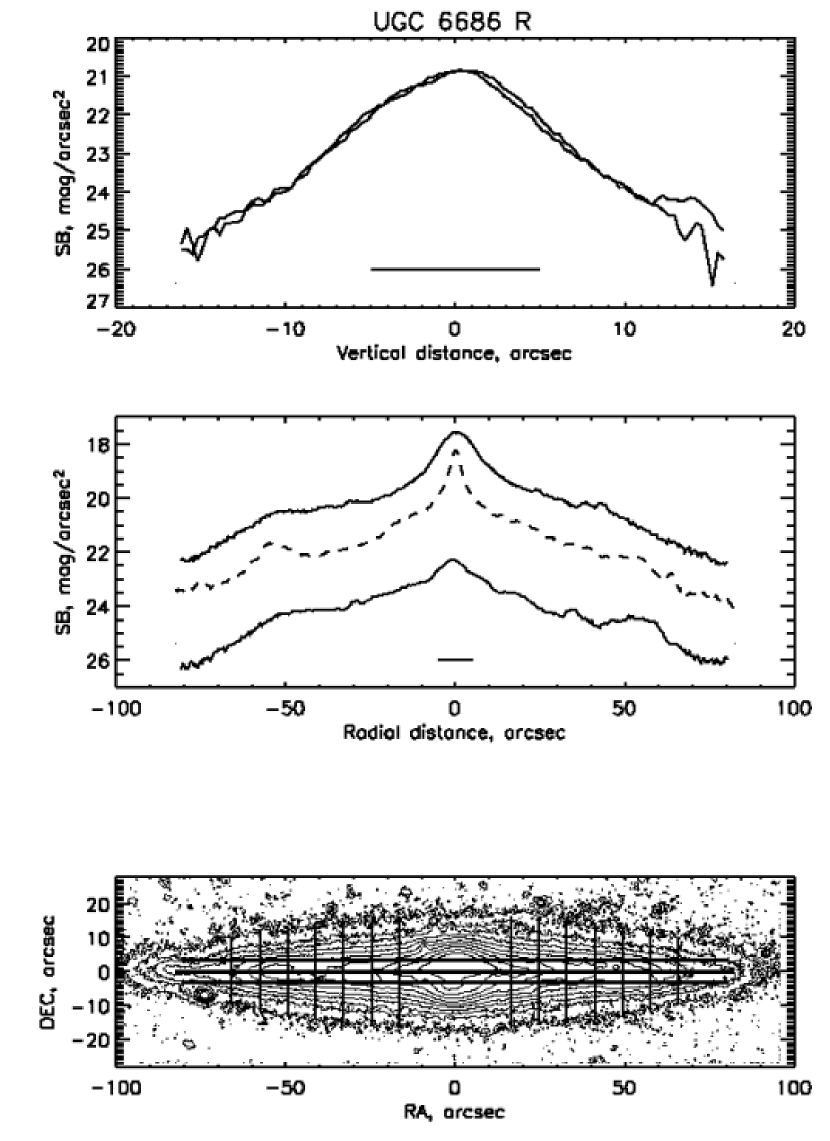
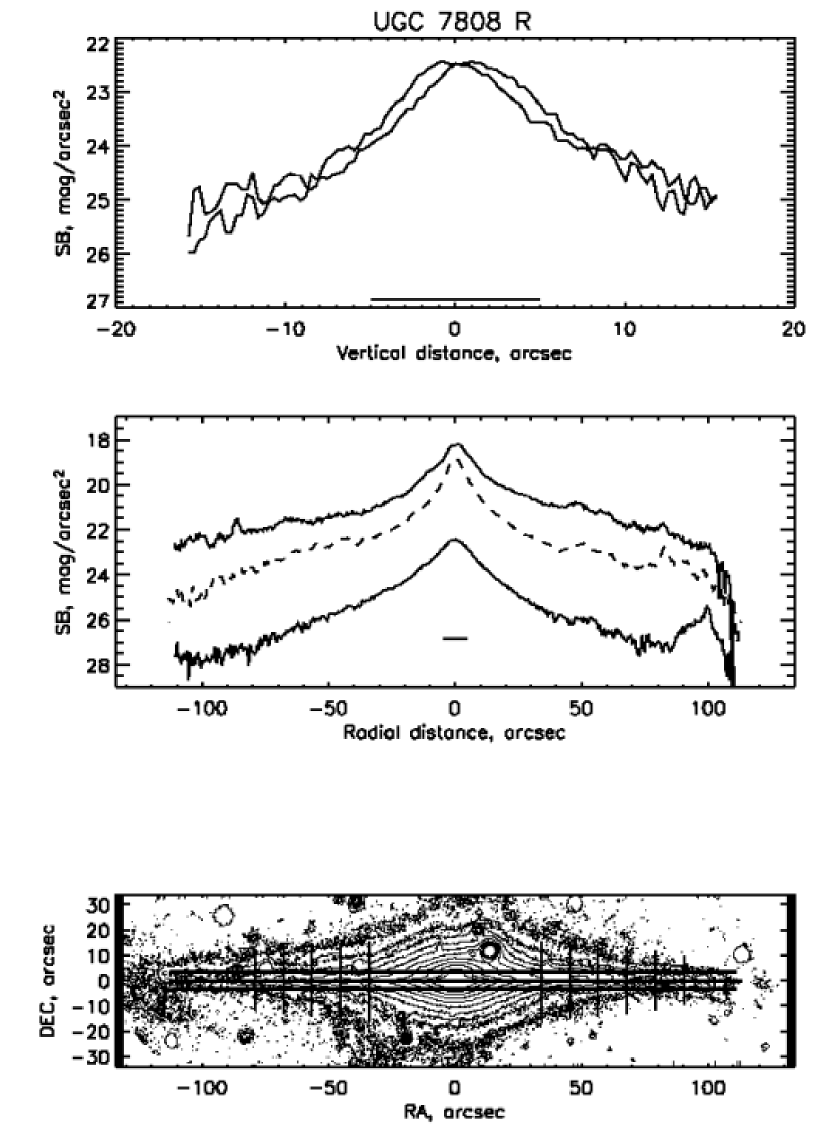
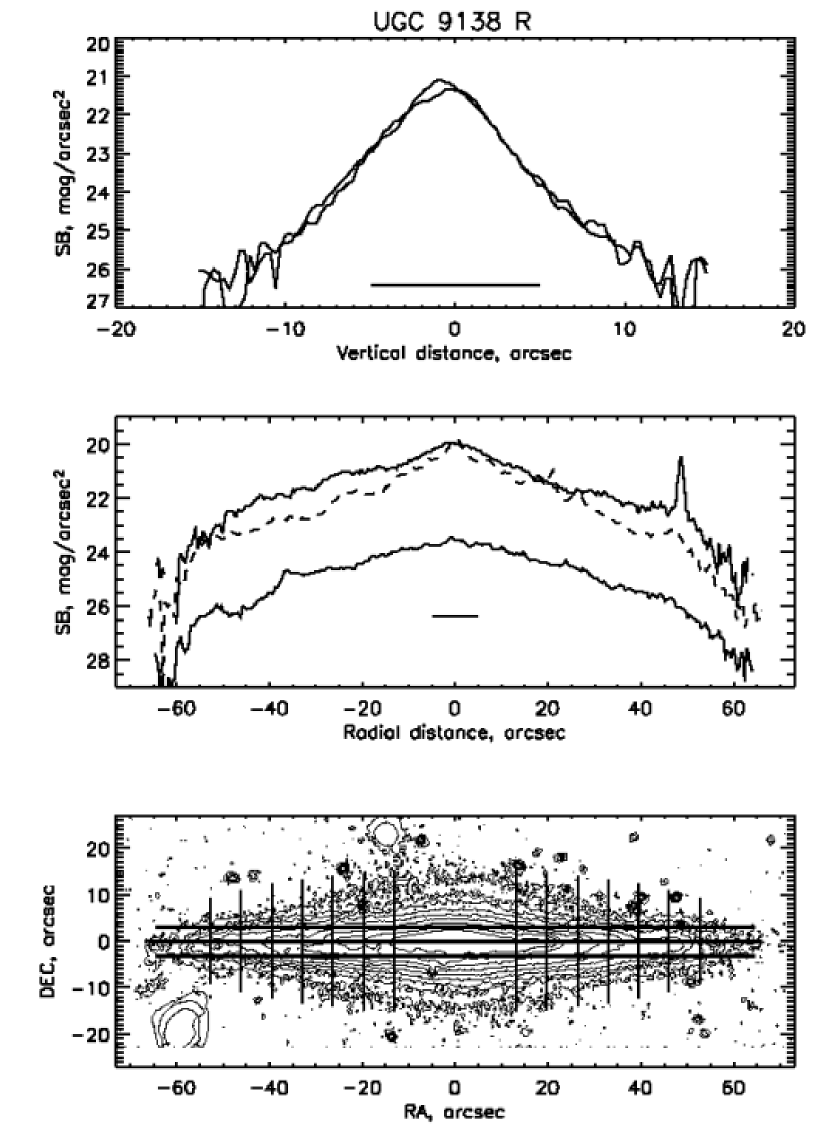
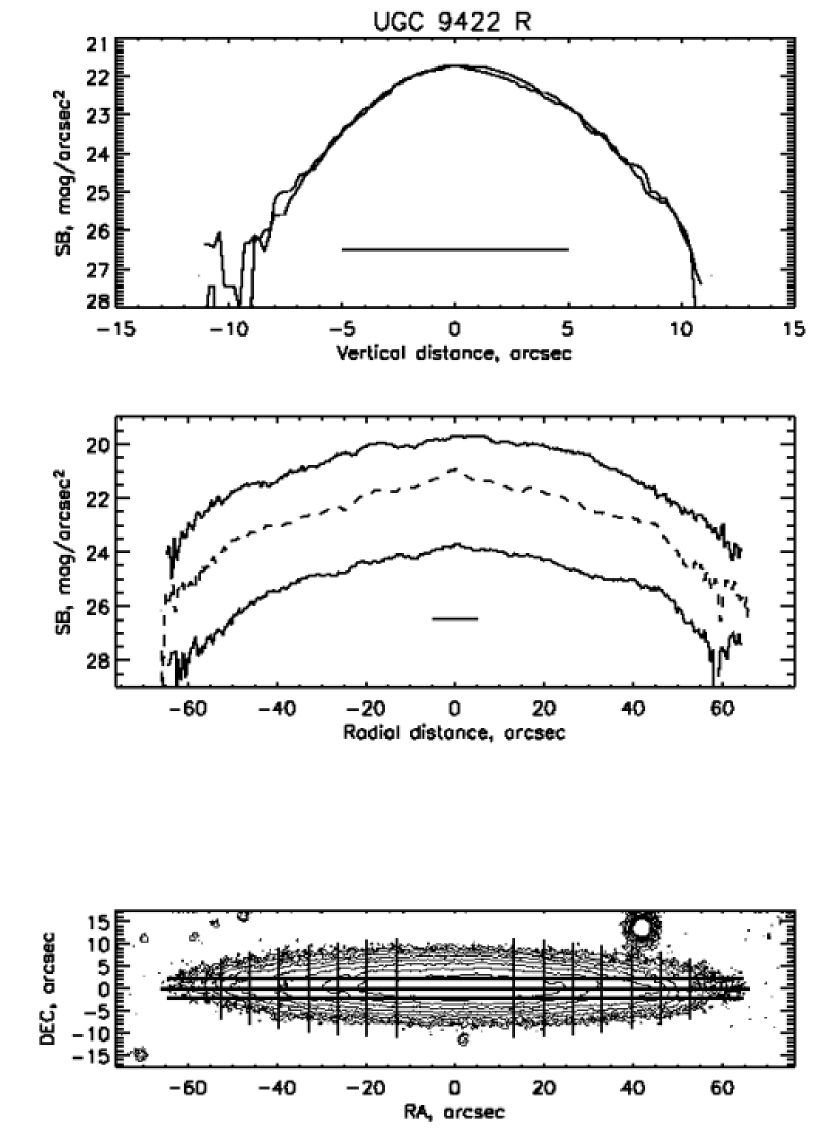
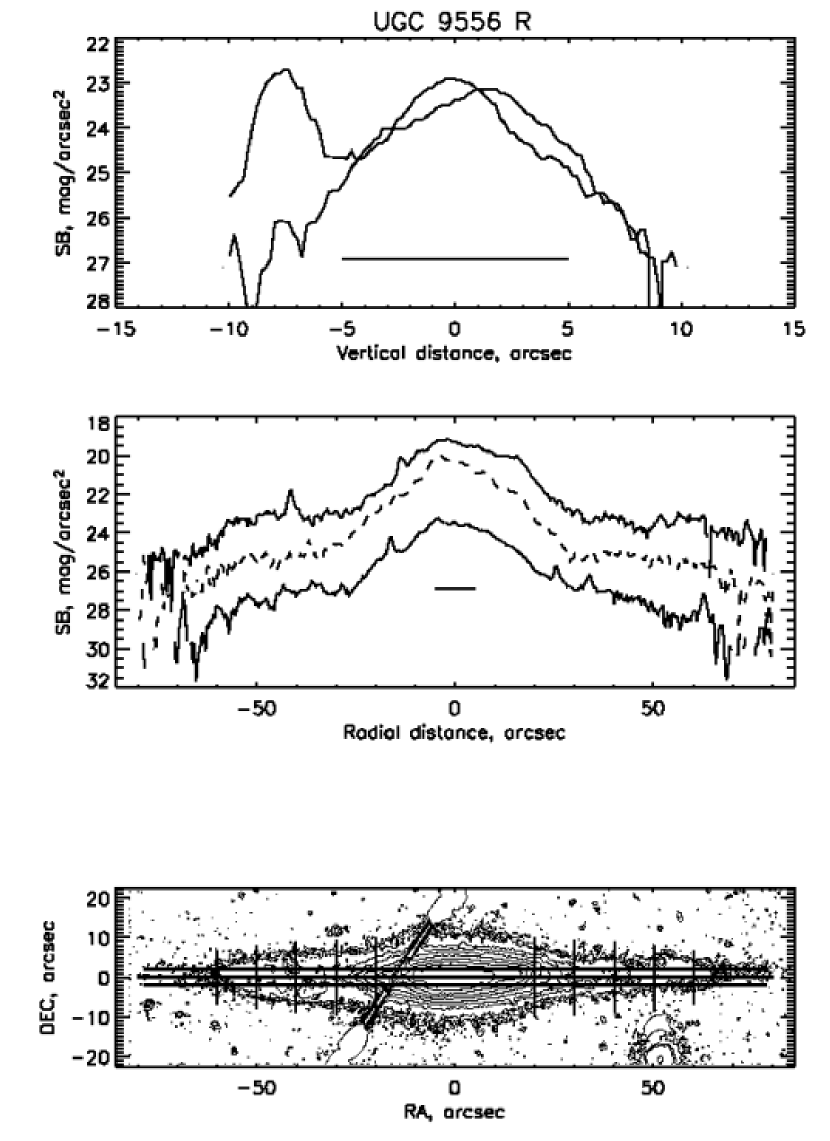
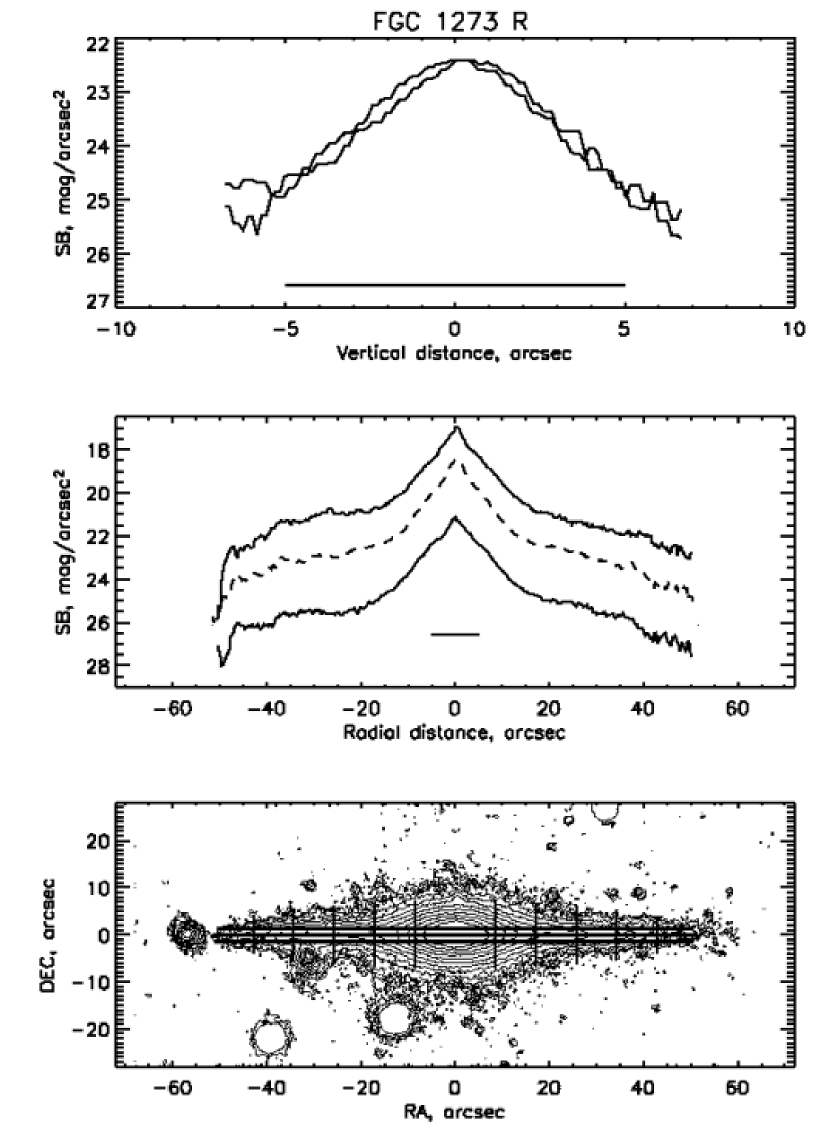
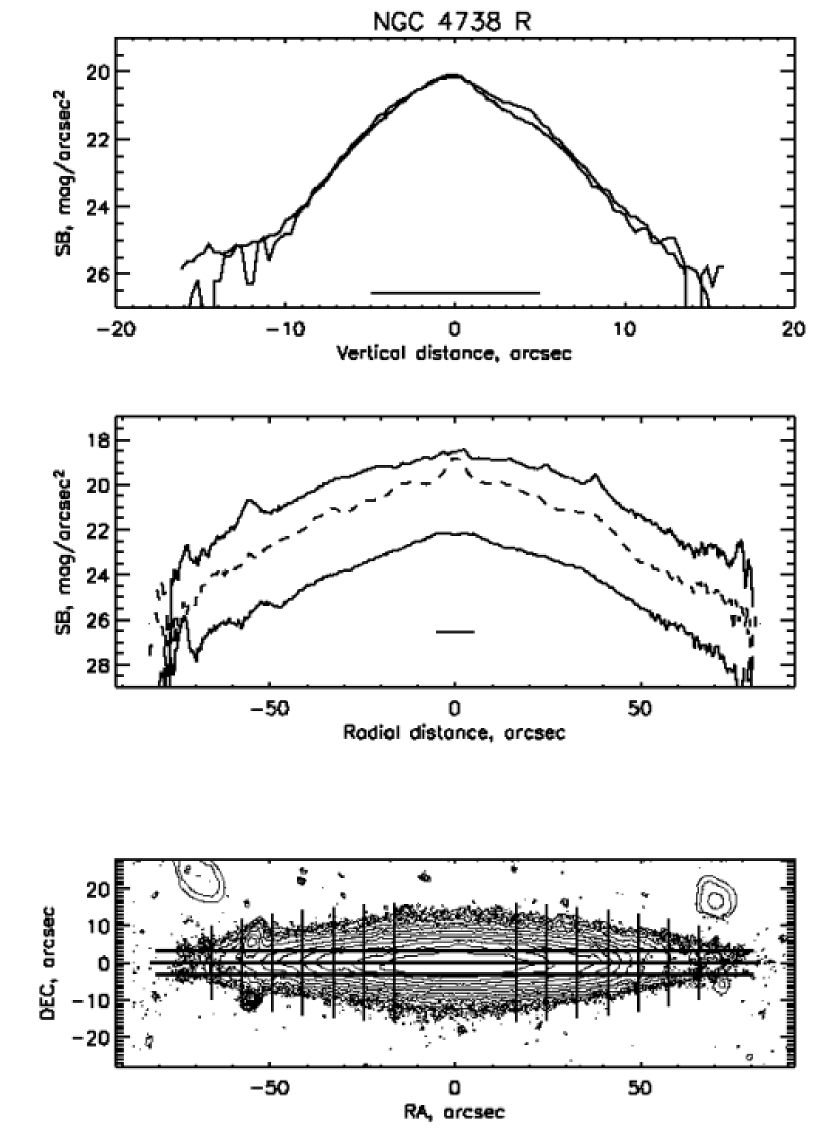
We applied a standard method (van der Kruit & Searle, 1981) to derive the structural parameters extracting photometric profiles parallel to the major and minor galactic axes. The radial scale length was obtained from two photometric profiles extracted parallel to the major axis and displaced with respect to the galactic midplane. This allows us to minimize the effects of dust absorption, because we avoid the galactic midplane. An average displacement is of the order 0.7 (see below). If the bulge was present, the central part of radial photometric profiles (typically, 1 from the center) is excluded from further analysis. We fit the function to the radial profiles and find mean values of and . Here, is the distance to the center, and is the distance to the edge of disk. One can assume that according to Pohlen et al. (2002); Holley-Bockelmann & Mihos (2001). The integration was made along the line of sight . Two radial profiles utilized for the fitting are shown in the middle panels of Fig. 1–14 by the solid lines. Note that each a profile was manually cleaned from foreground stars before the fitting. The radial profile drawn through the galactic plane is shown in the middle panels of Fig. 1–14 by the dashed line.
As a next step, we draw 10 to 14 cuts made parallel to the minor axis of a galaxy and fit each photometric profile with the function . Here designates the distance to the galactic plane. The ”displacement term” enables us to correct the values of the disk scale height for a possible disorientation of major axis or disk warp. The resulting value of the scale height and its error were found by averaging the values throughout the disk. Our galaxies show no significant variations of the scale height with radius. Hence, we defined the mean scale height with no weights.
Fitting the profiles, we convolved the functions with the gaussian smearing function assuming its FWHM from Table 1. The corresponding vertical profiles are shown in the upper frames of Fig.1–11. They were manually cleaned of the foreground stars and artifacts before the fitting.
The value of the disk central surface brightness corrected to the face-on inclination was calculated with the parameters and inferred above taking into account the photometric calibration equations. The extinction of our Galaxy (according to the LEDA database) is also included into the analysis and listed in Table 2.
In order to check how examining only a limited number of brightness profiles (two radial and 10-14 vertical) affects the inferred values, we derive the same values for each a galaxy by extracting the radial profiles (drawn along the major axis) with the increment of one pixel from 0.2 to 0.8 in the vertical direction, where is the minor axis of an ellipse encompassing the galaxy by the level of S/N=3. The vertical profiles in this analysis were drawn with one-pixel increment taking a step off the disk edge and its center. The resulting structural parameters are similar to those obtained above using only a few photometric profiles. All conclusions of the paper remain unchanged in this case.
As was shown by de Grijs et al. (1997), we can neglect inclination corrections for inclinations larger than 86-87 degrees. Our V images are deep enough to see obscuration by dust in most of our galaxies. Although dust is not seen in the galaxy FGC 1273, its bulge has a high degree of symmetry. Because its edge-on disk is very thin, we assume that its inclination angle is 90°. For all other galaxies we can estimate the inclination angle of the galactic plane from the shape and positions of their dust layers and asymmetric position of center of brightness respective to external isophotes. The value of the inclination is shown in Table 3, its typical error is 0.7°. Based on those values, we applied no additional correction for non edge-on inclination to the photometric parameters derived above.
Assuming the inferred disk parameters, we subtracted the disk and extracted the bulge images from the central parts of our galaxies. Then, the central parts of two radial profiles mentioned above, as well as the vertical profiles extracted along the minor axis, were utilized to estimate the bulge parameters. The King’s profile , as well as the exponential one , were used to fit the bulge volume luminosity density distribution. Here, denotes the central volume luminosity density. The bulge scales and could be different in the vertical and radial directions (i.e. for oblate bulges). The inner part of the vertical profiles were excluded from the analysis.
Bulges of most galaxies in our sample are best fitted by the King’s profile. The only exception is UGC 9556, the bulge of which is best fitted by the exponential profile. Because the central part of the latter galaxy is oblate, we suggest that that it probably has two disks: an HSB disk is encompassed by more extended LSB one. We consider its LSB disk throughout the paper. According to RFGC, UGC 9556 may have a lens in its central part. On the other hand, its type was defined as a galaxy with a bar (SB?c) in the UGC catalog (Nilson, 1973). More over, UGC 9556 has an asymmetry of bright isophotes close to the galactic plane, which points toward a possible bar shielded by dust whose nerby side is seen. Indeed, photometric identification of bars in edge-on galaxies can rarely be conclusive.
With the help of the obtained parameters we infer the bulge-to-disk luminosity ratio . The main results of the fitting are shown in Table 3. The values of and are converted to the spatial units according to the adopted distances to the galaxies . Table 3 also shows R-magnitudes and colors (V-R) derived for our objects. The magnitudes were obtained by integrating background-subtracted images of the galaxies within elliptical diaphragms. Major and minor axes of the diaphragms correspond to the sizes from the RFGC cataloge, which are quite similar to the galaxies’ dimensions at S/N=3 level.
The distribution of (see Table 3) indicates the presence of two subsamples: that with greater than 23.5 , which we define as LSB galaxies, and that with a higher surface brightness, which is designated as HSB galaxies in this paper. Hence, our sample consists of four LSB and seven HSB galaxies. Note that all galaxies in the faintest RFGC surface brightness class were classified here as LSB objects.
Although our sample of objects enables to compare the structural parameters of LSB and HSB disks, the sample is very limited. We incorporated one more sample of edge-on galaxies whose photometric parameters have been published by Barteldrees & Dettmar (1994). They made use of similar red photometric band and technique to extract the photometric parameters. We will utilize their data together with ours throughout the paper in order to increase the available sample of HSB galaxies. As it will be seen, the sample of Barteldrees & Dettmar includes also one object, which can be classified as a LSB galaxy.
4 LSB versus HSB: the vertical scale height of galactic disk as a new feature to compare
As was shown in Bizyaev (2000); Bizyaev & Mitronova (2002); Reshetnikov et al. (2003), the galaxies of lower surface brightness tend to have smaller ratios. However, this conclusion was based on studies of mostly HSB galaxies. Now, we can incorporate our LSB subsample and consider the relation between and the central surface brightness . The objects from our sample are denoted by squares in Fig. 12. The open squares show the HSB subsample, whereas the filled ones designate LSB galaxies. The galaxies taken from Barteldrees & Dettmar (1994) are shown in Fig. 12 with the crosses.
Furthermore, the near-infrared -band sample of edge-on galaxies from Bizyaev & Mitronova (2002) is available for comparison (the 2MASS sample hereafter). Here we have to take into account the systematic difference in the brightness and between the R and K photometric bands. As was noticed by Zasov et al. (2002), the ratio of scales is 1.4 times less for the stellar disk in K against R. It can be explained by stronger dust extinction in the R band, and was well illustrated by Xilouris et al. (1998). We corrected for the 2MASS galaxies taken from Bizyaev & Mitronova (2002) according to this value. The typical color (R-K)= inferred for late-type face-on spirals by de Jong (1996) was added to the central surface brightnesses of the 2MASS galaxies as well. The final correction that we applied was addition of the internal extinction to the 2MASS central surface brightness, because it is low in the infrared band and non-negligible in the R band. The value of this correction, , is chosen so that the 2MASS sample coincides with our HSB objects in Fig.12.
Fig.12 shows all three samples together, where the 2MASS objects are denoted by the small filled triangles. A trend in Fig.12 is seen, an average difference of in leads to 1.5 change in the ratio of scales. At the same time, there is no clear correlation found when and were plotted against separately. The correlation of versus was shown by Graham (2001), but that conclusion was based on mostly early-type spiral galaxies.
We also incorporate general galactic properties taken from the LEDA database into the analysis: absolute B magnitude , maximum of the rotation curve , and HI index. The latter index denotes the difference between the B magnitude and the ”HI magnitude”. We found that LSB and HSB subsamples do not differ systematically in , , and HI index. There is no correlation found between the values of and on the one hand, and , , or HI index on the other hand.
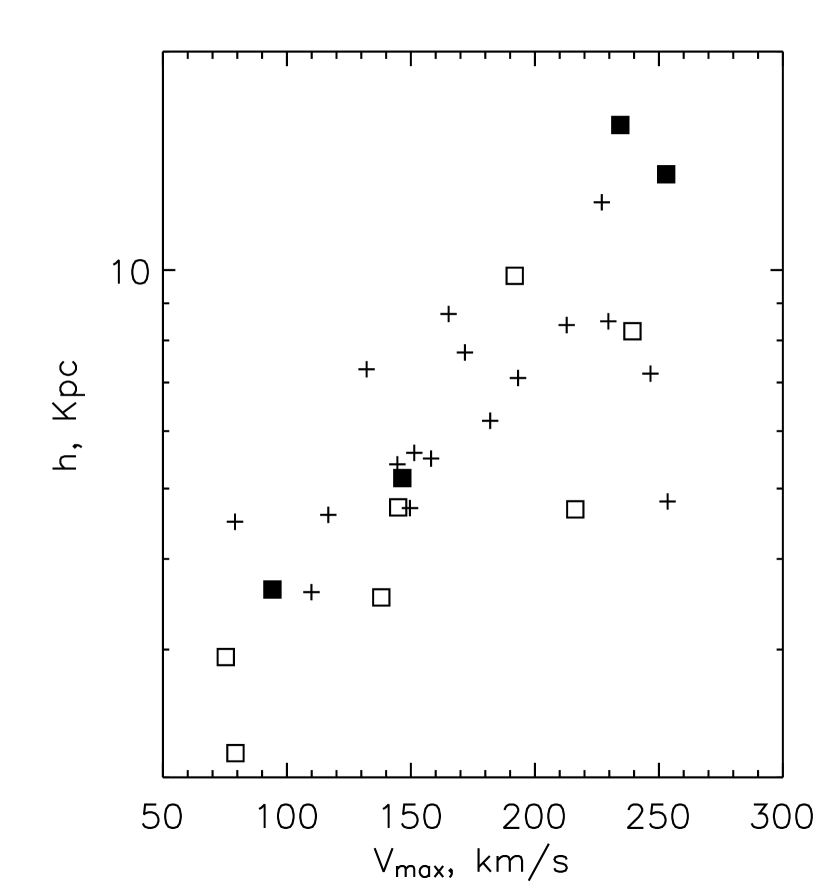
In Fig.13 one can see a relation of Tully-Fisher type, where the values of the radial scale length are well correlated with the maximum of rotational velocity . According to Zwaan et al. (1995); Sprayberry et al. (1995); Chung et al. (2002), LSB and HSB spiral galaxies follow the same Tully-Fisher relation, and our Fig.13 is in a good agreement with this. It argues that we did not made a mistake deriving the spatial values. Thus, the galaxy UGC 7808 was investigated by de Grijs & van der Kruit (1996) where the shorter scale height value (in kpc) was inferred because of the lower adopted distance to the galaxy. Fig.13 shows that our value of the scale length for the galaxy, 13.55 kpc, places the galaxy very close to the general dependence in Fig.13, whereas the scale length of 1.9 - 2.7 kpc taken from de Grijs & van der Kruit (1996) would place this object far off. At the same time, the angular values of the scale length found in the present work and in the latter cited one, are very similar.
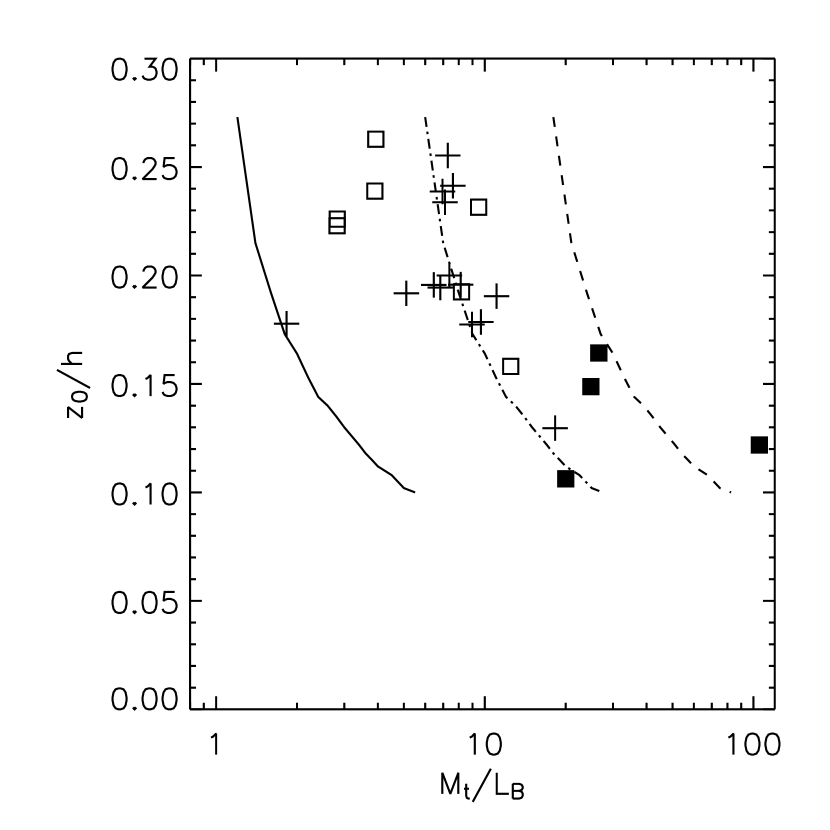
Following Zasov et al. (2002), we calculated the ratio of the total mass inside the optical radius to the luminosity of the galactic disk in the B band, . We suppose that , where is the gravitational constant and radius encompasses the whole galaxy. The value of is obtained from the absolute B-magnitude, which was taken from the LEDA and corrected for the internal galactic absorption. The values of are plotted against the ratio in Fig.14.
The notation in Fig.14 is the same as in Fig.12. As was noticed by Zasov et al. (1991), the ratio of scales indicates the total mass of the spherical component of a galaxy expressed in its disk mass . The relation between and obtained from numerical modeling (N body simulations) was published by Mikhailova et al. (2001) and shown in Fig.15. We made use of that dependence to evaluate the model values of for our galaxies.
Here, we have to clarify that we distinguish between a spherical and disk subsystem throughout the paper. By the ”spherical subsystem” we refer to both a stellar bulge and dark halo, even if their shapes are not spherical but rather oblate (see discussion in section 5.5). In a general case, the spherical subsystem means a non-disk component, either stellar or not. The disk in our understanding is the galactic stellar disk. It consists mostly of stars for our objects. Later in the paper we also evaluate the ratio of dark-to-luminous masses. The dark mass belongs to the dark halo, whereas the luminous matter means the stellar bulge and disk.
Then, we take into account that and , where (M/L) denotes the B-band stellar mass-to-light ratio in the disk. Hence . It is seen that the model value of depends on the adopted B-band stellar mass-to-light ratio. The three curves in Fig.14 present the model values of which were calculated based on Fig.15 with the mass to light ratio (M/L) of 1, 5, and 15. As is seen in Fig.14, most of the galaxies have values of (M/L) between 3 and 10. The B-band stellar mass-to-light ratio (M/L) in Fig.14 corresponds to the distance taken along the horizontal axis toward the curve of (M/L)=1. The value of the stellar mass-to-light ratio is systematically higher for our LSB galaxies as compared to that of HSB galaxies.
This conclusion contradicts the bluer color of LSB galaxies found by (de Blok et al., 1995) who give lower values for their (M/L), but the bulge-dominated LSB galaxies have colors comparable with HSB ones (Beijersbergen et al., 1999). The dereddened colors from our both LSB and HSB subsamples are almost the same (Table 3). On the other hand, LSB spirals have low metallicity as a rule. It might give the comparable colors, whereas stellar disk’s (M/L) takes larger values in LSB spirals. Another reasonable explanation might be an excess of the dark matter in the disks of bulge dominated LSB spirals.
Large LSB galaxies have, on average, two times more mass in their gaseous component (Romanishin et al., 1982) in comparison with HSB. Our LSB subsample has almost twice larger value of ”HI index” against the HSB one. But this difference is not enough to explain the systematic difference in (M/L) in Fig.14 since the gas component does not dominate by mass in our galaxies.
The mass of the dark halo can be estimated from the relation shown in Fig.4. The dark-to-luminous ratio is , where and denote masses of bulge and dark halo, respectively. On the other hand, and hence, . Combining previous equations, one can obtain:
| (1) |
The values of can be estimated from observations making a rough assumption that the bulge-to-disk luminosity ratio follows the bulge-to-disk mass ratio (we consider how our conclusions might change for real galaxies where (M/L) is different for bulges and disks in section 5). At the same time, can be estimated from Fig.15. The ratio of dark-to-luminous mass for our galaxies is shown in Fig.16. Surprisingly, there is no systematic difference between the values of dark-to-luminous mass ratio for the galaxies with different central surface brightnesses, see Fig.14. It is generally assumed that the LSB galaxies are dark-matter dominated, but all those conclusions were based on studies of bulgeless galaxies. Our sample, on the contrary, comprises mostly of the galaxies possessing non-negligible bulges.
We can also compare masses of the spherical subsystem (i.e. the sum of the bulge and halo) in our galaxies. In Fig.17 we present how the spherical to disk mass ratio depends on the disk central surface brightness. We kept the same notation as in Fig.12 and Fig.14. Fig.17 indicates that the LSB galaxies do not have more massive dark matter halos. Instead, they have more massive spherical subsystems. This supports a result by Graham (2002) that not all LSB galaxies are dark matter dominated objects. Nevertheless, our result does not contradict previously made conclusions since the dark matter halo and the spherical subsystem become identical for bulgeless galaxies.
Differentiation between the bulge and halo allows us to demonstrate that there are dark-matter halo dominated large LSB galaxies as well LSB galaxies, the halos of which are less massive than their disks.
5 Discussion
5.1 The sample selection
There is no systematic difference in the obtained values of among our sample galaxies of I – III surface brightness class (it was noticed by Bizyaev (2000) as well). On the other hand, most galaxies of IV SB class are apparently bona fide LSB galaxies. They constitute a small part of all RFGC objects (3%). As was noticed by McGaugh et al. (1995), there is a significant fraction of LSB galaxies with a large bulge to disk ratio. Bulges of LSB and HSB systems are indistinguishable (Beijersbergen et al., 1999), yet their disks are different. Hence, one have to distinguish between LSB galaxies with and without bulges and take these possible bulges into account while undertaking a study of properties of dark halos in LSB galaxies,
Our paper does not attempt to present a statistically completed study of LSB spiral galaxies with large bulges. Instead, we compare two samples of objects of opposite properties. To make statistically reliable conclusions the sample has to be extended.
5.2 Selection effects
Fig.12 presents a correlation between and . Indeed, the values of and have not been obtained independently from each other, as it follows from the formulae in section 3. Let us consider how the non-90° inclination of the disk plane affects and . If the inclination angle is less than 90°, the scale height calculated in section 3 becomes overestimated. At the same time, the scale length is much less affected by the value of inclination angle. On the other hand, the value of was taken into account when the central surface brightness was calculated. While overestimating the ratio , we underestimate the disk central surface brightness (hence, its numerical value will be larger). It means that a non-90°inclination of disks shifts data points in Fig.12 toward the right upper corner. Hence, the systematic errors due to inclination may only scatter the dependence shown in Fig.12 (say, for the 2MASS galaxies) and do not explain a good correlation.
The second effect that has to be considered is the internal dust absorption in galaxies. According to Xilouris et al. (1999), the scale length in dusty disks appears higher because of the scattering and absorption effects. On the other hand, the dust absorption decreases the derived central surface brightness. In our case it would shift data points in Fig.12 from the upper left to the lower right corner and would form a dependence similar to that seen in Fig.12. Nevertheless, we decreased the influence of dust by avoiding the dust layer when extracting the radial profiles. This allowed us to minimize the dust absorption. Furthermore, one can see that the infrared and optical subsamples follow the similar dependence in Fig.12. This argues that the internal absorption has little effect on the difference between LSB and HSB photometric parameters and Fig.12 has a physical meaning.
5.3 Internal absorption in galactic disks and the ratios and
As was noted in section 4, the disk thickness is different when it is estimated in different photometric bands. All the considered relations between the mass of a dark halo, stellar disk, and spherical component are made using the data taken in the R band. On the other hand, the infrared ratios of photometric scales are less than the optical ones. The infrared values are more preferable because of the lower dust absorption, so we could decrease all our ratios by a factor of 1.4. As is seen in Figs.14 and 15, a proportional decrease of the scale ratio affects Figs.16 and 17 only quantitatively. Hence, all previous conclusions remain unchanged.
The values of inferred for our HSB galaxies are less than the Freeman’s value (taking into account a difference between the R and B bands). It implies that the internal extinction may be important in the disks of our galaxies. Since all the galaxies are spiral and are relatively nearby, one can assume roughly the same dust-to-stars ratio in them. Then, the internal extinction proportionally increases the values of . At the same time, it does not change the main trends in Fig.12, 14, 16, and 17.
In a more complicated case, the internal dust extinction may be systematically different in the galaxies of our sample. Thus, according to (McGaugh, 1994; Matthews & Wood, 2001) LSB spirals are likely to be less dusty than HSB ones. One can see that it strengthens the relation shown in Fig.12: extinction correction of for HSB spirals moves data points further to the left than it does for LSB spirals. As a result, we can always distinguish between these two subsamples. It corresponds to the conclusion made by Beijersbergen et al. (1999) that the dust extinction alone can not explain the difference in surface brightness between LSB and HSB spirals.
Another way to take the extinction into account is to connect it with the global galactic parameters such as the absolute magnitude or rotational velocity, see (Tully et al, 1998) and references therein. Correction of for the extinction with the help of absolute R-magnitudes or moves data points to the left in Fig.12 and does not change its general trend.
The bulge-to-disk luminosity ratio has been utilized to draw Fig.12 and 16. Since part of our galaxies has bulges, attention should be paid to how the extinction may change the derived values of . In addition to the profile fitting, we conducted a direct integration of bulges. At first, the model disk (constructed according to the parameters defined during the disk fitting) was subtracted from the images of galaxies. Then, we integrated all the central part which was above the zero level. The ratio of the integrated luminosity of the bulge to the model disk luminosity gives us a lower bound of ratio (because the model disk is ”dust-free”, and the bulge is dimmed by the extinction). The value of is 2-6 times lower than the value of given in Table 3. If we use instead of , Fig. 12 does not change qualitatively. On the other hand, in Fig.16 all our LSB galaxies move to the right, since a larger fraction of mass of their spherical component is assigned to the dark halo. Then, if we apply as a bulge-to-disk luminosity ratio, one cannot conclude that the ratio ”(dark halo + bulge)/disk” in the bulge-dominated galaxies is systematically higher whereas dark-to-luminous ratio not. In this case dark-to-luminous mass ratio would be higher in our LSB systems too.
Alternatively, one can obtain the ratio from direct integration of the bulge and disk from our images. In contrast to the previous case that gives the lower limit on , this integration yields values of that are systematically higher than it can be seen in Table 3. This method of evaluation of bulge-to-disk luminosity ratio does not change our conclusions as well.
5.4 M/L may be different for bulge and disk
Assuming that , one can notice that indeed, bulges and disks have different colors and, hence, their stellar population has to show different mass-to-light ratios. It does not affect all our results except for Eq. (1) and Fig. 16. Bulges are redder than disks as a rule (Peletier & Balcells, 1996) and have larger M/L. Then, is overestimated for galaxies with significant bulges (LSB galaxies in our sample). Hence, it supports our conclusion that dark halo does not dominate in LSB galaxies which have big bulges. It should be noticed that the difference between colors of bulges and disks is very small (Peletier & Balcells, 1996; Gadotti & dos Anjos, 2001), which makes the effect mentioned above insignificant.
5.5 Oblate bulges, non-spherical halos
Dark matter halos and bulges of galaxies may not be exactly spherical, but rather oblate. Our definition of works well for the case of spherical symmetry. In a general case , where is a dimensionless parameter, the value of which is determined by the mass distribution, and for the case of galaxies. If the whole mass of a galaxy was enclosed in a thin exponential disk, the parameter taken at distance from the center is approximately equal to 0.5 (Freeman, 1970). All other reasonable geometric cases represent a mixture of disk and spherical components and give between 0.5 and 1. For the case of non-spherical dark halo, the difference between LSB and HSB galaxies in Fig.14 (and, hence, in M/L for the stellar disk) would be even more prominent, because calculated using is systematically lower for disk-dominated HSB spirals than for bulge-dominated LSB galaxies in our sample. Note that once a non-disk component is presented in all our galaxies, the difference in be significantly less than a factor of 2. At the same time, it does not change other conclusions of this paper.
A possible existence of a non-spherical, oblate component was not taken into account by Mikhailova et al. (2001). If one takes it into account, the general trend shown in Fig. 14 remains unchanged. However, a systematic difference between the ellipticity of dark halos in LSB and HSB galaxies can significantly affect Fig. 14. For instance, an assumption of oblate halo in LSB spirals and spherical halo in HSB ones decreases the difference between the B-band mass-to-luminosity ratio in stellar disks mentioned above, since it shifts data points to the left (though, by less than a factor of 2). On the other hand, we show that the dark halos are likely to be not too massive and, hence, not dominant by mass in our bulge-dominated LSB spirals. Therefore, the role of their non-spherical shapes is insignificant. It is doubtful that the systematic difference between the ellipticity of dark halos in LSB and HSB galaxies can affect our conclusions. Furthermore, if a significant fraction of dark matter in the bulge-dominated LSB galaxies is located in their disks, it helps to rise their (M/L) as it can be seen from Fig.14. Note that one of candidates to the dark matter, namely cold molecular clouds, could form a disk-like subsystem (Pfenniger et al., 1994).
6 Conclusion
1) We present results of photometric observations of a sample of edge-on galaxies. Our sample includes four LSB and seven HSB galaxies. The photometric disk scales (both vertical and radial), disk central surface brightness, and bulge-to-disk luminosity ratios were derived.
2) Stellar disks of LSB galaxies are thinner (when parameterized by the ratio ) than HSB ones. There is a clear correlation between their central surface brightnesses and the vertical to radial scale ratios.
3) While having different central surface brightnesses and bulge-to-disk ratios, the LSB and HSB galaxies in our sample follow the same dependence ”disk scale length versus the maximum rotational velocity”.
4) Our LSB galaxies tend to harbor massive spherical subsystems (bulge + halo) as well as to have higher values of the mass-to-luminosity ratio in their disks when compared to the HSB objects. Nevertheless, the dark halo is not strictly the most massive subsystem in our bulge-dominated LSB galaxies. The LSB spirals appear to be the ”spherical subsystem dominated” galaxies but not always the ”dark matter dominated”.
References
- Peletier & Balcells (1996) Peletier, R., Balcells, M., 1996, AJ, 111, 2238
- Barteldrees & Dettmar (1994) Barteldrees, A., Dettmar, R.-J. 1994, A&AS, 103 ,475
- Beijersbergen et al. (1999) Beijersbergen, M., de Blok, W., and van der Hulst, J. 1999, å, 351, 903
- Bizyaev (2000) Bizyaev, D. 2000, Sov. Astron. Lett., 26, 219
- Bizyaev & Mitronova (2002) Bizyaev, D., Mitronova, S. 2002, A&A, 389, 795
- de Blok et al. (1995) de Blok, W., van der Hulst, J., Bothun, G. 1995, MNRAS, 274, 235
- de Blok et al. (1996) de Blok, E., van der Hulst, T., & McGaugh, S. 1996, AAS, 189, 8402
- de Blok et al. (2003) de Blok, W., Bosma, A., & McGaugh, S. 2003, MNRAS, 340, 657
- Chung et al. (2002) Chung, A., van Gorkom, J., O’Neil, K., Bothun, G. 2002 AJ, 123, 2387
- de Grijs & van der Kruit (1996) de Grijs, R., van der Kruit, P. 1996 A&AS, 117, 19
- de Grijs et al. (1997) de Grijs, R., Peletier, R., van der Kruit, P. 1997, A&A, 327, 966
- de Jong (1996) de Jong, R. 1996 A&A, 313, 377
- Gadotti & dos Anjos (2001) Gadotti, D., dos Anjos, S. 2001 AJ, 122, 1298
- Freeman (1970) Freeman, K. 1970, ApJ, 160, 811
- Graham (2001) Graham, A. 2001, MNRAS, 326, 543
- Graham (2002) Graham, A. 2002, MNRAS, 334, 721
- Holley-Bockelmann & Mihos (2001) Holley-Bockelmann, J., Mihos, J. 2001, AAS, 198, 08.15
- Karachentsev et al. (1992) Karachentsev, I., Georgiev, Ts., Kajsin, S., Kopylov, A., Ryadchenko, V., Shergin, V. 1992, Astron & Astrophys. Transact., 2, 265
- Karachentsev et al. (1999) Karachentsev, I., Karachentseva, V., Kudrya, Y., et al. 1999, Bull. of Special Astrophys. Obs., 47, 5
- Kregel et al. (2002) Kregel, M., van der Kruit, P., de Grijs, R. 2002, MNRAS, 334, 646
- Landolt (1992) Landolt, A. 1992 AJ, 104, 340
- Matthews (2000) Matthews, L. 2000, AJ, 120, 1764
- Matthews & Wood (2001) Matthews, L., Wood, K. 2001, ApJ,
- McGaugh (1994) McGaugh, S. 1994, ApJ, 426, 135
- McGaugh et al. (1995) McGaugh, S., Schombert, J., and Bothun, G. 1995, AJ, 109, 2019
- McGaugh et al. (2001) McGaugh, S., Rubin, V., & de Blok, W. 2001, AJ, 122, 2381
- Mikhailova et al. (2001) Mikhailova, E., Khoperskov, A., Sharpak, S. 2001, Conf. proc. ”Stellar Dynamics: From Classic to Modern”, ed. Ossipkov & Nikiforov, p. 147.
- Nilson (1973) Uppsala General Catalogue of Galaxies, 1973, Acta Universitatis Upsalienis, Nova Regiae Societatis Upsaliensis.
- Pfenniger et al. (1994) Pfenniger, D., Combes, F., Martinet, L. 1994, A&A, 285, 79
- Pohlen et al. (2002) Pohlen, M., Dettmar, R.-J., Lutticke, R., and Aronica, G. 2002, A&A, 392, 807
- Reshetnikov et al. (2003) Reshetnikov, V., Dettmar, R.-J., & Combes, F. 2003 A&A, 399, 879
- Romanishin et al. (1982) Romanishin, W., Krumm, N., Salpeter, E., et al. 1982 ApJ, 263, 94
- Sprayberry et al. (1995) Sprayberry, D., Bernstein, G., Impey, & C., Bothun, G. 1995, ApJ, 438, 72
- Tully et al (1998) Tully, R., Pierce, M., Huang, J.-S., et al. 1998, ApJ, 115, 2264
- van der Kruit & Searle (1981) van der Kruit, P., Searle, L., 1981, A&A, 95, 105
- van der Kruit et al. (2001) van der Kruit, P., Jimenez-Vicente, J., Kregel, M., & Freeman, K. 2001, A&A, 379, 374
- Xilouris et al. (1998) Xilouris, E., Alton, P., Davies, J., et al. 1998, A&A, 331, 894
- Xilouris et al. (1999) Xilouris, E., Byun, Y., Kylafis, N., Paleologou, E., Papamastorakis,J. 1999, A&A, 344, 868
- Zasov et al. (1991) Zasov A., Makarov D., Mikhailova E. 1991, Sov. Astron. Lett., 17, 374
- Zasov et al. (2002) Zasov, A., Bizyaev, D., Makarov, D., Tyurina, N. 2002, Sov. Astron. Lett., 28, 527
- Zwaan et al. (1995) Zwaan, M., van der Hulst, J. , de Blok, W., & McGaugh, S. 1995, MNRAS, 273, L35
| Name | SB class | Band | Date | Int. time | Nexp | Seeing | Sky | S/N=3 level |
|---|---|---|---|---|---|---|---|---|
| 1999 | sec. | arcsec | mag/arcsec2 | |||||
| UGC 10111 | IV | V | 27 Apr | 600 | 1 | 1.9 | 21.37 | 26.58 |
| R | 27 Apr | 1200 | 4 | 2.0 | 20.72 | 26.77 | ||
| UGC 11301 | III | V | 27 Apr | 700 | 3 | 1.6 | 20.76 | 25.17 |
| R | 27 Apr | 1000 | 4 | 1.6 | 20.38 | 25.81 | ||
| UGC 5662 | III | V | 30 Apr | 600 | 1 | 3.0 | 21.39 | 26.64 |
| R | 30 Apr | 1200 | 2 | 2.4 | 20.59 | 26.63 | ||
| UGC 6080 | II | V | 30 Apr | 600 | 1 | 1.9 | 21.49 | 26.46 |
| R | 30 Apr | 1200 | 2 | 1.7 | 20.68 | 26.60 | ||
| UGC 6686 | III | V | 27 Apr | 1200 | 2 | 1.8 | 21.35 | 26.85 |
| R | 27 Apr | 900 | 3 | 1.7 | 20.48 | 26.45 | ||
| UGC 7808 | IV | V | 27 Apr | 600 | 1 | 2.2 | 21.35 | 26.40 |
| R | 27 Apr | 1200 | 2 | 2.0 | 20.56 | 26.66 | ||
| UGC 9138 | I | V | 28 Apr | 900 | 2 | 1.1 | 21.37 | 26.48 |
| R | 28 Apr | 900 | 2 | 1.0 | 20.63 | 26.90 | ||
| UGC 9422 | I | R | 30 Apr | 1200 | 2 | 1.7 | 20.57 | 26.91 |
| UGC 9556 | IV | V | 28 Apr | 1800 | 4 | 1.0 | 21.46 | 26.51 |
| R | 28 Apr | 2900 | 6 | 1.0 | 20.68 | 27.26 | ||
| FGC 1273 | IV | V | 27 Apr | 600 | 2 | 1.8 | 21.43 | 26.54 |
| R | 27 Apr | 900 | 2 | 1.7 | 20.50 | 26.59 | ||
| NGC 4738 | I | R | 30 Apr | 1200 | 2 | 1.5 | 20.45 | 26.56 |
Name of galaxy, surface brightness class (according to the RFGC catalog), photometric band, date of observations, exposure time (total), number of expositions, average seeing, level of sky brightness, and S/N=3 SB level in combined frames.
| Name | D,Mpc | Type | |||||
|---|---|---|---|---|---|---|---|
| UGC 10111 | 139.6 | Sc | 1.221 | 16. | 0.178 | 2.370 | -21.3 |
| UGC 11301 | 62.3 | Sc | 1.295 | 15.5 | 1.273 | 2.379 | -21.2 |
| UGC 5662 | 17.1 | SBb | 1.495 | 15.4 | 0.115 | 1.899 | -17.6 |
| UGC 6080 | 30.3 | Scd | 1.3 | 15.8 | 0.036 | 1.877 | -18.6 |
| UGC 6686 | 86.4 | Sb | 1.418 | 15.0 | 0.135 | 2.283 | -21.2 |
| UGC 7808 | 96.3 | Sb | 1.492 | 14.6 | 0.098 | 2.403 | -21.8 |
| UGC 9138 | 61.9 | Sc | 1.284 | 14.8 | 0.108 | 2.161 | -20.9 |
| UGC 9422 | 45.6 | Sc | 1.279 | 14.7 | 0.1 | 2.140 | -20.5 |
| UGC 9556 | 32.5 | SBc | 1.099 | 16.0 | 0.043 | 1.974 | -18.1 |
| FGC 1273 | 49.4 | Sc | 0.801 | 16.5 | 0.103 | 2.166 | -18.0 |
| NGC 4738 | 63.6 | Sc | 1.297 | 14.3 | 0.076 | 2.335 | -21.4 |
Name of galaxy, adopted distance (corresponding to the Hubble constant H0 = 75 km s-1 Mpc-1), morphological type, the major axis size (in 0.1′), total B-band magnitude, foreground extinction in our Galaxy in B, logarithm of rotational velocity , and absolute B-magnitude (all those values are taken from the LEDA).
| Name | i | PA | V-R | ||||||
|---|---|---|---|---|---|---|---|---|---|
| deg | deg | kpc | kpc | mag/arcsec2 | mag | mag | |||
| UGC 10111 | 88.2 | 37.5 | 15.84 0.14 | 2.60 0.42 | 0.168 | 24.63 0.11 | 0.58 | 15.08 | 0.63 |
| UGC 11301 | 88.2 | 110. | 8.24 0.84 | 1.30 0.08 | 0.160 | 22.12 0.13 | 0.25 | 13.01 | 0.81 |
| UGC 5662 | 89.3 | 147.5 | 2.16 0.51 | 0.50 0.06 | 0.237 | 22.70 0.37 | 0.21 | 13.62 | 0.61 |
| UGC 6080 | 86(?) | 125. | 2.93 0.18 | 0.70 0.05 | 0.236 | 22.69 0.16 | 0.00 | 14.45 | 0.50 |
| UGC 6686 | 88.0 | 50. | 9.82 1.27 | 1.89 0.21 | 0.196 | 22.51 0.13 | 0.10 | 13.44 | 0.71 |
| UGC 7808 | 88.7 | 93.5 | 13.55 2.63 | 1.44 0.18 | 0.158 | 23.97 0.18 | 0.86 | 13.60 | 0.69 |
| UGC 9138 | 87.0 | 168.5 | 4.71 0.12 | 1.05 0.06 | 0.214 | 22.42 0.38 | 0.07 | 14.79 | 0.76 |
| UGC 9422 | 88.3 | 159. | 3.54 0.13 | 0.80 0.05 | 0.225 | 22.64 0.35 | 0.00 | 14.96 | — |
| UGC 9556 | 87.0 | 133. | 3.63 0.49 | 0.54 0.09 | 0.141 | 24.77 0.60 | 1.00 | 15.39 | 0.39 |
| FGC 1273 | 89.7 | 170. | 5.17 0.98 | 0.63 0.10 | 0.118 | 24.33 0.18 | 1.37 | 14.70 | 0.68 |
| NGC 4738 | 85.7 | 32.5 | 4.68 0.21 | 1.23 0.08 | 0.270 | 21.11 0.16 | 0.01 | 13.39 | — |
Parameters derived for our galaxies: inclination angle, position angle, disk scale length in kpc, disk scale height, ratio of scales , stellar disk central surface brightness, bulge to disk ratio, R-magnitude integrated within the elliptical diaphragm with axes size taken from the RFGC catalog, and color (V-R). The R-magnitude and the color are uncorrected for the foreground extinction.