Cluster formation versus star formation rates around six regions in the Large Magellanic Cloud
The stellar population and star clusters around six regions in the Large Magellanic Cloud (LMC) is studied to understand the correlation between star formation and cluster formation rates. We used the stellar data base of the OGLE II LMC survey and the star cluster catalogues. The observed distribution of stellar density on the colour-magnitude diagrams (CMDs) were compared with the synthetic ones generated from the stellar evolutionary models. By minimising the reduced values, the star formation history of the regions were obtained in terms of star formation rates (SFR). All the regions were found to show large SFRs between the ages 500 – 2 Gyr with lower values for younger and older ages. The correlated peak in the cluster and SFRs is found for ages 1 Gyr, and for ages less than 100 Myr. Five out of six regions show significant cluster formation in the 100 – 300 Myr, while the SFRs were found to be very low. This indicates anti-correlation between star and cluster formation rates for the 100 – 300 Myr age range. A possible reason may be, that the stars are predominantly formed in clusters, whether bound or unbound, as a result of star formation during the above age range. The enhanced cluster formation rate at 100 – 300 Myr age range could be correlated with the encounter of LMC with the the Small Magellanic Cloud, while the enhanced star and cluster formation at 1 Gyr does not correspond to any interaction. This could indicate that the star formation induced by interactions is biased towards group or cluster formation of stars.
Key Words.:
Large Magellanic Cloud - star clusters - star formation history1 Introduction
In the recent years, the Large Magellanic Cloud (LMC) has been very thoroughly studied using various surveys, for example, OGLE II (Udalski et al. u2000 (2000)), Magellanic Clouds Photometric Survey (Zaritsky et al. z97 (1997)). These surveys were used partly or fully to study the star clusters and the stellar population in LMC. However, the spatial correlation between the star and cluster formation at small scales are not studied. Girardi et al. (g95 (1995)) used the star cluster catalogue of Bica et al. (bea96 (1996)) to derive the star cluster properties in LMC. Pietrzynski & Udalski (pu00 (2000)) used the OGLE II data and studied the age distribution of LMC star clusters. There were also studies on star clusters and stellar population around them, (for example, Olsen et al. o98 (1998) and Olsen o99 (1999)), but these also do not compare the spatial correlation between cluster and star formation episodes. The recent study by Holtzman et al. (h99 (1999)) suggested that the star formation history of the field stars is different from that of the clusters. This difference is seen in the age range 4.0 – 12 Gyr, where there seems to be a paucity in cluster formation. It is concluded that in general, the star clusters in LMC are not good tracers of the stellar population (van den Bergh v99 (1999)). This conclusion has been made from the analysis of the cluster and stellar population in the whole of LMC. In this study, an attempt is made to study the correlation between the star formation and cluster formation episodes around a few regions in LMC. Also, the emphasis is on the younger age range, for ages 1 Gyr and at smaller scales.
The recent star forming regions, like the 30 Dor and super giant shells found in LMC indicate that the star formation which began at one point propagates to larger distances in the LMC. The theories put forward to explain these structures include stochastic self-propagating star formation, SSPSF (Feitzinger et al. f81 (1981)) and recently by de Boer et al. (b98 (1998)), suggesting bow-shock induced star formation. The correlation between the events of cluster formation and star formation is expected in the resulting stellar population. We explore this correlation in this study, by looking at star clusters surrounding a few regions in LMC.
2 Data
2.1 Regions
The regions studied here were chosen for a different project, that is, to study the stellar population around novae in LMC (see Subramaniam & Anupama sa02 (2002)). From the above study, six regions were selected for the present analysis. The stellar data within a radius of a few arcmin is used to study the star formation history (SFH) of the region under consideration, whereas the star clusters are identified within 30 arcmin radius to study the cluster formation events. The above value of 30 arcmin is chosen such that the area covered is similar to the size of supergiant shells in LMC. The regions selected here satisfy the following two conditions - a) there are good number of star clusters within 30 arcmin radius and b) ages are known for most of the identified clusters. The location of these regions are given in Table 1. These locations are also plotted in figure 1. The dots show the centers of the regions studied and the big circles around them show the extend of the region scanned for star clusters.
Field stars within a radius of a few arcmin around these regions were identified from the OGLE II survey (Udalski et al. u2000 (2000)). We used the photometric data in the V and B pass bands and V vs (BV) colour-magnitude diagrams (CMDs) of the identified field stars were used for further analyses.

| Region | RA | Dec | ||||
|---|---|---|---|---|---|---|
| h | m | s | ∘ | ′ | ′′ | |
| Region 1 | 05 | 35 | 29.33 | 21 | 29.39 | |
| Region 2 | 05 | 32 | 09.27 | 22 | 11.70 | |
| Region 3 | 05 | 26 | 50.33 | 01 | 23.08 | |
| Region 4 | 05 | 23 | 50.12 | 00 | 23.50 | |
| Region 5 | 05 | 23 | 21.82 | 29 | 48.48 | |
| Region 6 | 05 | 08 | 01.10 | 37 | 37.67 | |
2.2 Star clusters
The star clusters in the vicinity of six regions were identified and their properties obtained based on the following catalogues: Pietrzynski et al. (pea99 (1999)) (P99), Bica et al. (bea99 (1999)) (B99), Bica et al. (bea96 (1996)) (B96), Pietrzynski and Udalski (pu00 (2000)) (PU2000). B96 presented integrated UBV photometry of 624 star clusters and associations in the LMC. They estimated the ages of the clusters based on their integrated colours and hence classified the clusters into SWB types (Searle, Wilkinson & Bagnoulo swb80 (1980)), which is basically an age sequence. This classification can be used to obtain the approximate age of the clusters. B99 is a revised version of the above catalogue and contains about 1808 star clusters for which the positions and extents are tabulated. P99 presented photometric data of 745 star clusters and their nearby field, of which 126 are new findings. PU2000 estimated the ages for 600 star clusters presented in the P99 catalogue. The catalogues in B99 and P99 were used to identify the clusters, while B96 and PU2000 were used to estimate the ages of the identified star clusters.
Clusters have been identified within 30 arcmin radius around 6 regions. 109 clusters have been identified near 6 regions. Of these, age estimates for 89 clusters could be obtained from PU2000 and B96. The B96 gives the age of the cluster in terms of groups. Since the interest is in age groups of the cluster population rather than the ages of the individual clusters, the above data serves the purpose. Therefore, even those clusters whose exact age is known are also grouped. No systematic shift in the cluster age is found between the two catalogues. The number of clusters detected near each region, the number for which the age is known and the number of clusters in various age groups are tabulated in Table 2.
Field stars within a radius of a few arcmin are analysed to study the star formation history, while clusters within 30 arcmin ( 400 pc) radius are considered to identify the cluster formation episodes. The choice of larger radius for the clusters is justified as they are being used to study the star formation events which took place on relatively larger scales. It is found that the supergiant shell LMC 4 is about 1 Kpc in diameter. The size of the supergiant shell can be considered to be typically the area covered by a propagating star formation. Therefore, we have chosen very similar length scale for identifying the star clusters.
| Region | No. of clusters | No. of clusters | Age groups | ||||
| within 30 arcmin | with age known | 7.5 | 7.5 – 8.0 | 8.0 – 8.5 | 8.5 – 9.0 | 9.0 | |
| Region 1 | 15 | 12 | 1 | - | 7 | 3 | 1 |
| Region 2 | 9 | 8 | - | 4 | 1 | 2 | 1 |
| Region 3 | 17 | 13 | - | 3 | 3 | 3 | 4 |
| Region 4 | 24 | 19 | - | 2 | 11 | 4 | 2 |
| Region 5 | 17 | 15 | 1 | 1 | 6 | 5 | 2 |
| Region 6 | 27 | 22 | - | 4 | 11 | 7 | - |

3 Estimation of star formation history
The star formation history of the regions studied are derived using the CMDs. The CMDs represent stellar population of different ages present in the region. The brightest main-sequence (MS) stars represent the stars born out of the recent star formation event and the red giants represent stars born from an earlier star formation events. We use the technique of synthetic CMDs to reproduce the observed CMD and thereby estimate the star formation history.
3.1 Observed CMDs
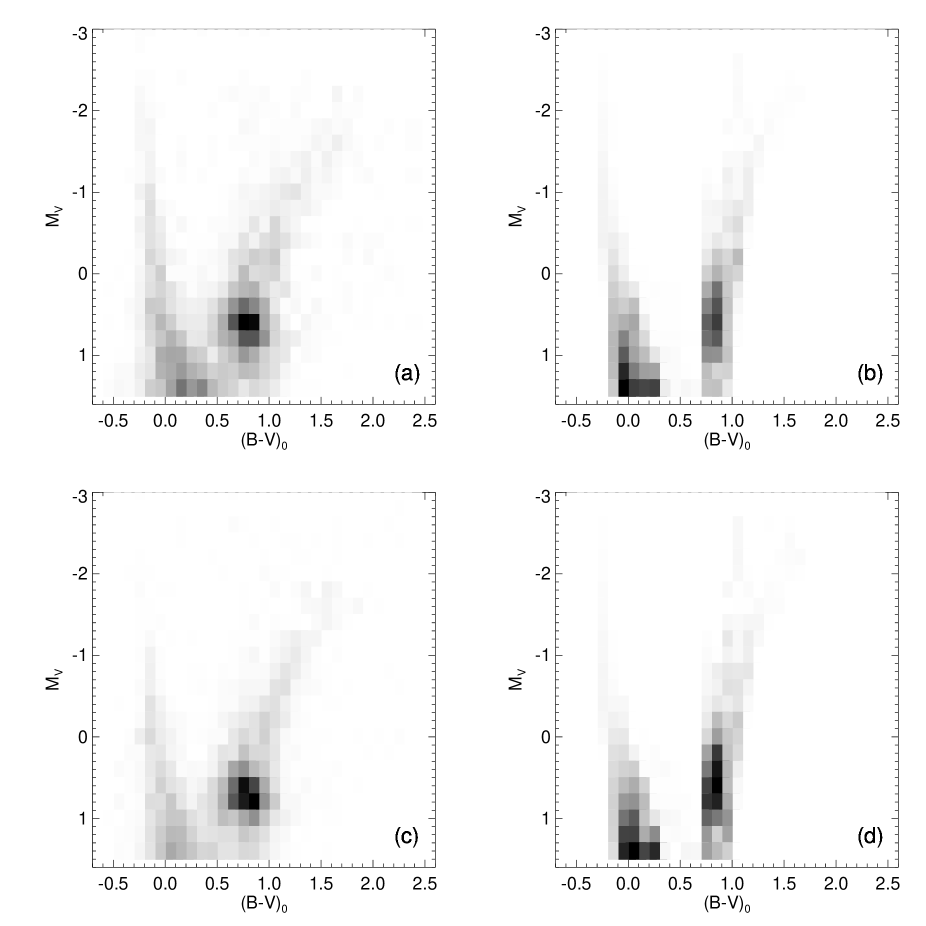
The observed V vs (BV) CMDs are obtained for stars located within a radius of a few arcmin from the center. The CMDs are shown in figure 2. The CMDs are affected by the reddening towards the observed region, photometric incompleteness in the data which is a function of stellar crowding and stellar magnitudes, and the distance. The incompleteness in the data is tabulated in Udalski et al. (u2000 (2000)) and these values are used for correcting the incompleteness. The CMD is made into a two dimensional array by binning in V and (BV). The width of the bin in V is 0.2 mag and (BV) is 0.1 mag. The number of stars in each bin is counted and then corrected for the incompleteness. For each box in the CMD, there would be separate values for the data incompleteness corresponding to the V and B frames, and the smaller value was used for the correction. After correcting for the incompleteness, two-dimensional stellar count was obtained. The number density of stars in each box is estimated by normalising the above values with respect to the total number of stars in the CMD. This density distribution of stars in the CMDs is used to compare with the synthetic CMDs. The selection of the values of reddening and the distance modulus are discussed section (3.3).
3.2 Synthetic CMDs
The synthetic CMDs are made with the help of stellar evolutionary models after assuming a model for the age-metallicity relation. We used the evolutionary models of the Padova group, Fagotto et al. (1994a ; 1994b ). The following relation between the age and metallicity was found to be satisfactory, for ages less than 4 Gyr, we used the Z=0.008 models, for ages between 4 and 9 Gyr, we used Z=0.004 models and for ages more than 9 Gyr and upto 12 Gyr, we used Z=0.0004 models. A small fraction of binaries ( 10%) and the photometric error in the observation are also included in the synthetic CMDs. The algorithm used here is an extension of that used in Subramaniam & Sagar (ss95 (1995, 1999)). In this algorithm, we introduced the age range such that we obtain heterogeneous population in age.
The procedure is described below. The synthetic CMDs for a set of ages with small age ranges were created. The stellar distribution in the synthetic CMDs are converted to density distribution, using a procedure similar to the observed CMD. These synthetic CMDs are used as templates of the stellar density distribution for various age ranges. The synthetic CMDs were created with sufficiently high number of stars in order to minimise the statistical fluctuations. The above mentioned templates are created for 10 – 50 Myr, 51 – 100 Myr and then for a gap of 100 Myr till 1000 Myr, thereby creating 11 templates. For the 50 Myr age range, the stars were created in a step size of 5 Myr, whereas for 100 Myr age range, a step size of 10 Myr was used. For ages beyond 1 Gyr, the templates were created for an age range of 200 Myr, till 2 Gyr, such that 5 templates were made available. Between 2 and 5 Gyr, 6 templates were created with an age range of 500 Myr. Though the present data is not very suitable for estimating the star formation history beyond 5 Gyr, for the sake of completion, the templates for ages older than 5 Gyr is also included. For older ages, the templates were made for 5 – 6 Gyr, 6 – 8 Gyr, 8 – 10 Gyr and 10 – 12 Gyr. These templates are used to create the final CMD in terms of stellar density, which in turn are compared with the density of the observed CMD. The density of the templates are scaled and combined to obtain the best fitting synthetic CMD, based on the minimisation technique. Scaling the stellar density in various templates is equivalent to adjusting the star formation rates (SFRs) in the respective ages. The SFRs are estimated in units of 1 X 10, such that this is the minimum detectable value. The range in the scaling factor for which the minimum value of the obtained is estimated for each template. The average and the deviation about the mean of the star formation rate for each age range are thus estimated.
The technique used here is very similar to that used in Dolphin (d97 (2000)), Olsen (o99 (1999)) and Dolphin (d00 (2000)). For stars younger than 1 Gyr the resolution in age is more, whereas it is less for population older than 1 Gyr. As we attempt to compare the cluster formation episodes, which have higher resolution at younger ages, the above values of resolution are adequate. The limiting magnitude in the OGLE II data is around mag. This implies the stars in the MS are younger than about 1.6 Gyr, while the RGB stars are a mixture of both young and old population. Therefore the present data is not suitable to understand the star formation history older than 4 Gyr. Also the cluster ages are known to have a gap between 4 and 10 Gyr. Although we have considered templates upto 12 Gyr, the comparison between the star and the cluster formation episodes stop at 4 Gyr.
3.3 Reddening and distance modulus
The reddening towards each region is estimated by comparing the location of the observed MS stars with the MS of the templates younger than 1 Gyr. The comparison was made with the stellar CMD. The regions 1, 3 and 4 were found to have a reddening of E(BV) = 0.06 mag, regions 2 and 5 were found to have E(BV) = 0.12 mag and the region 6 was found to have E(BV) = 0.08 mag. The reddening estimates have an error of 0.02 mag. These values of reddening agree very well with the reddening estimates as found by Subramaniam (as03 (2003)) for various location in the bar region, which is similar to the estimates by Udalski et al. (u99 (1999)), but with better spatial resolution. These values are also consistent with the values previously estimated for different location in the LMC and agrees (within errors) with those estimated by Dolphin (d00 (2000)). Following Pietrzynski & Udalski (pu00 (2000)) a distance modulus of 18.24 mag for the LMC is assumed initially. While creating the synthetic CMDs, the value of the distance modulus was changed and the value giving rise to the minimum value of is adopted. A value of 18.30 0.06 was found to produce the best fit for all the six regions. This would indicate a distance of 45.7 1.3 Kpc to the LMC. For this value of distance modulus, 1 arcmin corresponds to 13.4 pc on LMC. Thus a region with 30 arcmin radius would correspond to 400 pc. Thus the region scanned for clusters is 800 pc in diameter, this is similar to the sizes of supergiant shells in the LMC.
4 Results
4.1 Region 1
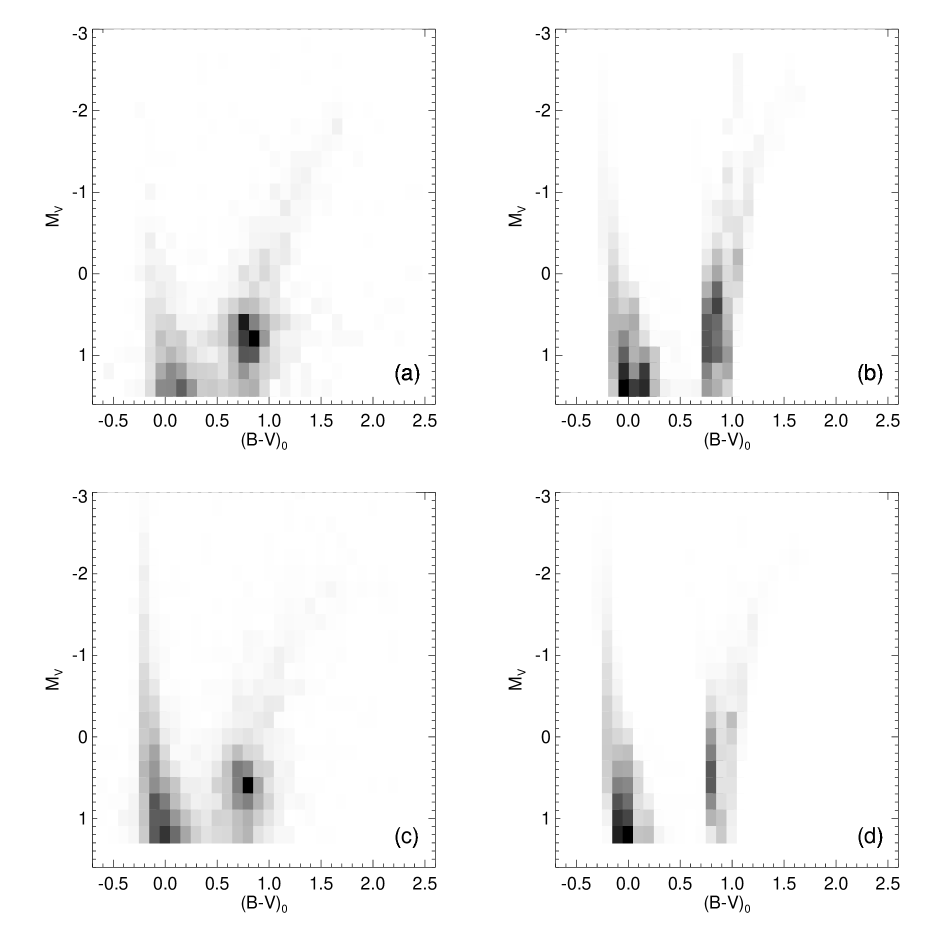
15 star clusters were identified within a radius of 30 arcmin ( 400 pc), of which the ages are known for 12 clusters. We find that, 58% of the clusters in this region have ages between 100 – 300 Myr, 25% between 300 Myr and 1 Gyr. Only 8% of clusters are either younger than 30 Myr or older than 1 Gyr. Hence the bulk of cluster formation has occurred in the 100-300 Myr range with a tapering towards 1 Gyr. Figure 5 shows the histogram of the normalised fraction of clusters with respect to age. The CMD of this field consists of 4132 stars within a radius of 5 arcmin as shown in figure 2. The observed stellar density is shown in figure 3, along with the synthetic one. It can be seen that the synthetic CMD looks very much like the observed one. The part which is not reproduced is the very high density of the red clump stars in the CMD. The other minor effect is the marginally more number of stars seen at the faint end of the MS. The overall agreement is quite good and the reduced value of the fit is 0.07. The estimated star formation rates is shown in figure 4. The region is found to have had a higher rate of star formation between 500 – 1000 Myr, then a reduced star formation till 2 Gyr. Between 2 Gyr to 10 Gyr, there was star formation in a very low rate. This region shows the presence of a burst of star formation between 10 – 12 Gyr. Also, we see that this region did not form much stars in the last 500 Myr.


Figure 5 shows the comparison of SFRs and fraction of clusters formed in various age groups. It is seen that the star formation event between 1.0 and 2.0 Gyr resulted in the formation of one star cluster. The star formation which continued to younger ages, resulted in the formation of 3 star clusters, which fall in the age range 300 – 1 Gyr. The enhancement in the cluster formation between 100 Myr – 300 yr is not reflected in the formation of field stars. For ages older than 300 Myr, the cluster and star formation events are correlated such that the number of clusters found between the age group 1 – 2 Gyr is less than that found in the group 300 Myr – 1 Gyr. On the other hand an anti-correlation is seen for ages younger than 300 Myr. Also there is very less star formation in the last 100 Myr, whereas there are at least two star clusters younger than 100 Myr. The point to be noted here is that the cluster formation seems to have continued to very recent times, whereas low SFRs are found in the last 200 Myr. In particular, the star formation and the cluster formation seems to differ in the last 200 – 300 Myr history.
4.2 Region 2
In this region, 9 star clusters have been identified within 30 arcmin radius and the ages of 8 clusters are known. 50% of the clusters have ages in the range 30 – 100 Myr, 12.5% have ages in the range of 100 – 300 Myr, 25% in the range 300 – 1 Gyr and 12.5% have ages beyond 1 Gyr. The field star population within 6 arcmin (80 pc) radius is studied based on a CMD of 6919 stars. The CMD is shown in figure 2.
The estimation of SFRs (figure 4) shows that the region has experienced a substantial increament in the SFR at ages around 500 Myr, after that the rate has decreased to near zero values at about 2 Gyr. Between 2 – 12 Gyr, there was very little star formation in this region. In the case of younger ages, the star formation has continued till about 10 Myr. There has been a slight increament in the last 50 Myr. Therefore this region has been had continued star formation in the last 2 Gyr period. The observed stellar density is shown in figure 3, along with the synthetic one. The feature which is not reproduced in the synthetic CMD is the peak in the red clump, similar to the case of region 1. The reduced value for the fit is 0.06. A small enhancement in the star cluster formation which occurred between 300 Myr – 1 Gyr, is well correlated with the high star formation rate at about 500 Myr. This region does not show the 100 – 300 Myr enhancement in the cluster formation, but shows a low rate formation of clusters, which also correlates with the low SFR seen during this period. There is one cluster which is less than 30 Myr old, and we do find an increament in the SFR between 10 – 50 Myr. Thus the star formation and the cluster formation are more or less correlated in this region.
4.3 Region 3
This region is situated right at the center of the LMC Bar. 17 are found in the 30 arcmin radius, of which ages are known for 13 clusters. Cluster formation in this region appears to be at a more or less constant rate until 30 Myr. 31% of clusters are with ages more than 1 Gyr, and 23% of clusters in the lower age ranges. Hence the cluster formation rate was lowered around 1 Gyr, after an initial higher rate. The CMD of 9607 stars within a radius of 3 arcmin is shown in Figure 2.
The SFR estimates show that this region has increased SF between 600 – 1200 Myr. The SFR then decreased and settled at a very low value around 2 Gyr. During the 10 – 12 Gyr period, this region seems to have experienced an enhancement in star formation. This is similar to region 1, but the estimated SFR is slightly less. The density in the CMDs show that the simulated CMD matches well with the observed one. The red clump peak is again not well reproduced. The reduced value of the fit is 0.05. The observed stellar density is shown in figure 6, along with the synthetic one.
In this region, we see that the cluster formation was more or less constant and a steady rate of cluster formation is observed between 30 – 1000 Myr and a slightly increased rate after 1000 Myr. The estimated SFRs show that the star formation was not continuous between the above period, rather the SFR showed increament at 600 Myr, then increased further till 1200 Myr. Then it is seen to have decreased after 2 Gyr. If we consider that the increased star formation seen between 1 - 1.2 Gyr correlates with the increase in the cluster formation, then both the rates can be considered to be correlated for ages older than 1 Gyr. Between the ages 300 – 1000 Myr, the SFR shows increament and the cluster formation shows a slight decreament. On the other hand, for ages in the range 100 – 300 Myr, we do not find any correlation. The cluster formation is found to have continued at the same rate, whereas the SFR is found to be reduced. The SFR shows an enhancement in the 50 – 100 Myr age range, with a decreased SFR upto the last 10 Myr. Thus the star and the cluster formation rates are found to be more or less correlated, except for the 100 – 300 Myr age range.
4.4 Region 4
There are 24 star clusters in the 30 arcmin radius and ages are known for 19 of them. The maximum number of star clusters were formed during the period 100 – 300 Myr, which is 58% of the clusters. 21% of clusters were formed during 300 – 1 Gyr period, 10% formed during the 30 – 100Myr period and the rest during the period before 1 Gyr. The CMD of stars within 2 arcmin radius plotted in figure 2 comprises of 5244 stars.
The synthetic CMD as shown in figure 6 indicates that it has more MS stars and a wider RGB. The reduced value for the fit is found to be 0.1, which is slightly higher when compared to the other regions. The SFR shows peak values between 500 Myr and 1.3 Gyr. A slight enhancement is seen around 2 Gyr. The SFR is found to be very low in the age range 2 – 10 Gyr, with a relatively higher rate between 10 – 12 Gyr. On comparing the star and cluster formation episodes, we find that the star formation event which occurred in the age range 1.0 – 2.0 Gyr has managed to form two star clusters. The star formation which continued to younger ages, upto 300 Myr, has resulted in the formation of 4 star clusters. The cluster formation episode is seen to be quite strong in the age range 100 Myr – 300 yr, whereas very minimal SFR is estimated in the same age range. Two star clusters are found to be younger than 100 Myr, an enhancement in the SFR is found for ages younger than 50 Myr. Thus the SFR and the cluster formation are well correlated except for the age range 100 – 300 Myr.

4.5 Region 5
Within a radius of 400 pc, we identified 17 star clusters and ages are known for 15 of them. We find that, 40 % of the clusters have ages in the range 100 – 300 Myr, 33.3% of clusters have ages in the range 300 – 1 Gyr and 13.3% clusters are older then 1 Gyr. The CMD of 6503 field stars within a region of 2 arcmin (27 pc) radius is plotted in figure 2.
The synthetic and the observed CMDs are compared in figure 7. The synthetic CMD shows a vertical RGC and more stars at the fainter end of the MS, which are not seen in the observed CMD. The reduced value for the fit is found to be 0.14 and this is the worst fit among all the regions. The estimated SFRs show that the values are high in the age range 300 – 800 Myr. Very small SFR is found between 2 – 8 Gyr and a slightly high rate between 8 and 12 Gyr. On comparing the cluster formation rate, the two clusters older than 1 Gyr could be formed between 1 – 2 Gyr along with the star formation. The enhanced cluster formation between 300 – 1 Gyr is correlated well with the enhancement in the SFR. Six star clusters are formed between 100 – 300 Myr, whereas an enhancement in the SFR is found at 250 Myr. One cluster is found younger than 30 Myr and one between 30 – 100 Myr. Correspondingly, enhancement in the SFR is found for ages younger than 50 Myr. Hence we find a more or less correlated star and cluster formation for all ages.
4.6 Region 6
27 star clusters are found within the 30 arcmin radius, of which the ages are known for 22. 18% of the clusters have ages within 30 – 100 Myr, 50% have ages between 100 – 300 Myr and 32% have ages between 300 – 1 Gyr. These indicate that there was a burst of cluster formation some time during 100 – 300 Myr with a tapering star formation before and after this burst. 3302 field stars located within 4 arcmin (54 pc) radius were identified and the CMD of the field stars are plotted in figure 2.
The synthetic CMD as shown in figure 7 shows that the RGC population is not matched, though the overall match could be considered satisfactory. The reduced value is found to be 0.06. The estimated SFRs are found to be high in the interval of 50 Myr – 1000 Myr, and then decreasing upto 2 Gyr. Very low SFR is found in the interval of 2 – 10 Gyr, with a relatively higher rate in the 10 – 12 Gyr interval. On comparing the SF and the CF episodes, both the rates are found to increase at about 1 Gyr. The CF rate increases further at 300 Myr, whereas the SF rate is reduced. This region is found to show recent star formation corresponding to the presence of young star clusters. 4 star clusters are found in the age range 30 – 100 Myr, whereas the SFR is found to decrease slightly at 50 Myr. Therefore, the SF and CF seem are found to be less correlated in the age range 30 – 100 Myr, whereas indications of anti-correlation are found in the 100 – 300 Myr age range.
5 Discussion
The aim of the present analysis is to verify the correlation between the star and cluster formation rates at different epochs in the LMC, particularly at smaller scales. The present study shows that SFRs and the cluster formation rates are more or less correlated for the age range 30 – 100 Myr. In the age range 100 – 300 Myr, 5 regions show an enhancement in the cluster formation, whereas such an enhancement is not noticed in the SFR. In the age range of 300 – 1000 Myr, the SF as well as the cluster formation shows enhancement in their rates. It is also found that the SF and CF are more or less correlated for ages more than 1 Gyr.
Girardi et al. (g95 (1995)) estimated the age distribution of star clusters in LMC. They found three periods of enhancement in the formation of star clusters in LMC, namely at 0.1 Gyr, 1–2 Gyr and 12 – 15 Gyr. Pietrzynski & Udalski (pu00 (2000)) found peaks in star cluster formation at 7 Myr, 125 Myr and 800 Myr. They also found peaks at 100 Myr and 160 Myr, which they attribute to the last encounter of the Magellanic Clouds. Grebel et al. (g99 (1999)) found that the age distributions of both LMC and SMC clusters peak at 100 Myr, when the Clouds had their closest encounter and last perigalacticon. All the above indicate that the substantial number of clusters seen in the 100 – 300 Myr around 5 regions could be part of the cluster formation peak at that time. Hence the anti-correlation between the SF and CF during this period could indicate that the type of SF which induced the CF is different in this period. On the other hand, the peak in the CF at 800 Myr is well correlated with the SF, where in most of the regions, the SFR was highest around the age of 800 Myr. Therefore, the highest correlation between CF and SF is found at 800 Myr, whereas anti-correlation is found in the age range of 100 – 300 Myr.
It is possible that some assumptions as well as the choice of data could modulate or bias the results obtained here. Some of the possibilities are explored below. (1) Incompleteness in the cluster data: The incompleteness affects the fainter clusters and hence the older clusters will be more affected, than the younger ones with the bright stars. This can only increase the discrepancy observed here and not reduce it. (2) Inappropriate estimates of the SFRs: An inspection of the CMDs of the regions presented in figure 2 indicates low star formation rates for ages younger than a few hundred Myr. In most of the cases the brightest few stars observed belong to 100 Myr age range. There could be bias for very bright stars as they could have got saturated. This can only affect the very young population, but not for ages older than 50 Myr. (3) Statistical significance: It is very unlikely as the discrepancy is found for 5 out of 6 regions studied here. All the regions have good number of star clusters especially for ages younger than 300 Myr. (4) Selection effect: The regions studied here do not have any apriory information or property. The choice was only based on the availability of clusters in the neighbourhood. Hence the results is very unlikely to be affected by this. (5) The center field may not be the true representative of the entire 400 pc region. We have assumed that the stars in the central few pc could represent the radius of 400 pc. If this assumption is not valid such that there is difference in population within the radius, the results above may not be valid. To check this, the CMDs were created at for the annulus between 25 and 30 arcmin, which would sample the stars near the periphery. When the central and the peripheral CMDs were compared, no significant changes in the stellar density were noticed. Special attention was given to the younger population and no noticeable increase was noticed in the stellar population younger than 300 Myr. Hence we assert that the result obtained here is likely to be a true feature in the LMC, at least near the bar regions.
In general star formation results in the formation of field stars as well as groups or clusters of stars. Therefore, SFR is an indicator of the amount of star formation or the major star formation events. The rate of cluster formation therefore is expected to be correlated with the SFR. The main result of this study is that the SF and CF are not seen to be correlated in the 100 – 300 Myr history of the LMC, whereas it seems to be well correlated for ages more as well as less than the above range. This is a surprising result as one expects the imprint of star formation to be present in the field stars as well.
The results presented here could indicate that the star formation in the LMC, has had more preference to the formation of clusters, bound or unbound in the 100 – 300 Myr age range. This results in the overabundance of star clusters in this age range. Such a discrepancy decreases for older ages, as the stellar evolution as well the dynamical evolution dissolves the clusters beyond the limit of detection. This happens in the case of open clusters and not for the blue globulars. The LMC is also seen to have a healthy population of binary clusters. The age distribution of the multiple clusters in the LMC shows that the largest fraction falls in the 100 – 300 Myr age range. This also supports the idea of preferred formation of clusters. As the LMC is known to have a slowly rotating disk, the clusters born together are likely to spend considerable amount of time together. As the tidal field of the LMC is very weak, the clusters located close by have better chance to merge together, than to disrupt and move farther away.
The LMC is known to be interacting with our Galaxy and the Small Magellanic Cloud (SMC). There are many studies which look for the signatures of possible encounters (Westerlund w97 (1997) and references therein, Maragoudaki m01 (2001)) and also studies which do simulation of the dynamics of the interaction between the three galaxies (Fujimoto & Murai fm84 (1984), Gardiner & Noguchi gn96 (1996), Gardiner et al. g94 (1994)). These studied have found that the LMC had an interaction with our Galaxy at about 1.5 Gyr ago, with SMC at 0.2 – 0.4 Gyr and LMC had a perigalacticon at 100 Myr. The SFRs which peaked around 800 Myr decreased for younger ages, while the cluster formation increased in the 100 – 300 Myr age range. Thus the cluster formation episode of 100 – 300 Myr could be correlated with the interaction with SMC or our Galaxy. SMC also shows a peak in cluster formation between 100 – 300 Myr (Grebel et al. g99 (1999)). Some clusters could also have been formed due to the propagating star formation started by the triggers. On the contrary, the interaction between the Clouds does not seem to be the cause for the cluster and star formation peak at 1000 Myr. The result presented here indicates that the star formation induced by interaction may likely to be biased towards group formation of stars, whereas such a bias is not found in the case of star formation without any interaction. The formation of globular clusters or dense clusters is observed in the case of interacting galaxies. For example, in the case of colliding galaxies, NGC 4038/4039 very massive clusters are found to be formed.
Acknowledgements.
I thank the referee G.Pietrzynski for helpful comments.References
- (1) Bica, E., Claria, J.J., Dottori, H., Santos, J.F.C.JR., Piatti, A.E., 1996, ApJ, 102, 57
- (2) Bica, E., Schmitt H.R., Dutra, C.M., Oliveira, H.L., 1999, AJ, 117, 238
- (3) de Boer, K.S., Braun, J.M., Vallenari, A., Mebold, U., 1998, A&A, 329, L49
- (4) Dolphin, A.E., 2000, MNRAS, 313, 281
- (5) Dolphin, A., 1997, New Astronomy, 2, 397
- (6) Fagotto, F., Bressan, A., Bertelli, G., Chiosi, C., 1994, A&A, 105, 29
- (7) Fagotto, F., Bressan, A., Bertelli, G., Chiosi, C., 1994, A&A, 104, 365
- (8) Feitzinger, J.V., Glassgold, A.E., Gerola, H., Seiden, P.E., 1981, A&A, 98, 371
- (9) Fujimoto, M., Murai, T., 1984, IAU Symp. 108, p. 115
- (10) Gardiner, L. T., Sawa, T., Fujimoto, M., 1994, MNRAS, 266, 567
- (11) Gardiner L. T., Noguchi, M., 1996, MNRAS, 278, 191
- (12) Girardi, L., Chiosi, C., Bertelli, G., Bressan, A., 1995, A&A, 298, 87
- (13) Grebel, E.K., Zaritsky, D., Harris, J., 1999, IAU Symp., Vol. 190, p. 405
- (14) Holtzman, J.A., Gallagher III, J.S., Cole, A.A., Mould, J.R., Grillmair, C.J., Ballester, G.E., Burrows, C.J., Clarke, J.T., Crisp, D., Evans, R.W., Griffiths, R.E., Hester, J.J., Hoessel, J.G., Scowen, P.A., Stapelfeldt, K.R., Trauger, J.T., Watson, A.M., 1999, AJ, 118, 2262
- (15) Maragoudaki, F., Kontizas, M., Morgan, D.H., Kontizas, E., Dapergolas, A., Livanou, E., 2001, A&A, 379, 864
- (16) Olsen, K.A.G., Hodge, P.W., Mateo, M., Olszewsky, E.W., Schommer, R.A., Suntzeff, N.B., Walker, A.R., 1998, MNRAS, 300, 665
- (17) Olsen, K.A.G., 1999, AJ, 117, 2244
- (18) Pietrzynski, G., Udalski, A., Kubiak, M., Szymanski, M., Wozniak, P., Zebrun, K., 1999, Acta Astron., 49, 521
- (19) Pietrzynski, G., Udalski, A., 2000, Acta Astron., 50, 337
- (20) Searle, L., Wilkinson, A., Bagnoulo, W., 1980, ApJ, 239, 803
- (21) Subramaniam, A., Anupama, G.C., 2002, A&A, 390, 449
- (22) Subramaniam, A., Sagar, R., 1999, AJ, 117, 937
- (23) Subramaniam, A., Sagar, R., 1995, A&A, 297, 695
- (24) Subramaniam, A., 2003, ApJ, 598, L19
- (25) Udalski, A., Soszynski, I., Szymanski, M., Kubiak, M., Pietrzynski, G., Wozniak, P., Zebrun, K., 1999, Acta Astron., 49, 223
- (26) Udalski, A., Szymanski, M., Kubiak, M., Pietrzynski, G., Soszynski, I., Wozniak, P., Zebrun, K., 2000, Acta Astron., 50, 307 (OGLE II data)
- (27) van den Bergh, S., 1999, IAU Symp., Vol. 190., p. 569
- (28) Westerlund, B. E., 1997, The Magellanic Clouds (Cambridge: Cambridge Univ. Press)
- (29) Zaritsky, D., Harris, J., Thompson, I., 1997, AJ, 114, 1002