The far-infrared spectrum of Arp 220111Based on observations with the Infrared Space Observatory, an ESA project with instruments funded by ESA Member States (especially the principal investigator countries: France, Germany, Netherlands, and the United Kingdom) and with the participation of ISAS and NASA.
Abstract
ISO/LWS grating observations of the ultraluminous infrared galaxy Arp 220 shows absorption in molecular lines of OH, H2O, CH, NH, and NH3, as well as in the [O I] 63 m line and emission in the [C II] 158 m line. We have modeled the continuum and the emission/absorption of all observed features by means of a non-local radiative transfer code. The continuum from 25 to 1300 m is modeled as a warm (106 K) nuclear region that is optically thick in the far-infrared, attenuated by an extended region (size 2′′) that is heated mainly through absorption of nuclear infrared radiation. The molecular absorption in the nuclear region is characterized by high excitation due to the high infrared radiation density. The OH column densities are high toward the nucleus ( cm-2) and the extended region ( cm-2). The H2O column density is also high toward the nucleus ( cm-2) and lower in the extended region. The column densities in a halo that accounts for the absorption by the lowest lying levels are similar to what are found in the diffuse clouds toward the star forming regions in the Sgr B2 molecular cloud complex near the Galactic Center. Most notable are the high column densities found for NH and NH3 toward the nucleus, with values of cm-2 and cm-2, respectively, whereas the NH2 column density is lower than cm-2. A combination of PDRs in the extended region and hot cores with enhanced H2O photodissociation and a possible shock contribution in the nuclei may explain the relative column densities of OH and H2O, whereas the nitrogen chemistry may be strongly affected by cosmic ray ionization. The [C II] 158 m line is well reproduced by our models and its “deficit” relative to the CII/FIR ratio in normal and starburst galaxies is suggested to be mainly a consequence of the dominant non-PDR component of far-infrared radiation, although our models alone cannot rule out extinction effects in the nuclei.
1 Introduction
With a redshift of , Arp 220 (IC 4553/4) is the nearest and one of the best studied ultraluminous infrared galaxies (ULIRGs). The tails observed in the optical, together with the double highly-obscured and compact () nuclei observed in the near and mid-infrared, as well as in the millimeter, strongly suggest that the enormous luminosity of Arp 220, L⊙, is the result of galactic merging. Nevertheless, the concrete physical process responsible is still a matter of debate: the proposed sources are hidden active nuclei and/or bursts of star formation.
Molecular observations of Arp 220 provide unique clues to the physical and chemical processes ocurring in the nuclei and their surroundings. In the millimeter region, CO observations have been carried out with increasingly high angular resolution (Radford, Solomon, & Downes, Radford et al.1991; Scoville et al., 1991; Okumura et al., 1994; Scoville, Yun, & Bryant, Scoville et al.1997; Sakamoto et al., 1999). In particular they have shown that, on the one hand, CO emission arises from a region significantly more extended than the nuclei (), and on the other hand that the CO(2-1) to CO(1-0) intensity ratio is lower than 1, thus suggesting that CO mainly traces low density regions ( cm-3). Observations of molecules with high dipole moment, like CS and HCN, have revealed that the fraction of molecular gas contained in dense clouds ( cm-3) is much larger than in normal galaxies, yielding M⊙ of dense gas (Solomon, Radford, & Downes, Solomon et al.1990, Solomon et al.1992). Radford et al. (1991b) found that HCN(1-0) and HCO+(1-0) peak strongly toward the nuclei, but also show low-level extended emission. More recently, Aalto et al. (2002) have detected emission from the high density tracers HNC and CN, and the relatively low HCN/CN and HCN/HNC intensity ratios were attributed to widespread PDR chemistry.
The launch of the Infrared Space Observatory (ISO) opened a new window for the study of the physical and chemical properties of ultraluminous infrared galaxies. Despite the lack of angular and spectral resolution, the observations of Arp 220’s far-infrared spectrum from 40 to 200 m (Fischer et al., 1997, 1999) and of a number of individual lines in the SWS range (Sturm et al., 1996) provided new insights in our understanding of the ionic, atomic and molecular content of the galaxy. These wavelength regions are of great interest, because the bulk of the enormous luminosity is emitted in the far-infrared, and also because they contain lines of important molecular, ionic, and atomic species. Skinner et al. (1997) reported the detection of the 35 m OH line in Arp 220. Fischer et al. (1997, 1999) found that the far-infrared molecular absorption lines of OH, H2O, CH, and NH3 are significantly stronger in Arp 220 than in less luminous infrared-bright galaxies while the fine structure lines from ionic species are, to the contrary, extremely weak. Luhman et al. (1998, 2003) found that, like in the ULIRG Arp 220, the [C II] to the far-infrared luminosity ratio is typically nearly an order of magnitude weaker than in lower luminosity infrared-bright galaxies. Sturm et al. (1996) reported the detection of two ortho-H2 pure rotational lines, indicating that high masses of gas are subject to PDR conditions and/or shock activity. Although the few other ULIRGs for which either full LWS spectra or partial scans in the vicinity of the OH lines were obtained also show far-infrared molecular absorption (Kegel, Hertenstein, & Quirrenbach, 1999; Harvey et al., 1999), the rich molecular LWS spectrum of Arp 220 is unique for its high signal-to-noise ratio.
The physical and chemical processes that account for the rich molecular far-infrared spectrum of Arp 220 can be better understood if quantitative values of the column densities of the above species, as well as their excitation conditions, are estimated. The presence of OH and, to some extent, of H2O, may be indicative of PDR and/or diffuse interstellar cloud chemistry, and their column densities potentially give an estimate of the UV field in the source. On the other hand, large amounts of H2O are produced in non-dissociative shocks (e.g. Cernicharo et al., 1999), where the OH abundance is also enhanced (Watson et al., 1985). The OH abundance is expected to be generally higher than that of H2O in fast dissociative shocks (Neufeld & Dalgarno, 1989). H2O ice in grain mantles may also efficiently return to the gas phase through sublimation of mantles in “hot core” regions. But whatever the characteristics of the regions producing the observed molecular features, the lines under study lie at wavelengths where the enormous infrared continuum flux approaches its maximum, and the molecular excitation of high-dipole species should be strongly affected by absorption of continuum radiation. Hence any reliable estimation of molecular column densities require accurate models for the dust emission. Unfortunately ISO’s lack of angular resolution forces us to rely on plausibility arguments in our assumptions about the regions where the different lines are formed; some of these are based on general requirements of excitation, and others on conclusions from observations of galactic sources. The main goal of this work is thus to shed light on the physical and chemical processes in Arp 220, based on detailed model fits of its continuum and far-infrared molecular/atomic line absorption and emission spectrum. We adopt a distance to Arp 220 of 72 Mpc (projected linear scale of 350 pc/arcsec, Graham et al., 1990). In section 2 we present the ISO/LWS observations; in section 3 we discuss the line identifications; section 4 is a discussion of the models for the continuum emission; section 5 presents the models for the molecular and atomic species; in section 6 we discuss the implications of the radiative transfer models, and section 7 summarizes our main results.
2 Observations
The full 43-197 m spectrum of Arp 220, obtained with the LWS spectrometer (Clegg et al., 1996) on board ISO (Kessler et al., 1996) (TDT222Target Dedicated Time number, a unique identifier for each observation number 27800202), was presented by Fischer et al. (1997, 1999). The grating spectral resolution is 0.3 m in the 43–93 m interval (detectors SW1–SW5), and of 0.6 in the 80–197 m interval (detectors LW1–LW5), corresponding to km s-1. The lines are thus not resolved in velocity. The beam size of ensures that all the continuum and line emission/absorption from Arp 220 (CO size , , Scoville et al.1997, hereafter SYB97) lie within the ISO aperture.
The data we present here (coadded TDT numbers 27800202, 64000916, and 64000801) were reduced using version 9.1 of the Off Line Processing (OLP) Pipeline system which we found to produce a higher signal-to-noise spectrum than OLP 10.1. However, we adopted the continuum correction given by OLP version 10.1, which typically gives absolute responsivity corrections with uncertainty factors times lower than are produced by version 9 (Tim Grundy, private communication). We performed subsequent data processing, including further de-glitching, co-addition, and scaling, using the ISO Spectral Analysis Package (ISAP; Sturm et al., 1998). In order to obtain a smooth spectrum throughout the whole LWS range, the flux densities given by each detector were corrected by multiplicative scale factors. Corrections were lower than 10% except for detector SW1 (43–64 m), for which the correction was of 15%. Thus we attribute a conservative uncertainty of 15% to the overall continuum level.
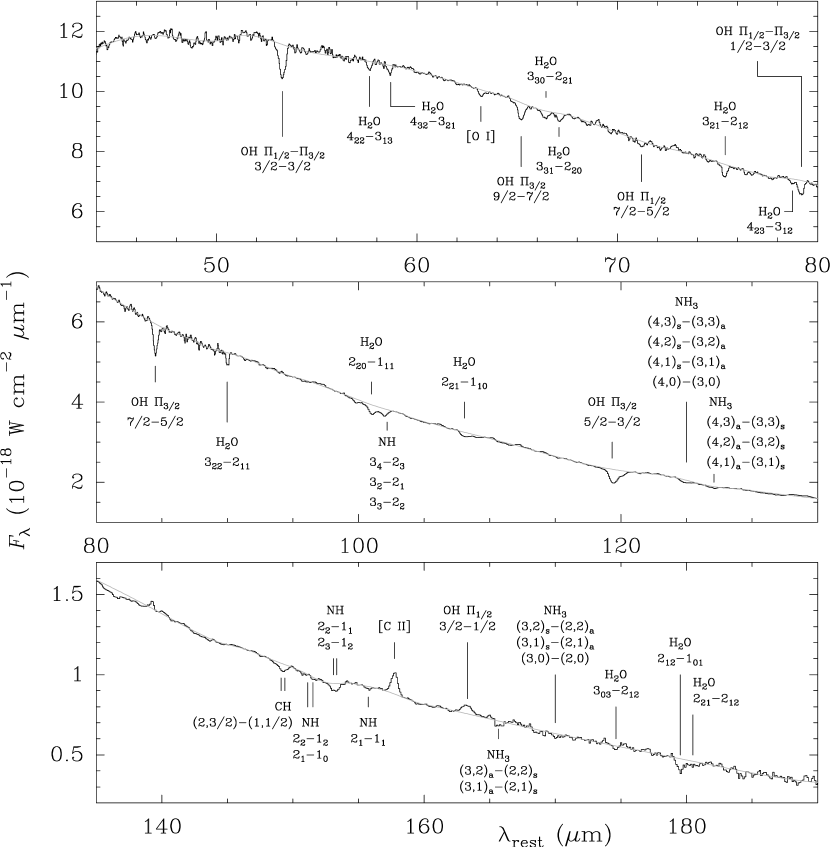
The LWS spectrum of Arp 220 is presented in Fig. 1 together with identifications of the most prominent lines. Owing to transient effects, the fluxes of weak lines as observed in the forward and reverse scans were found to differ significantly in some wavelength ranges. In these cases, if a line appeared close to the upper or lower end of a detector, the reverse or forward scan was selected for that line, respectively, as has been found to minimize the transient effects (Tim Grundy, private communication). Nevertheless, the average of both scans was used throughout most of the spectrum. In wavelength regions where two detectors’ responses overlap, line fluxes were generally found to be consistent. The only exception was the H2O line at 90 m, which showed in LW1 a flux 60% weaker than in SW5. We adopted here the SW5 spectrum, but the flux of the above H2O line should be considered highly uncertain. The subtraction of a baseline (see Fig. 1) added additional uncertainty to the line fluxes, particularly in cases of broad features presumably composed of several lines. With the exception of the H2O line, we estimate a line flux uncertainty generally lower than 35%.
We note for reference, that for the LWS spectral resolution km s-1, a line that is optically thick at line center with a line width of 300 km s-1 and negligible line or continuum re-emission, would show aborption at line center of % in Fig. 1.
3 General results
OH and H2O: The FIR spectrum of Arp 220 is dominated by unresolved OH doublets (hereafter simply referred to as lines) and H2O lines in absorption, with the exception of the OH emission line at 163.3 m. Figure 2 shows the level diagram of OH, ortho-H2O and para-H2O, and indicates the lines detected in Arp 220. Lines with very different excitation requirements are observed throughout the spectrum. The OH lines at 65 m and at 71 m have lower levels at 290 K and 415 K above the ground state, respectively, whereas the H2O lines (59 m) and (58 m) have lower levels at 305 K and 205 K. Strong absorption is also observed in the OH ground state lines at 53, 79, and 119 m, as well as in the H2O lowest-lying line at 179 m. This wide range of excitation suggests that several regions with different physical conditions are contributing to the observed features (Fischer et al., 1999), and one of the goals of this work is to provide a reasonable estimate of the nature of these regions and their relative contributions to the spectrum. On the other hand, several of the lines have complex shapes, with evidence of shoulders suggestive of weaker secondary lines. In particular, the ground state OH 119 m line shows a redshifted “shoulder”, which is detected in both the forward and reverse scans, although with somewhat different strengths. It could be attributed to the 18OH line at 120.1 m, although contamination by other species such as CH+ cannot be ruled out. Also, the redshifted “wing” of the H2O line at 179 m, attributed in Fig. 1 to the H2O line, could also be contaminated by HO, CH (see Fig. 7), and H3O+.
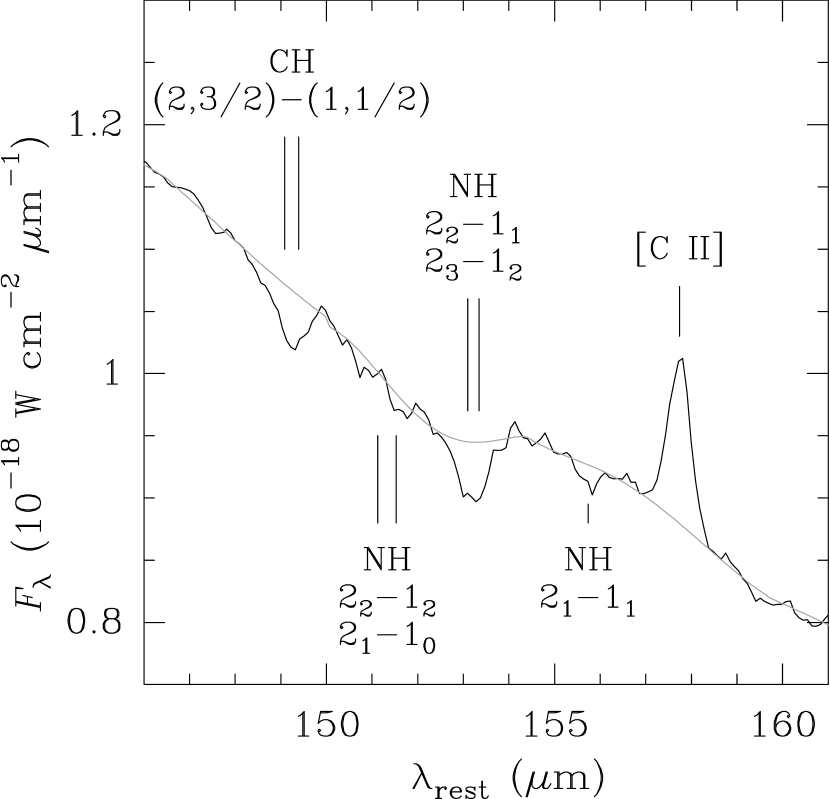
CH and NH: The spectrum contains lines from other molecular species: like CH at 149 m, NH3 at 125, 166 and 170 m and, very interestingly, strong absorptions at 102 and 153.2 m that have been identified as NH in Fig 1. Evidence for the latter identifications is strengthened because of the presence of weak line-like features at 155.74 m, and marginally at 151.53 m, which would correspond to the NH and lines, respectively (see also Fig. 3). Conceivably, the line absorptions at 102 and 153.2 m could be severely contaminated by other species, like C3, HO, NH3, and even OH+. C3 has a strong transition at 153.3 m, but its contribution is expected to be minimal due to the lack of detection of other adjacent C3 lines (in particular at 154.86 m). The absorption at 102 m may be contaminated by the HO line (just at 102.0 m), but since the HO should not be as strong as the corresponding adjacent line of the main isotope HO, we regard this identification as also unlikely. Some contribution of NH3 lines to the 102 m feature might be expected, but they are somewhat shifted in wavelength (they lie between 101.5 and 101.7 m). Both features could be contaminated to some extent by OH+, with strong lines at 101.70 and 101.92 m ( and ) and at 153.0 m (), but the strong absorption at 153.2 m absorption could never be explained by OH+ alone. Therefore, despite the possible contamination from other molecules, NH is probably responsible for most, if not all, of the observed 153.2 m absorption (see also Fig. 7). Thus, although the definitive assignment to NH should await confirmation with higher spectral resolution observations of the lowest-lying NH transitions at GHz, we conclude that ISO observations strongly support its detection in Arp 220, and advance a model of the observed absorption (section 5) that can be useful to direct future observational and theoretical studies. If confirmed, this detection is the first extragalactic detection of NH, which has been previously detected only in galactic diffuse clouds through electronic transitions (Meyer & Roth, 1991; Crawford & Williams, 1997) and, interestingly, toward Sgr B2 in the Galactic Center via the same transitions detected in Arp 220 (Cernicharo, Goicoechea, & Caux, 2000; Goicoechea, Rodríguez-Fernández, & Cernicharo, 2004, hereafter GRC04).
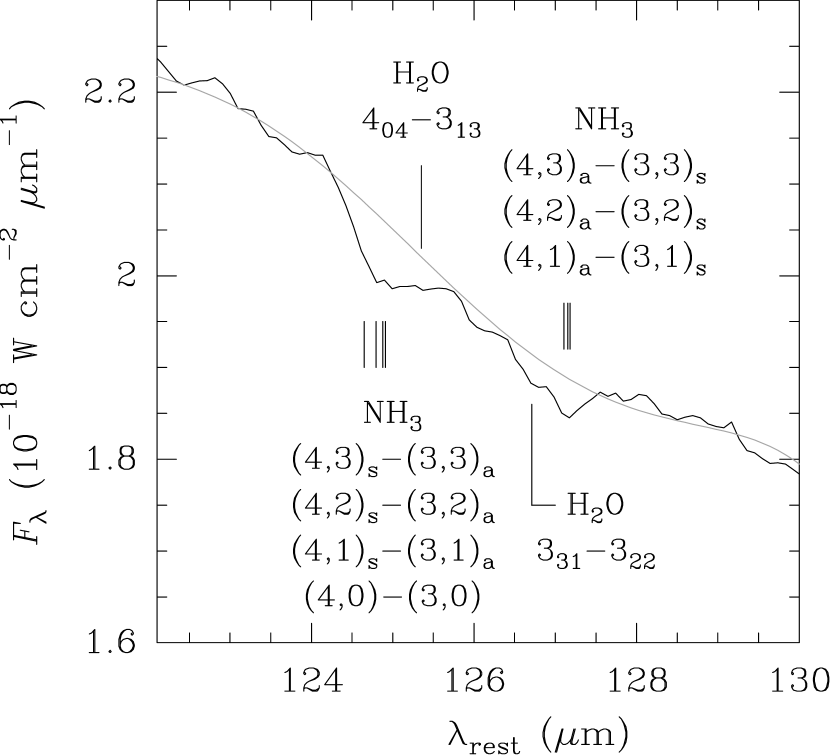
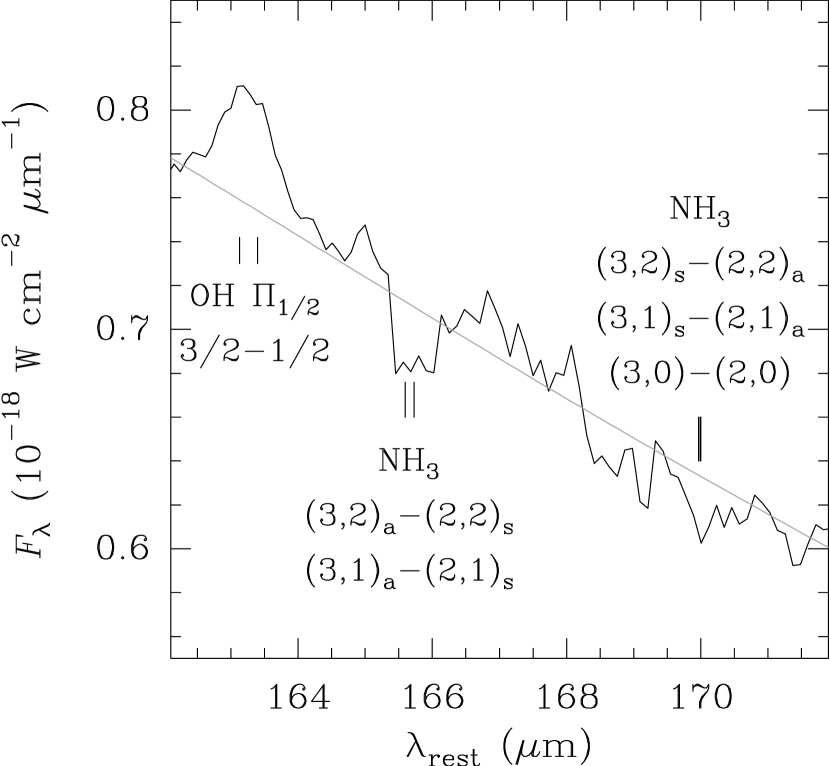
NH3: The spectrum of Arp 220 around 125 and 170 m, shown in Figure 4, strongly supports the identification of NH3. The shape of the 165.7 m feature indicates transient effects, but the line is detected in both the forward and reverse scans. Some H2O lines may contribute to the observed 125 and 127 m features, but they are shifted in wavelength relative to the strongest absorption. This is the first extragalactic detection of infrared NH3 lines. With the detection of NH and NH3 we might expect to detect NH2, but there is no evidence for its strongest expected lines at 159.5, 117.8 and 104.9 m.
CO?: An apparent emission line, detected in both the forward and reverse scans, is present at 173.7 m in Fig. 1. It coincides rather well with the expected position of the CO line at 173.63 m. This identification cannot be confirmed by the detection of other expected CO lines because the CO line at 186.0 m lies at the noisy edge of the LW5 detector and the CO line at 162.8 m is blended with the OH 163.3 m line. The higher lines are expected to be too weak to be detectable, given the observed strength of the 173.7 m feature.
[O I] and [C II]: The ISO spectrum also shows the [O I] 63.2 m line in absorption and the [C II] 157.7 m line in emission. The [O I] 145.5 m line is not detected. These lines, as observed in Arp 220 and other ULIRGs, have been discussed elsewhere (Fischer et al., 1997, 1999; Luhman et al., 1998, 2003). In section 5 we present a simple model of the Arp 220 spectrum that may shed some light on the peculiar behavior of these lines in Arp 220.
In summary, the far-infrared spectrum of Arp 220 shows molecular lines of OH, H2O, CH, NH, and NH3. The atomic lines of [O I] at 63 m and [C II] at 158 m are also detected. Lines of other species, like CO, H3O+, CH+, and OH+, could also contaminate the observed features, but our limited spectral resolution prevents the possibility of unambiguous detection. Only the [C II] 158 m and the OH 163 m lines are clearly observed in emission. Lines from ions that would trace H II regions and/or an AGN are absent.
4 Models for the continuum
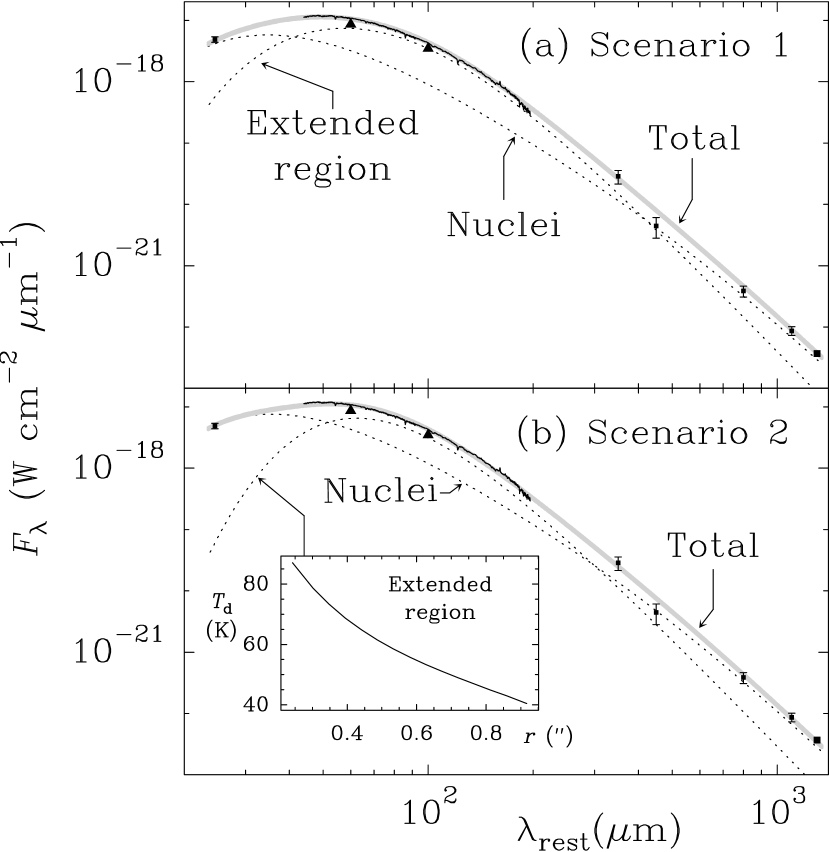
Figure 1 shows that the continuum peaks around 40 – 50 m. The bulk of the continuum from Arp 220 is emitted by heated dust grains. At 1.3 millimeter wavelengths, Sakamoto et al. (1999) showed that the continuum arises almost exclusively from the nuclei, with an equivalent size of . The non-thermal contribution at 1.3 mm is expected to be % (cf. Fig. 6 of Anantharamaiah et al., 2000). On the other hand, Soifer et al. (1999, hereafter S99) have shown that the two nuclei also account for essentially all the continuum at 25 m. Combining both observations, S99 proposed two alternative scenarios to explain the continuum emission of Arp 220 from far-infrared to millimeter wavelengths. Our models of the continuum emission are entirely based on these scenarios, which we have examined and refined quantitatively on the basis of our ISO 45-200 m spectrum.
Model S1: In the first scenario (hereafter S1), it is assumed that the emission from the nuclei is not significantly attenuated at 25 m by foreground material. We have simulated the emission from the nuclei as arising from a single nucleus with effective size of . With an effective dust temperature of 85 K, and optically thick emission in the submillimeter, the requirement that the fluxes at 25 and 1300 m arise from the nuclei is fulfilled. However, the emission at 60-100 m, as well as the total luminosity from the galaxy, are then underestimated and a more extended region (hereafter ER) must be invoked to account for the remaining flux. We identify this surrounding environment with the extended emission observed in CO, HCN, and HCO+. In this first scenario, then, most of the Arp 220 luminosity is produced in the ER, which has been modeled as a thin disk by SYB97, and as a warped disk by Eckart & Downes (2001). Significantly, if this model is correct, a spatially extended starburst, responsible for the bulk of the far-infrared luminosity is inferred.
Our best fit to the continuum using model S1 assumptions is presented in Fig. 5a, with derived physical parameters listed in Table 1. In all models, uniform densities throughout the different components are assumed for simplicity. In Table 1, is the wavelength for which the nucleus becomes optically thin (); owing to the high opacities involved, the inferred emission is rather insensitive to the spectral index . Thus we have given values of the physical parameters for and . The dust mass has been derived by assuming a mass-opacity coefficient of 12 cm2/gr at 200 m (Hildebrand, 1983). The parameters that have been allowed to vary in our models of the ER are the dust temperature , the diameter (within the range 500–800 pc), and the dust opacity; is fixed to 2 to ensure negligible emission at millimeter wavelengths (see S99).
Model S2: In the second scenario (hereafter S2), the emission from the nuclei at 25 m is assumed to be attenuated by foreground dust with , a value which was chosen to be compatible with the silicate absorption observed in S99. The nuclei account for the required flux at 24.5 and 1300 m with K, significantly warmer than the K temperature in S1 and, as before, the emission in the submillimeter is optically thick (see Table 1). In this scenario as well, however, the flux at 60–100 m is again underestimated, and an emitting ER must also be involved to account for it. Nevertheless, the luminosity from the warm nuclei in S2 is enough to account for the observed total luminosity from Arp 220, so that the ER merely re-radiates the emission from the nuclei and no extended starburst is then needed to provide the bulk of the luminosity.
Figure 5b shows our best fit for S2. The unique parameters that have been allowed to vary in our models of the ER are the diameter and the dust opacity; is again fixed to 2, and the dust temperature (shown in the insert panel of Figure 5b) has been computed from the requirement that the heating balance the cooling throughout the source. The calculation of is carried out by assuming spherical symmetry, with the nucleus, the primary heating source, located at the center of the ER. The ER is divided into a set of spherical shells to account for the variation of with the distance to the nucleus. Once the profile is calculated, the flux contributions of the attenuated nucleus and the ER are computed separately, and added up to give the total flux. Despite the good fit to the continuum in Fig. 5b, S2 implicitly supposes a lack of spherical symmetry (e.g. the nuclear disk by SYB97) or some clumpiness, because the derived radial opacity of the ER at 24.5 m is 11.3, whereas the adopted opacity of the absorbing shell in front of the nuclei is . Furthermore, we do not rule out the possibility that the ER is only partially responsible for the foreground dust absorption of the nuclear emission by foreground dust. If the ER were concentrated in a thin disk as proposed by SYB97, little dust in the ER would be expected to lie in front of the nuclei and significant dust absorption would be attributed to another component, “the halo” (see section 5.1). Therefore our results for S2, which assume that the nucleus and the ER are spherically symmetric, should be considered only approximate, but suggestive. The intrinsic geometry that underlies S2 departs from spherical symmetry and implies that the total luminosity, which coincides with the luminosity of the nuclei, is lower than the value inferred in S1, where spherical symmetry and uniformity is assumed for each component (Table 1).
Table 1 shows that yields a dust mass of M⊙ for the nucleus, and that S1 gives a mass 1.4 times higher than S2. Since SYB97 infer a dynamical mass of M⊙ enclosed in the inner 250 pc radius, and this region contains the nuclei and most of the inner disk (the ER), S2 with is favoured in our models provided that the gas-to-dust mass ratio is not lower than the standard value of 100. The consistency between the dynamical mass and the mass derived from the dust emission indicates that the ISM dominates the dynamics in these inner regions of Arp 220.
It is worth noting that these models may be applied to the source as a whole, as implicitly assumed above, or alternatively to each one of an ensemble of smaller clouds of radius that do not spatially overlap along the line of sight. The value of determines the absolute scale, and the radial opacity and temperature distribution of each cloud as a function of the normalized radial coordinate, , determine the continuum shape. Identical results are found as long as the above parameters remain constant. Furthermore, both alternatives give identical total masses, but differ in the inferred mean density, which scales as . gives the lowest mean density , which is listed in Table 1. Typical values of a few cm-3 are derived for the nuclei, accounting for the emission from molecules with high dipole moment such as HCN, HCO+, HC3N and CN (see also SYB97). For the ER we obtain cm-3; since HCN and HCO+ appear to show extended low-level emission (Radford et al., 1991b), it is suggested that the actual density is higher than this lower limit or that the gas is clumpy. The low density derived for the ER may also be a consequence of the spherical shape attributed to the ER: if the mass we derive for the ER were concentrated in a thin disk with full thickness of 32 pc (SYB97), the mean H2 density would be cm-3. We will adopt the density given in Table 1, cm-3, in the models for molecules and atoms, but will also explore the results obtained with a density one order of magnitude higher than the quoted value.
Although both scenarios S1 and S2 reproduce the continuum emission from Arp 220 over the 25-1300 m interval and support the constraints on the nuclear sizes derived from the available high angular resolution continuum measurements, the dynamical masses inferred from CO millimeter line observations favour S2 with for the nuclei. Moreover, as we discuss in sections 5.3 and 6.1, the observed line absorption/emission also favours model S2. We thus adopt scenario S2 for the detailed modeling and analysis of the line emission and absorption.
4.1 Extinction
In both scenarios, the high brightness and compactness of the nuclei imply extreme continuum optical depth, corresponding to mag. This conclusion is in strong contrast with the much more moderate values derived from infrared and radio hydrogen recombination lines (Genzel et al., 1998; Anantharamaiah et al., 2000). The high extinction derived here is the direct result of the measured 1.3 mm continuum flux from the nuclei, 210 mJy (Carico et al., 1992; Sakamoto et al., 1999), and the observed upper limit of the corresponding source size, (Sakamoto et al., 1999). These values imply , which shows that even assuming unexpectedly high average dust temperatures (e.g. K) and the dust emission is still optically thick even at 200 m. On the other hand, the radio recombination lines observed by Anantharamaiah et al. (2000) are not affected by dust obscuration, although their predicted fluxes and the derived extinction may be somewhat model dependent. These very different extinction values may be understood if we assume that the observed H recombination lines, tracing primarily star formation, are formed in the outermost regions of the nuclei, while a buried central energy source, responsible for the heating of dust in the innermost regions of the nuclei and a significant fraction of the galactic luminosity, is weak in recombination lines. If weak in recombination lines, the buried energy source is presumably weak in PAH features and PDR lines as well, consistent with the strong [C II] deficit in Arp 220 (see also section 5). Dust-bounded ionized regions, in which most of the Lyman continuum from nuclear starbursts or AGN is absorbed by dust rather than by gas, may explain these properties of Arp 220, as was proposed by Luhman et al. (2003). We further argue that the Lyman continuum luminosities derived from recombination lines do not empirically rule out the possibility that an AGN accounts for more than % of the bolometric luminosity of Arp 220, because of the high dispersion of values shown by both starburst galaxies and AGN, the range of values derived from different tracers in Arp 220, and the uncertainties in the assumed extinction law and the derived extinction (Genzel et al., 1998). Our derived (H2) cm-2 is high enough to obscure a source of high 5–10 keV luminosity from one or both nuclei in Arp 220, so that a hidden AGN is allowed despite the relatively weak X-ray luminosity observed in Arp 220 (Clements et al., 2002). Haas et al. (2001) have also argued that a hidden AGN powers much of the luminosity of Arp 220 on the basis of the observed submillimeter continuum excess relative to the 7.7 m PAH flux.
5 Models for molecules and atoms
5.1 Comparison with Sgr B2
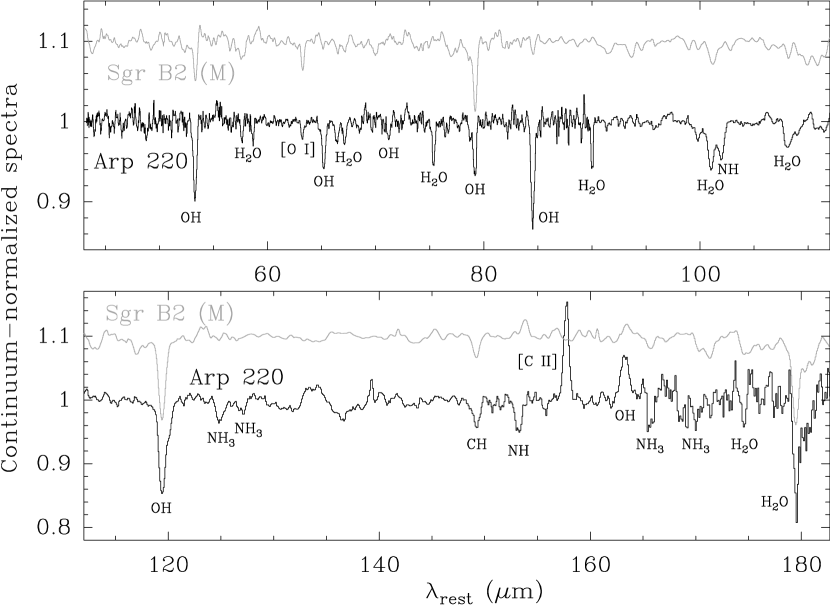
The comparison of the spectrum of Arp 220 with that of some well-studied galactic sources provides important clues about the regions where the observed lines are formed, while emphasizing the unique features that characterize the extragalactic source. In this sense, Sgr B2 (component M) is an ideal comparison source, because it shares common observational properties with Arp 220 despite the obvious differences in spatial scale (and indeed possibly in nature). Figure 6 shows the continuum-normalized spectra of Sgr B2 (M) (kindly provided by J.R. Goicoechea) and Arp 220. Sgr B2 harbors newly born OB stars, ultracompact H II regions, and hot cores, enshrined in a dusty envelope which is heated by shocks and by radiation, and which radiates a high IR luminosity (see GRC04 and references therein). The envelope has the highest extinction in the direction of the N- and M-condensations, with optically thick emission in the far-infrared up to 200 m, and with foreground absorption lines of OH, H2O, CH, and [O I] observed with the ISO/LWS grating (GRC04, Fig. 6). Fabry-Perot observations of Sgr B2 have also allowed the detection of other molecular species like NH, NH3, NH2, HD, H3O+, and C3, as well as high excitation lines of OH and H2O (GRC04 and references therein). As shown above (section 4), the extinction toward the nuclei of Arp 220 is also very high, although the dust is significantly warmer than in the Sgr B2 envelope. The comparison between both sources is meaningful (at least as a first approximation, and from the point of view of the radiative transfer) as long as the nuclear region of Arp 220 can be considered an ensemble of continuum-thick molecular-rich clouds such as Sgr B2. For an ensemble of Sgr B2-like clouds, since both the continuum and the line absorption scale with the number of clouds, the continuum-normalized spectrum is the same as that of one individual cloud. This result applies even if the lines in the ensemble are broadened relative to the one-cloud emission due to cloud-to-cloud velocity dispersion and rotation, provided that the lines remain unresolved with the grating resolution. Thus the differences between the two spectra in Fig. 6 reveal real differences in excitation and/or column densities.
The high-excitation lines of OH and H2O are much stronger in Arp 220 than in Sgr B2 (M) (see Fig. 6). In particular, the OH 65 m line, with strong absorption in Arp 220, is not detected in the grating spectrum of Sgr B2, and the OH 84 m line is also much weaker in Sgr B2 (M). This strongly indicates the presence in Arp 220 of a high excitation region with relatively high OH column densities. The high spectral resolution (35 km s-1) of LWS Fabry-Perot mode observations allowed Goicoechea & Cernicharo (2002) to detect high excitation OH lines in Sgr B2, and showed that they are pumped through absorption of far-infrared photons. In Arp 220 also, these lines appear to be pumped by the strong infrared radiation flux in the neighbourhood of the nuclei (section 5.2). Toward Sgr B2 (M), Goicoechea & Cernicharo (2002) derived (OH) cm-2, and we may expect significantly higher column densities toward the nuclei of Arp 220. The peculiarity of Arp 220 is also revealed by the relatively strong absorptions in the NH3 and NH lines. These species have also been detected toward Sgr B2 (M) with Fabry-Perot spectral resolution (Ceccarelli et al., 2002, GRC04), but Fig. 6 indicates much higher column densities in Arp 220, at least toward the nuclei.
GRC04 found that the OH 163 m line, pumped through absorption of photons in the OH 53.3 m line, shows emission over a large region associated with Sgr B2. In Arp 220 the line is strong, suggesting significant widespread emission, i.e. from the ER. It is also worth noting that, although the [C II] line is not detected in the grating spectrum of Sgr B2 (M), Fabry-Perot observations allowed its detection (Vastel et al., 2002, GRC04), with a flux of W cm-2 for the component observed in emission. This value is, within a factor of 2, similar to strengths in the surrounding region where the continuum is however much weaker (GRC04). Therefore, in addition to effects of self-absorption and absorption of the continuum by C+ in foreground excitation clouds (Vastel et al., 2002, GRC04), the low [C II]/FIR ratio at Sgr B2 (M) is due to a strong increase in the FIR emission that is not accompanied by a corresponding rise of PDR line emission. Dust-bounded ionized regions (Luhman et al., 2003), together with extinction effects in the far-infrared, might account for the lack of PDR line emission associated with this additional infrared component. This is similar to our hypothesis for Arp 220’s nuclei (section 5.6). The [C II] emission in Arp 220 is expected to arise from PDRs in the ER, where the bulk of the PAH emission is found (Soifer et al., 2002). As shown in Fig. 5, the ER dominates the observed far-infrared emission, but since the main heating sources are, according to model S2, the nuclei, the ER is mainly heated via absorption of infrared rather than UV photons, its intrinsic luminosity is relatively low, and hence the [C II] line remains weak (section 5.6).
Finally, we stress that Arp 220 and Sgr B2 (M) show similar strong absorptions in the ground-state lines of OH and H2O, as well as in the CH line at 149 m and in the [O I] at 63 m. Fabry-Perot observations of these lines toward Sgr B2 (M) (Cernicharo et al., 1997; , Stacey et al.1987; Baluteau et al., 1997; Vastel et al., 2002, GRC04), indicate that most of the absorption is produced at velocities from to 30 km s-1 associated with diffuse low-excitation clouds located along the line of sight to Sgr B2 but not physically associated with it. The similar absorptions found in Arp 220 strongly suggest the presence of such a diffuse, absorbing medium. In fact we have found that the combination model of the nuclei and the ER that reasonably reproduces the high excitation OH and H2O lines, fails to explain the strong absorptions in the lowest-lying OH and H2O lines. We suggest that in Arp 220, this diffuse, absorbing component is also responsible for the low ratio of the CO (2-1) line to 1.3mm continuum emission toward the nuclei of Arp 220 (Sakamoto et al., 1999), and for the low brightness of both the CO (1-0) and CO (2-1) lines (SYB97), which indicate line-of-sight blocking of the nuclear CO emission by low-excitation gas (Sakamoto et al., 1999). The above points strongly suggest the presence of an absorbing component in front of the nuclear region in which both the particle density and the infrared radiation density are relatively low. This component could also account for significant absorption of the nuclear continuum emission in scenario S2 if the ER were a thin disk (section 4). We will refer to this diffuse component of Arp 220 as “the halo”.
5.2 Outline of the models
The dust models described in section 4 set up the basis for the molecular calculations. These are carried out with the method described in González-Alfonso & Cernicharo (1997, 1999), which computes the statistical equilibrium populations of a given molecule by assuming spherical symmetry and line broadening caused by microturbulence and/or radial velocity gradients. In the present calculations we have assumed, for simplicity, pure microturbulent line broadening, but some tests showed that the inclusion of a radial velocity gradient hardly modified the results. Rotational motion, which is present around the nuclear region of Arp 220 (e.g. SYB97, Sakamoto et al., 1999; Downes & Solomon, 1998), is not included. Nevertheless, the assumption of spherical symmetry and our neglect of steep velocity gradients that may result from cloud-to-cloud velocity dispersion may be considered more critical.
Our non-local code accounts for radiative trapping in the molecular lines, collisional excitation, and excitation through absorption of photons emitted by dust. The dust parameters derived above for S1 and S2 are used in the calculations for molecules. As in the case of the continuum models, we have modeled the nucleus and the ER separately. This is required, in S2, by the relatively low dust opacities of the ER toward the nucleus as compared with the radial opacity of the ER (see section 4), and involves inevitably an additional uncertainty.
Since the dust in the nucleus is very optically thick throughout the ISO wavelength range, model results are only sensitive to the molecular column densities in the outer parts of the nucleus. It is therefore assumed that only in the outer regions of the nucleus, where the infrared lines are formed, the molecular abundances are different from zero (see Goicoechea & Cernicharo, 2002, for the case of Sgr B2). Since dust and molecules are assumed to be coexistent, extinction effects within the nucleus are implicitly taken into account; they place important constraints on the molecular abundances. We have adopted a molecular shell thickness of cm, which for a mean cm-3 (in S2) corresponds to mag and . For lines around 50 m, the contribution to the absorption by molecules located deeper into the nucleus was checked in some tests to be relatively weak, due to both dust and molecular line optical depth effects. Foreground extinction in S2 was also taken into account. In the models for the ERs, which have much lower continuum opacities, we have assumed that dust and molecules have uniform abundance ratio throughout the whole region. The presence of the central nucleus is included in the calculation of the statistical equilibrium populations, but ignored in the calculation of the emergent fluxes to avoid accounting for it twice.
Toward the nucleus, absorption of continuum radiation determines the excitation of OH and H2O; the radiative rates are much higher than the collisional ones even for very high pressure molecular gas, such as is found in molecular shocks ( cm-3 and K; hereafter we refer to these values as “shock conditions” for brevity). The rate coefficients of Offer, van Hemert, & van Dishoeck (Offer et al.1994) and Green, Maluendes, & McLean (Green et al.1993) were used to check the collisional excitation of OH and H2O, respectively. If widespread shock conditions were present, only the absorption of the lowest-lying lines would be significantly affected. Since we use a halo to match these lines, we cannot distinguish between shock and non-shock conditions (i.e., the line ratios are not sensitive to and within plausible values). For simplicity, physical parameters for the halo are derived by assuming non-shock conditions for the nucleus. Concerning the ER, widespread shock conditions are not applicable because they would involve strong emission in the H2O and lines and in most OH lines (hard to cancel by any halo). Our molecular data are therefore only sensitive to the radial molecular column density and the microturbulent velocity dispersion , so that only these two computational parameters are required to define a model of a given component.
Similar to the dust models, models for molecules may be applied to the source as a whole, or alternatively to each one of an ensemble of smaller clouds that do not spatially overlap along the line of sight. Besides the scaling relationships pointed out above, the molecular column density must remain the same to obtain identical results when varying . On the other hand, once the number of continuum sources is fixed (e.g., ), the same line fluxes are obtained if both and are divided by the same factor , and the resulting fluxes are then multiplied by . The latter reflects the approximate equivalence between one absorbing cloud with column density and velocity dispersion , and clouds, with parameters and , which overlap on the sky but not in the line-of-sight velocity space333In fact the models could be defined in terms of the two independent variables and ; nevertheless we will use the variables and with =1..
Variations in and have different effects on the line absorptions. If decreases the absorptions are weaker for optically thick lines, but due to the increase of line opacities, the high-energy levels become more populated and the above weakness is more pronounced for the low-lying lines. On the other hand, the increase of has little effect on very optically thick lines (most of them low-lying lines), but a larger effect on those with moderate opacities.
We have generated a grid of models for the nucleus and the ER of both S1 and S2, by varying the above free parameters and . In each model, the molecular shell is divided into a set of sub-shells in order to account for the spatial variation of the excitation temperatures of the lines. First we searched for the nucleus+ER combination model that best matches the OH and H2O non-ground-state lines, with the same value of for both species. As pointed out above, the relatively deep absorptions of the OH and H2O ground-state lines could not be fitted satisfactorily by any model, and a halo component was added to match these lines. The halo was assumed to be a purely absorbing shell; although the equilibrium populations were computed in spherical symmetry assuming a size of three times that of the ER, limb emission (i.e. emission for impact parameters that do not cross the continuum source) was ignored in the calculation of the fluxes emergent from the halo.
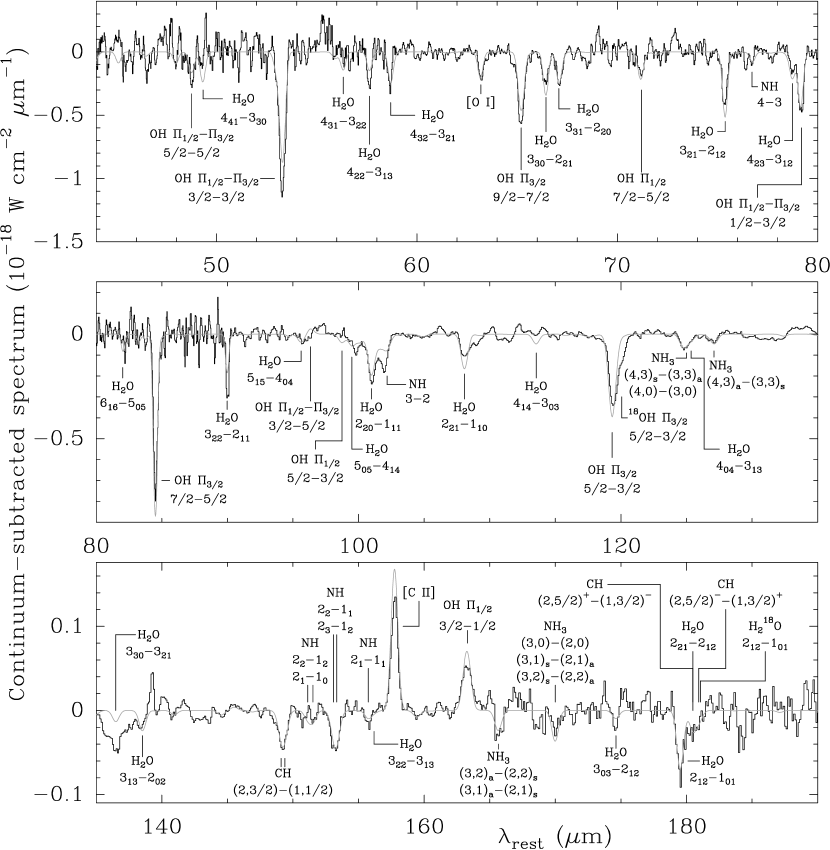
Once the model for OH and H2O is determined, models for the other detected species are performed, also keeping fixed the value of derived above for each component. Figure 7 compares the derived model spectrum and the observed one, and Table 2 lists the inferred parameters. The next sections are devoted to explaining the details of these calculations and results.
5.3 OH and H2O
Our best model fits for the high excitation lines of OH and H2O come from model S2, and the results presented here will focus on this scenario. The main difference between S1 and S2 consists in the higher column densities and/or broader line widths required by S1 to reproduce the lines, owing to the fact that is significantly lower in S1. Models for the nucleus with broad line widths ( km s-1, see below), however, predict strong absorptions in some OH and H2O lines, such as the OH 98 m and the H2O 138 m lines, which are not observed. Therefore S2, which still requires high column densities, is a better fit to the data.
Our best model fits for the high excitation lines involve column densities of cm-2 for both OH and H2O, and km s-1, towards the nucleus. The model for the nucleus reproduces nearly the whole absorption in the OH and lines, most of the OH , and significant absorption in the other lines but by far too weak in the ground-state lines. It also reproduces the full absorptions in the H2O , , , , and lines, and significant absorption in the and others. The somewhat low value derived for is required to keep the absorptions weak in some low excitation lines which are marginally or not detected. Since low implies low velocity coverage for absorption of the continuum, the column densities that are needed to explain the absolute values of the absorptions in high excitation lines are relatively high. We stress that this value of must be interpreted as a strong lower limit on the linewidths that would be observed with high enough spectral resolution, because rotation and cloud-to-cloud velocity dispersion would broaden the observed lines. The CO kinematic models of Arp 220 by SYB97 found a generic value of km s-1; as the authors discuss this value should be considered the joint effect of the local linewidth and the cloud-to-cloud velocity dispersion over a scale of 100 pc. Our is the local linewidth involved in the calculation of opacities and directly related to the molecular excitation, and thus the kinematic value of SYB97 must be considered here an upper limit.
It is worth noting that the above column densities are derived by forcing the OH and H2O high excitation lines to arise in the same region. A slight improvement to the fit of the H2O lines is obtained with even lower , 25 km s-1, and (H2O) cm-2. This may indicate that H2O and OH toward the nucleus do not arise in the same regions. We will adopt in the following the nucleus model with km s-1, corresponding to the spectrum shown in Fig. 7 and the parameters given in Table 2, and estimate an uncertainty of a factor of 3 on the derived column densities.
Once the nuclear component is fit, a search for the combination nucleus+ER that best accounts for the remaining flux in non-ground-state lines is carried out. For densities in the ER, cm-3 (section 4) and , the OH and H2O collisional excitation is found to be negligible in comparison with the radiative excitation. We have also explored the most plausible situation that the OH lines are formed within the C+ region of PDRs (see section 5.6): assuming K (the maximum allowed by the collisional rates of Offer et al.1994) and cm-3, radiative rates still dominate over collisional rates, and results are found indistinguishable from those obtained with lower values. Only densities above cm-3 with K would give results significantly different for the ground-state transitions of OH.
The ER mainly accounts for the OH 163 m line, which is uniquely observed in emission (but predicted in absorption in the nuclei), for more than half of the absorption observed in the OH line, for reemission in the , and for significant absorption in the three ground-state OH lines. We estimate for the ER (OH) cm-2, with km s-1 throughout most of the ER and km s-1 just around the nucleus. This higher value of was required to obtain significant reemission in the non-detected OH line; since here geometrical effects may be important, this result should be considered with caution. For H2O we obtain a significantly lower (H2O) cm-2, giving significant absorption in the , , and lines, and some reemission in the line. Since the halo also yields some absorption in these H2O lines but much deeper absorption in the ground-state one (see below), the relative H2O column density in these components is not well determined.
In the halo, the values of (OH) and were determined by fitting the missing absorption in the three OH ground-state lines. A value of relatively low, 15–20 km s-1, and (OH) cm-2, were found to reasonably fit the fluxes of the 79 and 119 m lines, though the flux of the 53 m line is somewhat underestimated (Fig. 7). Higher values of would predict too much absorption in the already saturated 119 m line. For H2O we find (H2O) cm-2. Owing to the strong radiation field from the nucleus and ER, H2O in the halo is still significantly excited, thus yielding also some absorption in the , and lines.
Despite the generally satisfactory fit obtained for the OH and H2O lines, the shoulder of the OH 119 m line, presumably produced by the 18OH line, is not reproduced. The models assume 16OH/18OH=500; however, the isotopic abundance ratio in Arp 220 required to reasonably fit the 120 m shoulder is as low as 16OH/18OH50. This value cannot be ruled out if 14N is efficiently converted into 18O in nuclear processing of high mass stars, and then efficiently ejected to the interstellar medium through stellar winds and/or supernovae (Henkel & Mauersberger, 1993). Also, there is compelling evidence for isotopic ratios of 150–200 in starburst regions of nearby galaxies (Henkel & Mauersberger, 1993). Due to the low spectral resolution of the spectrum, and the possibility that the feature is contaminated by other species, we do not attempt to place useful constraints on this ratio. Nevertheless, we conclude that a very low 16OH/18OH abundance ratio likely applies to Arp 220, perhaps indicating an advanced stage starburst (Henkel & Mauersberger, 1993).
The model of Fig. 7 predicts an absorbing flux of erg s-1 cm-2 for the line at 34.6 m, in reasonable agreement with the observed flux of erg s-1 cm-2 reported by Skinner et al. (1997). Concerning the OH-megamaser emission at 18 cm, our models are not suitable to account for them. Proper models for the maser emission require inclusion of the hyperfine splitting, treatment of far-infrared line overlaps, as well as a study of the influence of the velocity field (e.g. Randell et al., 1995), which are not considered here. The OH-megamaser emission may be radiatively pumped through absorption of photons in the 34.6 m and 53.3 m lines, followed by radiative cascade to lower levels. Since the lower level of the 34.6 m transition is the ground-state level, we have found that about 65% of the modeled absorption is predicted to occur in the foreground halo, rather than in the nuclei. As a consequence, the pump efficiency that would be required in our model to explain the 1.667 GHz OH-megamaser line via the 34.6 m line alone is higher than the value of % derived by Skinner et al. (1997). Nevertheless, given the uncertainty in the derived nuclear OH column density, the possibility that some of the maser emission arises in the most central regions, and the expected additional contribution to the pumping by the 53.3 m line (Burdyuzha & Vikulov, 1990), we conclude that our models are roughly consistent with the OH-megamaser excitation scheme discussed by Skinner et al. (1997).
5.4 CH
Since CH is close to the Hund’s coupling case (b) limit in its ground state (e.g. Brown & Evenson, 1983), we denote its levels through (, ), where is the case (b) rotational quantum number and . We assume that the (2,3/2)–(1,1/2) CH line we observe at 149.2 m arises in the halo, based on the results obtained toward the Galactic Center (see GRC04). We derive (CH) cm-2 by fitting the feature. Unlike the case of Sgr B2, however, the submillimeter emission from the nuclear region of Arp 220 is strong enough to populate significantly the (1,3/2) level via absorption of photons in the (1,3/2)–(1,1/2) line at 560 m, so that our models for the halo predict some contribution by CH (2,5/2)–(1,3/2) to the absorption feature at 181 m (Fig. 7). The latter is uncertain, however, because the feature at 181 m could be contaminated by H3O+ (GRC04) and/or by stronger absorption of HO, whose abundance relative to HO could be enhanced relative to the assumed value of 1/500. On the other hand, there is a wing-like feature at 118.5 m, observed in both the forward and reverse scans, which could be caused by the doublet CH (3,7/2)–(2,5/2). If so, and since the excitation of this line requires a relatively strong radiation field, there would be CH in the nuclei that would account for about 1/3 of the absorption at 149.2 m, and the CH column density in the halo would be 2/3 of the quoted value.
5.5 NH and NH3
In contrast with OH and CH, most of the column density of NH and NH3 we model is contained within the nuclei. Assuming that the 153.2 m absorption feature is caused entirely by NH, we have obtained (NH) cm-2 toward the nucleus. The model reproduces the marginal absorption feature at 76.8 m, attributable to the lines. For the above column density, the and lines at 153.2 m become saturated and the associated feature is not completely reproduced, so that we have added an additional halo component with (NH) cm-2 (Table 2). Nevertheless, this model still underestimates the absorption at 102 m, strongly suggesting the contribution from other species (section 3).
Within a given ladder, the excitation of the NH3 non-metastable levels is determined by absorption of far-infrared continuum photons, while the metastable levels in are populated through collisions (see e.g. Ceccarelli et al., 2002, for the case of Sgr B2). In the model of Fig. 7 we have assumed an average density of cm-3 and K, but we have checked that the model results are insensitive to the adopted because of the blending of lines from different ladders to each spectral feature in our spectrum (Fig. 1). We obtain (NH3) cm-2 toward the nucleus to fit the absorptions at 125 and 127 m (Fig. 7). Besides the absorption in the lines showed in Fig. 4, the model predicts significant absorption at 100 m and 101.6 m, caused by lines, which is still insufficient to account for the observed absorption around 101.6 m. The model also fails to explain the strong absorption at 166 m, and therefore an halo component with (NH3) cm-2 has been added to the global model of Fig. 7. Nevertheless, the halo components of NH and NH3 should be considered uncertain, because variations in the background continuum associated with each component could in principle account for the missing flux in the lines.
Finally, we have explored the possibility that the NH2 radical contributes to the spectrum at some wavelengths. The expected strongest absorption from NH2 is found at 159.5 m, caused by the strongest components of the ortho line (the hyperfine structure was neglected in these calculations, but the split of the levels due to the unpaired electronic spin of 1/2 was taken into account). At this wavelength, a marginal absorption feature may be attributed to NH2, and is approximately fit with a model for the nucleus where (NH2) cm-2. We have included this model of NH2 in Fig. 7 to show that the expected absorption in other lines, like the one at 105 m, do not conflict with the observations, and we conclude that (NH2) cm-2.
5.6 C II and O I
A crucial test of our model is whether it can reproduce the [C II] 157.7 m emission and [O I] 63.3 m absorption lines. Among ULIRGs, Arp 220 shows one of the most extreme [C II] deficits (, Luhman et al., 2003). The [C II] line is formed within 2 mag from the surfaces of PDRs (e.g. Wolfire, Tielens, & Hollenbach, Wolfire et al.1990), where the UV field from nearby high mass stars, or from the average galactic field has not been significantly attenuated. In this region, photodissociation maintains most of the gas in atomic or singly ionized form, but some radicals, like OH and NH, find their maximum abundances there (Sternberg & Dalgarno, 1995). In particular, OH is expected to be an excellent molecular tracer of PDRs’ surfaces, given that its abundance is rather low in UV-shielded quiescent molecular clouds. Its abundance relative to H nuclei within the C+ region of dense PDRs is expected to approach the value of (Sternberg & Dalgarno, 1995). In fact, Goicoechea & Cernicharo (2002) have found an abundance of in Sgr B2, and it could be as high as around the galactic center (Genzel et al., 1985). We have estimated (OH) toward the nucleus of Arp 220.
On the above grounds, and adopting a gas phase carbon abundance of (Savage & Sembach, 1996), we assumed (C+)/(OH)=100 in Arp 220 (Table 2), and we computed the expected [C II] line emission by assuming excitation through collisions with atomic H (Tielens & Hollenbach, 1985). The collisional rates were taken from Launay & Roueff (1977a). The H densities were assumed to be twice the H2 densities derived from the continuum models, i.e. cm-3 in the nucleus and cm-3 in the ER. Since the critical density is cm-3 (Kaufman et al., 1999), results for the nucleus are not critically dependent on the assumed density. They are also insensitive to the assumed temperature as long as it is higher than 100 K (, Wolfire et al.1990). Thus our results are only sensitive to the assumed density in the ER, and to the assumed C+ abundance.
The result of this calculation has also been added to the overall model of Fig. 7 ( K has been assumed). The model overestimates the observed [C II] emission by only 24%. The contribution from the nucleus is only 13% of that from the ER because of the low volume of the nuclear emitting region. The expected line flux from the nucleus could be lower if absorption of the underlying continuum by low-excitation C+ in the halo, ignored in this model, occurs as observed in Sgr B2 (M) (GRC04). The bulk of the line emission arises from the ER. If the density of the ER were one order of magnitude higher than assumed (section 4), the modeled [C II] emission would be a factor of stronger than in Fig. 7. The situation in Arp 220 resembles what is found in Sgr B2 (GRC04), where the line is emitted mainly from an extended region around condensations N and M, while the strong FIR source itself is not associated with corresponding observable [C II] line emission.
The [O I] 63.3 m line has been modeled by assuming (O I)/(OH)=250 (Table 2); although the oxygen abundance is expected to be twice that of C+ in the atomic region, it is expected that further atomic oxygen exists deeper into the clouds (Sternberg & Dalgarno, 1995). For this reason, a wide range of excitation temperatures is expected for the [O I] line. We have just fitted a single “effective” kinetic temperature and assumed also collisions with atomic H. The same densities as assumed above for C+ excitation are used for O I, and the collisional rates are taken from Launay & Roueff (1977b).
Our calculations show that absorption in the [O I] 63.3 m line is obtained, both toward the nucleus and the ER, with an effective K, but the line is still too weak to account for the observed feature. Given the high O I abundances that are expected in diffuse clouds (Baluteau et al., 1997), we have added to the model a halo component with (O I) cm-2 (Table 2). This model accounts for the observed absorption at 63.3 m (Fig. 7).
On the basis of the low extinction derived from infrared and radio H recombination lines and the high optical depth derived from our dust models (section 4.1), and the assumption that [C II] emission is expected to suffer extinction similar to that of the recombination line emission, we favor the explanation proposed by Luhman et al. (2003, see also section 5.1) that non-PDR far-infrared emission is responsible for the [C II] deficit in Arp 220. Nevertheless, our continuum models by themselves (section 4) cannot rule out the possible role of far-infrared extinction on the measured line fluxes: the derived high nuclear far-infrared opacities indicate that only the outer regions of the nuclei, where the OH and H2O lines are formed, and the ER, are able to contribute to the [C II] line emission. Our model fits cannot discern whether the intrinsic nuclear [C II] emission is negligible or rather is obscured by dust. In either case, we have shown that the [C II] line is well reproduced by assuming that C+ and OH are coexistent.
6 Discussion
6.1 The Extended Region (“ER”)
Our models support the widespread presence of PDRs in the ER. Both the high OH and C II column densities indicate that the UV field from newly formed stars have a profound effect on the chemistry in the ER. Significant contributions from shocks can be neglected, as was pointed out in section 5.2. The H2O-to-OH abundance ratio is significantly lower than 1, probably indicating enhanced H2O photodissociation. As pointed out in section 4, the density is uncertain, but thought to be in the range cm-3.
Our models also indicate that the bulk of the [C II] line emission arises in the ER. It is therefore likely that star formation is responsible for this emission. This result is strongly supported by the observations of Soifer et al. (2002), who found that the PAH emission is also spatially extended. Assuming a “normal” [C II]/FIR ratio, i.e. (Stacey et al., 1991), the expected intrinsic FIR emission from the ER is L⊙, i.e. 3% of the total galactic luminosity. This estimate supports the scenario S2 that has been used to model the line emission. According to our models, the total FIR luminosity (due to absorption and re-emission of nuclear infrared radiation) from the ER is much higher than the intrinsic (PDR) emission. Our estimate of the intrinsic ER luminosity is somewhat lower than that derived by Soifer et al. (2002) and Spoon et al. (2004), who found a lower limit of L⊙, but confirms qualitatively their results. The starburst luminosity in the ER seems to be similar to that of moderately bright infrared galaxies, like NGC 253 (Radovich, Kahanpää, & Lemke, Radovich et al.2001).
The warm mass in the ER derived from our OH models is M⊙, assuming (OH)= relative to H nuclei and the warm H2 arising from the same volume as the OH. This estimate of mass may be considered an upper limit. From the H2 rotational lines detected by ISO, Sturm et al. (1996) estimated M⊙ of warm gas. Given the uncertain correction by extinction, it is likely that an important fraction of the H2 emission arises in the ER.
6.2 The halo
The models also indicate the presence of a halo. Despite the uncertainties in the column densities of this component, they are typical of those found toward our galactic nucleus: (H2O, OH) cm-2 have been also derived in the diffuse medium toward Sgr B2 (Cernicharo et al., 1997; Neufeld et al., 2003; Goicoechea & Cernicharo, 2002), and the derived (CH) cm-2 is also similar to that found toward Sgr B2 by GRC04 and (Stacey et al.1987). The column densities in the halo derived for NH and NH3 are uncertain because they are based on single lines, but they could also exist in a population of molecular clouds located far away from the nuclear region. Assuming (H2O) in the halo (Neufeld et al., 2000), cm-2 is obtained and the associated continuum opacity is . If we further assume a spectral index , the derived dust opacity at 25 m is , comparable to the value of 1.2 in scenario S2 (section 4). Therefore, significant absorption of the nuclear continuum emission is attributable to the halo.
6.3 The nuclei
The similarity of the OH column densities in the ER and the nucleus may suggest that, at least to some extent, we are observing the same widespread OH component, and that OH is more excited toward the nucleus because of the underlying stronger infrared continuum in that direction. On this ground a PDR origin of the observed OH would be favoured. However, the inferred high H2O column density would be difficult to explain in this context. Although H2O is expected to form efficiently in UV-shielded regions of dense PDRs (Sternberg & Dalgarno, 1995), with total column densities similar to those of OH, there seems to be no clear correlation between (OH) and (H2O). In fact, the H2O column density in the ER is significantly lower than that of OH. Also, detection of NH3 and, above all, of NH, seem to indicate an additional nuclear component.
OH could also arise in C-shocks (Watson et al., 1985), but it is unlikely that they dominate the OH absorptions because (H2O) would then be at least one order of magnitude higher than (OH). However, an interesting possibility is that those C-shocks, or alternatively hot core regions, are combined with PDRs, i.e., H2O produced there is subject to a strong UV field and thus to photodissociation. This process may be enhanced if there is hot gas emitting X-rays, like in supernova remnants where the OH abundance is expected to be (Wardle, 1999), or from a nuclear AGN. In the nuclei of Arp 220, several compact 18 cm continuum sources indicate the presence of high luminous supernovae (Smith et al., 1998); however, the extended and external OH required to explain the infrared data suggests a more widespread component. The diffuse OH megamaser emission found in Arp 220 should be related to it (Lonsdale et al., 1998). Soft-extended and hard-compact X-ray emission, detected around and from the nuclei (Clements et al., 2002), could be responsible for photodissociation of H2O produced in shocks and hot cores, thus enhancing the OH abundance. In particular, hot cores are expected to exist widely in the nuclei, given the high dust temperatures and densities found there. The presence of J-shocks, where (OH) is expected to be higher than (H2O) except for high enough preshock densities (Neufeld & Dalgarno, 1989), cannot be disregarded.
The high column densities obtained for NH and NH3 seem to indicate that standard gas-phase PDR chemistry alone is not able to explain the full molecular data in Arp 220. Sternberg & Dalgarno (1995) predicted for a PDR an NH column density more than two orders of magnitude lower than that of OH, whereas we estimate (OH)/(NH)20 in Arp 220. The enhancement of NH relative to OH may be more than one order of magnitude. In Sgr B2, GRC04 also found a somewhat high (NH) relative to OH, i.e. (OH)/(NH)30–100. It is interesting that the high NH abundance in diffuse clouds is a factor of higher than predicted by gas-phase chemical models (Meyer & Roth, 1991). The latter has been used by Wagenblast et al. (1993) and Crawford & Williams (1997) to argue for grain-surface production of NH. In principle, this process could also help to enhance the NH abundance in Arp 220, because the dust in the nuclei has been found to be warm so that grain mantles could efficiently evaporate, and also because in an enviroment with enhanced cosmic rays, as expected from a starburst and the consequent high rates of supernovae, or an AGN, the release of grain mantles to the gas phase by means of sputtering should be also enhanced. However, hydrogenation of NH should in principle continue until saturation, because indeed we observe NH3 with a column density twice of NH. The issue that now arises is that, if hydrogenation generally completes, then a very low NH-to-NH3 abundance ratio would be expected, and if it does not complete like in the models of Wagenblast et al. (1993), the scenario fails because of the low relative abundance found for NH2. In Sgr B2, for example, NH:NH2:NH3=1:10:100 (GRC04), and NH2 is found to be fairly abundant (van Dishoeck et al., 1993).
One possible solution for the low NH2 abundance is that the already invoked enhancement of cosmic rays deeply affects the ion-molecule gas-phase chemistry. Federman, Weber, & Lambert (Federman et al.1996) have shown that the high NH abundance found in some diffuse galactic enviroments could be explained through cosmic ray ionization of atomic nitrogen, followed by hydrogen abstraction reactions that form NH and dissociative recombination that yields NH. The slight endothermicity of N++H2NH++H (Millar, Farquhar, & Willacy, Millar et al.1997) is not a problem here, given the high dust temperatures in the nuclei. If in Arp 220 the cosmic-ray ionization of N is enhanced, the above scheme could give rise to high NH abundances. Furthermore, both NH2 and NH3 would be much less abundant if photodissociation is important in those regions. NH3 would be formed primarily in grain mantles through nearly complete hydrogenation, thus again keeping the NH2 abundance low, and released to the gas phase in widespread hot core regions relatively shielded from UV fields. H2O could also follow this last process.
A chemistry deeply influenced by ion-neutral reactions have been also invoked by Aalto et al. (2002) to explain the high emission from HNC relative to HCN in Arp 220 and other luminous infrared galaxies. Furthermore, Aalto et al. (2002) also found strong subthermal CN emission, indicative of gas at moderate densities and irradiated by UV fields (Rodríguez-Franco, Martín-Pintado, & Fuente, 1998). In the simplest scenario, the molecular content of Arp 220 may thus be interpreted in terms of hot cores submitted to strong UV and X-ray fields, where enhanced evaporation of grain mantles and ion-molecule chemistry induced by cosmic ray ionization are also deeply affecting the relative molecular abundances.
7 Summary
Due to its high signal-to-noise, the rich far-infrared spectrum of Arp 220
provides a template for understanding the dusty interstellar medium of
ULIRGs. We have analyzed the ISO/LWS spectrum of Arp 220 using radiative
transfer models applied to both the continuum and line emission. Our main
results are:
1. The continuum emission from 25 to 1300 m is well reproduced
with a two-component model: (a) the nuclei, with effective size of
and dust temperature of 106 K, which accounts for essentially the whole
flux at 25 m and at millimeter and submillimeter wavelengths, and
(b) an extended region (ER), whose effective size is
and which dominates the continuum emission from 60 to 250 m.
2. The extinction toward the nuclei is very high
( mag); the dust in the ER is heated through absorption of
radiation emanating from the nuclei.
3. The spectrum of Arp 220 shows molecular lines of OH, H2O, CH, NH, and NH3,
as well as the atomic [O I] 63 m line in absorption and the [C II] 158
m line in emission. The outermost
regions of the nuclei, along with the ER, are traced by the lines observed in
the far-infrared.
4. The high excitation lines of OH and H2O are pumped through absorption
of photons emitted by dust. Column densities of (OH)
cm-2 and (H2O) cm-2 are derived toward the nuclei.
In the ER, (OH) cm-2 and (H2O)
cm-2. We found it necessary to invoke a third component, or halo, to match
the low-lying lines of OH and H2O; this halo has column densities that are
similar to those found toward the Galactic Center
((OH, H2O) cm-2).
5. The CH line detected in the far-infrared spectrum of Arp 220 is assumed
to arise from the halo, and the inferred column density is
(CH) cm-2. This value is also similar to that found
toward the Galactic Center.
6. Models for NH and NH3 indicate high column densities toward the nuclei,
(NH) cm-2 and (NH3) cm-2.
The upper limit found for the column density of NH2 is much lower,
(NH2) cm-2.
7. The [C II] 158 m line strength is approximately reproduced by assuming
that C+ is 100 times more abundant than OH. Our
models predict that the line arises mainly from the ER, and that
non-PDR far-infrared emission, with possible extinction effects,
is mostly responsible for the observed [C II] deficit in
Arp 220. The [O I] 63 m line is also matched with an abundance of 250
relative to OH and absorption toward the nuclei, the ER, and the halo.
8. PDR molecular chemistry plays a key role in the ER and contributes to
the elevated OH abundance at the expense of H2O.
Toward the nuclei, however, important contributions from hot cores, and
possibly from shocks, is most plausible.
The nitrogen chemistry, and in particular the high NH
abundance, seems to be strongly influenced by ion-neutral reactions triggered
by cosmic ray ionization.
References
- Aalto et al. (2002) Aalto, S., Polatidis, A.G., Hüttemeister, S., & Curran S.J. 2002, A&A, 381, 783
- Anantharamaiah et al. (2000) Anantharamaiah, K.R., Viallefond, F., Mohan, N.R., Goss, W.M., & Zhao, J.H. 2000, ApJ, 537, 613
- Baluteau et al. (1997) Baluteau, J.-P. et al. 1997, A&A, 322, L33
- Brown & Evenson (1983) Brown, J.M., & Evenson, K.M. 1983, ApJ, 268, L51
- Burdyuzha & Vikulov (1990) Burdyuzha, V.V., & Vikulov, K.A. 1990, MNRAS, 244, 86
- Carico et al. (1992) Carico, D.P., Keen, J., Soifer, B.T., & Neugebauer, G. 1992, PASP, 104, 1086
- Ceccarelli et al. (2002) Ceccarelli, C., et al. 2002, A&A, 383, 603
- Cernicharo et al. (1997) Cernicharo, J., et al. 1997, A&A, 323, L25
- Cernicharo et al. (1999) Cernicharo, J., Pardo, J.R., González-Alfonso, E., Serabyn, E., Phillips, T.G., Benford, D.J., Mehringer, D. 1999, ApJ, 520, L131
- Cernicharo et al. (2000) Cernicharo J., Goicoechea J.R., & Caux, E. 2000, ApJ, 534, L199
- Clegg et al. (1996) Clegg, P.E., et al. 1996, A&A, 315, L38
- Clements et al. (2002) Clements, D.L., McDowell, J.C., Shaked, S., Baker, A.C., Borne, K., Colina, L., Lamb, S.A., & Mundell, C. 2002, ApJ, 581, 974
- Crawford & Williams (1997) Crawford, I.A., & Williams, D.A. 1997, MNRAS, 291, L53
- Downes & Solomon (1998) Downes, D., & Solomon, P.M. 1998, ApJ, 507, 615
- (15) Eales, S.A., Wynn-Williams, C.G., & Duncan, W.D. 1989, ApJ, 339, 859
- Eckart & Downes (2001) Eckart, A., & Downes, D. 2001, ApJ, 551, 730
- (17) Federman, S.R., Weber, J., & Lambert, D., 1996, ApJ, 463, 181
- Fischer et al. (1997) Fischer, J., et al. 1997, in “The first ISO workshop on analytical spectroscopy”, eds. Heras, A., Leech, K., Trams, N., & Perry, M., Noordwijk: ESA Publication SP-419, p. 149
- Fischer et al. (1999) Fischer, J., et al. 1999, Ap&SS, 266, 91
- Genzel et al. (1985) Genzel, R., Watson, D.M., Crawford, M.K., & Townes, C.H. 1985, ApJ, 297, 766
- Genzel et al. (1998) Genzel, R., et al. 1998, ApJ, 498, 579
- Goicoechea & Cernicharo (2002) Goicoechea, J.R., & Cernicharo, J., 2002, ApJ, 576, L77
- Goicoechea et al. (2004) Goicoechea, J.R., Rodríguez-Fernández, N.J., & Cernicharo, J. 2004, ApJ, 600, 214 (GRC04)
- González-Alfonso & Cernicharo (1997) González-Alfonso, E., & Cernicharo, J. 1997, A&A, 322, 938
- González-Alfonso & Cernicharo (1999) González-Alfonso, E., & Cernicharo, J. 1999, ApJ, 525, 845
- Graham et al. (1990) Graham, J.R., Carico, D.P., Matthews, K., Neugebauer, G., Soifer, B.T., & Wilson, T.D. 1990, ApJ, 354, L5
- (27) Green, S., Maluendes, S., & McLean, A. D. 1993, ApJS, 85, 181
- Haas et al. (2001) Haas, M., Klaas, U., Müller, S.A.H., Chini, R., & Coulson, I. 2001, A&A, 367, L9
- Harvey et al. (1999) Harvey, V.I. et al. 1999, in ”The Universe as Seen by ISO”, ed. P. Cox & M. F. Kessler (Noordwijk: ESA Publication SP-427), 889
- Henkel & Mauersberger (1993) Henkel, C., & Mauersberger, R. 1993, A&A, 274, 730
- Hildebrand (1983) Hildebrand, R.H. 1983, QJRAS, 24, 267
- Kaufman et al. (1999) Kaufman, M.J., Wolfire, M.G., Hollenbach, D.J., & Luhman, M.L. 1999, ApJ, 527, 795
- Kegel, Hertenstein, & Quirrenbach (1999) Kegel, W.H., Hertenstein, T., & Quirrenbach, A. 1999, A&A, 351, 472
- Kessler et al. (1996) Kessler, M.F., et al. 1996, A&A, 315, L27
- Launay & Roueff (1977a) Launay, J.-M., & Roueff, E. 1977, J. Phys. B, 10, 879
- Launay & Roueff (1977b) Launay, J.-M., & Roueff, E. 1977, A&A, 56, 289
- Lonsdale et al. (1998) Lonsdale, C.J., Diamond, P.J., Smith, H.E., & Lonsdale, C.J. 1998, ApJ, 493, L13
- Luhman et al. (1998) Luhman, M.L., et al. 1998, ApJ, 504, L11
- Luhman et al. (2003) Luhman, M.L., Satyapal, S., Fischer, J., Wolfire, M.G., Sturm, E., Dudley, C.C., Lutz, D., & Genzel, R. 2003, ApJ, 594, 758
- Malhotra et al. (2001) Malhotra, S., et al. 2001, ApJ, 561, 766
- Meyer & Roth (1991) Meyer, D.M., & Roth, K.C. 1991, ApJ, 376, L49
- (42) Millar, T.J., Farquhar, P.R.A., & Willacy, K. 1997, A&AS, 121, 139
- Neufeld & Dalgarno (1989) Neufeld, D.A., & Dalgarno, A. 1989, ApJ, 340, 869
- Neufeld et al. (2000) Neufeld, D.A., et al. 2000, ApJ, 539, L111
- Neufeld et al. (2003) Neufeld, D.A., Bergin, E.A., Melnick, G.J., & Goldsmith, P.F. 2003, ApJ, 590, 882
- (46) Offer, A.R., van Hemert, M.C., & van Dishoeck, E.F. 1994, J. Chem. Phys., 100, 362
- Okumura et al. (1994) Okumura, S.K., Kawabe, R., Ishiguro, M., Ishizuki, S. 1994, in “Astronomy with Millimeter and Submillimeter Wave Interferometry”, IAU Colloquium 140, ASP Conference Series, Eds. M. Ishiguro and J. Welch, 59, 376
- (48) Radford, S.J.E., Solomon, P.M., & Downes, D. 1991, ApJ, 368, L15
- Radford et al. (1991b) Radford, S.J.E., et al. 1991, in “Dynamics of Galaxies and Their Molecular Cloud Distributions”, eds. F. Combes & F. Casoli, IAU, Netherlands
- (50) Radovich, M., Kahanpää, J., & Lemke, D. 2001, A&A, 377, 73
- Randell et al. (1995) Randell, J., Field, D., Jones, K.N., Yates, J.A., & Gray, M.D. 1995, A&A, 300, 659
- (52) Rigopoulou, D., Lawrence, A., & Rowan-Robinson, M. 1996, MNRAS, 278, 1049
- Rodríguez-Franco et al. (1998) Rodríguez-Franco, A., Martín-Pintado, J., & Fuente, A. 1998, A&A, 329, 1097
- Sakamoto et al. (1999) Sakamoto, K., Scoville, N.Z., Yun, M.S., Crosas, M., Genzel, R., & Tacconi, L.J. 1999, ApJ, 514, 68
- Savage & Sembach (1996) Savage, B.D., & Sembach, K.R. 1996, ARA&A, 34, 279
- Scoville et al. (1991) Scoville, N.Z., Sargent, A.I., Sanders, D.B., Soifer, B.T. 1991, ApJ, 366, L5
- (57) Scoville, N.Z., Yun, M.S., & Bryant, P.M. 1997, ApJ, 484, 702 (SYB97)
- Skinner et al. (1997) Skinner, C.J., Smith, H.A., Sturm, E., Barlow, M.J., Cohen, R.J., Stacey, G.J. 1997, Nature, 386, 472
- Smith et al. (1998) Smith, H.E., Lonsdale, C.J., Lonsdale, C.J., & Diamond, P.J. 1998, ApJ, 493, L17
- Soifer et al. (1999) Soifer, B.T., Neugebauer, G., Matthews, K., Becklin, E.E., Ressler, M., Werner, M.W., Weinberger, A.J., & Egami, E. 1999, ApJ, 513, 207 (S99)
- Soifer et al. (2002) Soifer, B.T., Neugebauer, G., Matthews, K., Egami, E., & Weinberger, A.J. 2002, A.J., 124, 2980
- (62) Solomon, P.M., Radford, S.J.E., & Downes, D. 1990, ApJ, 348, L53
- (63) Solomon, P.M., Downes, D., & Radford, S.J.E. 1992, ApJ, 387, L55
- Spoon et al. (2004) Spoon, H.W.W., Moorwood, A.F.M., Lutz, D., Tielens, A.G.G.M., Siebenmorgen, R., & Keane, J.V., 2004, A&A, 414, 873
- (65) Stacey, G.J., Lugten, J.B., & Genzel, R. 1987, ApJ, 313, 859
- Stacey et al. (1991) Stacey, G.J., Geis, N., Genzel, R., Lugten, J.B., Poglitsch, A., Sternberg, A., & Townes, C.H. 1991, ApJ, 373, 423
- Sternberg & Dalgarno (1995) Sternberg, A., & Dalgarno, A., 1995, ApJS, 99, 565
- Sturm et al. (1996) Sturm, E., et al. 1996, A&A, 315, L133
- Sturm et al. (1998) Sturm, E., et al. 1998, in ASP Conf. Ser. 145, Astronomical Data Analysis Software and Systems VII, ed. R. Albrecht, R. N. Hook, & H. A. Bushouse (San Francisco: ASP), 161
- Tielens & Hollenbach (1985) Tielens, A.G.G.M., & Hollenbach, D., ApJ, 291, 722
- van Dishoeck et al. (1993) van Dishoeck, E.F., Jansen, D.J., Schilke, P., & Phillips, T.G., 1993, ApJ, 416, L83
- Vastel et al. (2002) Vastel, C., Polehampton, E.T., Baluteau, J.-P., Swinyard, B.M., Caux, E., & Cox, P. 2002, ApJ, 581, 315
- Wagenblast et al. (1993) Wagenblast, R., Williams, D.A., Millar, T.J., & Nejad, L.A.M. 1993, MNRAS, 260, 420
- Wardle (1999) Wardle, M. 1999, ApJ, 525, L101
- Watson et al. (1985) Watson, D.M., Genzel, R., Townes, C.H., & Storey, J.W.V. 1985, ApJ, 298, 316
- (76) Wolfire, M.G., Tielens, A.G.G.M., & Hollenbach, D. 1991, ApJ, 358, 116

| Scenario | Component | aaAssuming a single source instead of an ensemble of clouds | |||||||
|---|---|---|---|---|---|---|---|---|---|
| (24.5 m) | (pc) | (K) | (m) | (M⊙) | (cm-3) | (L⊙) | |||
| S1 | Nucleus | 0 | 145 | 1.5 | 85 | 640 | |||
| 2.0 | 85 | 770 | |||||||
| S1 | ER | 0 | 630 | 2.0 | 50 | 110 | |||
| S2 | Nucleus | 1.2 | 145 | 1.5 | 106 | 520 | |||
| 2.0 | 106 | 650 | |||||||
| S2 | ER | 0 | 660 | 2.0 | 40-90bbThe temperature is calculated throughout the ER from the balance between heating and cooling with the nucleus as the primary heating source | 82 |
| Species | Nucleus | ER | Halo |
|---|---|---|---|
| OH | |||
| H2O | |||
| CH | – | – | |
| NH | – | ||
| NH3 | – | ||
| C+ | – | ||
| O |