The Effect of Hot Gas in WMAP’s First Year Data
Abstract
By cross-correlating templates constructed from the 2 Micron All Sky Survey (2MASS) Extended Source (XSC) catalogue with WMAP’s first year data, we search for the thermal Sunyaev-Zel’dovich signature induced by hot gas in the local Universe. Assuming that galaxies trace the distribution of hot gas, we select regions on the sky with the largest projected density of galaxies. Under conservative assumptions on the amplitude of foreground residuals, we find a temperature decrement of -35 7 K ( detection level, the highest reported so far) in the 26 square degrees of the sky containing the largest number of galaxies per solid angle. We show that most of the reported signal is caused by known galaxy clusters which, when convolved with the average beam of the WMAP W band channel, subtend a typical angular size of 20–30 arcmins. Finally, after removing from our analyses all pixels associated with known optical and X-ray galaxy clusters, we still find a tSZ decrement of -96 37 K in pixels subtending about 0.8 square degrees on the sky. Most of this signal is coming from five different cluster candidates in the Zone of Avoidance (ZoA), present in the Clusters In the ZoA (CIZA) catalogue. We found no evidence that structures less bound than clusters contribute to the tSZ signal present in the WMAP data.
1 Introduction
The study of the Cosmic Microwave Background (CMB) has become a powerful cosmological tool with applications in various astrophysical scenarios. Recently, the WMAP team has determined the main cosmological parameters from the CMB temperature field with unprecedented accuracy (Spergel et al., 2003). This temperature field is composed of primordial anisotropies, generated at the Last Scattering Surface, and secondary fluctuations, which arise as the CMB photons travel to the observer. Among these secondary anisotropies, we shall concentrate on the so called thermal Sunyaev-Zel’dovich effect (hereafter tSZ, Sunyaev & Zeldovich (1980)), associated with the distortion of the black body spectrum of the CMB photons due to Compton scattering on fast moving thermal electrons. This spectral distortion is independent of redshift and proportional to the integrated electron pressure along the line of sight. It has been detected in the direction of several galaxy clusters (Carlstrom et al., 2002). This makes the tSZ effect an useful tool for the detection of ionized hot gas.
Recently, Fukugita & Peebles (2004) have argued that about 90% of all baryons are in the form of intergalactic plasma, not dense and hot enough to be detectable as X-ray sources except in clusters and groups of galaxies. At low redshfits, 30% of all baryons could be in the form of Ly- absorbers (Penton, Stocke & Shull, 2004), but a large fraction of them has not yet been accounted for observationally. Most models of structure formation predict baryons to be located in filaments and sheets, associated to galaxy overdensities (Springel, White, & Hernsquist, 2001). Kull & Böhringer (1999) show evidence of filamentary X-ray emission at the core of the Shapley Supercluster, whereas Zappacosta et al. (2002) report a detection of diffuse X-ray emission by warm gas (K) associated with an overdense galaxy region. The aim of this letter is to use the tSZ effect to detect directly the diffuse warm baryon component in the local Universe. The analyses of the first year WMAP data have indicated that a small contribution due to the tSZ induced by clusters is present in the data (Bennett et al. (2003), Hernández-Monteagudo & Rubiño-Martín (2004)). Fosalba, Gaztañaga & Castander (2003) and Afshordi, Loh, & Strauss (2004) claimed a tSZ detection at small angular scales but did not clarify the nature of the astrophysical sources associated with it. Myers et al. (2004) analysed the angular extension of the tSZ signal in the W band of WMAP by examining the CMB map in the direction of the largest galaxy groups and clusters found in the catalogues of Abell, Corwin & Olowin (1989) (hereafter ACO), Dalton et al. (1997) (hereafter APM) and the 2 Micron All Sky Survey Extended Source Catalogue, (Jarrett et al., 2003). Their analyses showed evidence for diffuse tSZ emission up to an angular scale of , which implied a baryon fraction larger than the WMAP estimate.
If baryons are distributed like the dark matter on scales comparable to the virial radius of galaxies (Fukugita & Peebles, 2004), the projected density of galaxies on the sky will correlate with the tSZ signal, independently of whether galaxies form clusters, groups or filaments. In this letter, we shall carry out a pixel-to-pixel comparison of WMAP W band data with templates constructed from the 2MASS galaxy catalogue, to test the distribution of hot gas in the local Universe. In Sec.2 we describe the pixel to pixel comparison method employed to estimate the tSZ signal and the data used in the analysis. In Sec.3 we present and discuss our results, and we conclude in Sec.4.
2 Method and Data Sets.
The brightness temperature measured by a CMB experiment is the sum of different components: cosmological , tSZ, instrumental noise N and foreground residuals F. If the tSZ signal is well traced by a known spatial template, denoted here as M and built for example from a galaxy catalogue, the total anisotropy at a fixed position on the sky can be modelled as , where measures the amplitude of the template induced signal and denotes the spatial average of the template. If all other components have zero mean and well known correlation functions, then it is possible to use a pixel to pixel comparison to estimate (see Hernández-Monteagudo & Rubiño-Martín (2004) for details). If denotes the correlation matrix of the CMB and noise components (foregrounds residuals will be discussed later) then the estimate of and its statistical error are
| (1) |
Since our galaxy template M will be positive by construction, this equation demands that CMB and noise fields have zero mean. We impose the average of all pixels outside the Kp0 mask to be zero. We checked that our results were insensitive to this requirement by carrying out a similar analysis usig the more conservative Kp2 mask. In all cases our results changed by less than a few percent. Notice that our method requires the inversion of the correlation matrix, a computationally expensive procedure. To speed up the process we will carry out the analysis in pixel subsets as described below. We checked with Monte Carlo simulations that is an unbiased estimator of the error.
We centered our analyses on WMAP W band, which has the highest angular resolution. In this band, the instrumental noise shows almost no spatial correlation and its position dependent amplitude is determined by the number of observations111The WMAP data was downloaded from http://lambda.gsfc.nasa.gov. (Jarosik et al., 2003). The tSZ template was built from the 2 Micron All Sky Survey (2MASS) Extended Source Catalogue (Jarrett et al., 2003). This catalogue contains about 1.5 million galaxies, extending up to redshift (400 Mpc), detected in the near-infrared (, and bands). In order to build a tSZ template (M), all 2MASS galaxies were projected onto the sphere using the HEALPix222http://www.eso.org/science/healpix/ pixelization (Górski, Hivon & Wandelt, 1999) with the same resolution as the CMB data. The amplitude in every pixel was made proportional to the number of galaxies. The template was then convolved with the window function of the noise weighted average beam of the four Difference Assemblies (DA’s) corresponding to the WMAP W band (clean map), and multiplied by the Kp0 mask, like the CMB data. Since our method requires the CMB and noise components to have zero mean, we substracted the map average outside the Kp0 mask.
Pixels were sorted in sets of size , denoted as Mβ, where the superscript index indicates galaxy density, in such a way that low corresponds to higher projected galaxy density. For patches of 2048, the average projected galaxy density for 1 was 420 galaxies per square degree, whereas for 500 the density dropped to 44 galaxies per square degree, which roughly coincides with the average projected density outside the Kp0 mask. ranged from 64 to 2048. The pixel to pixel comparison was then performed on each of these subsets: we compared all pixels in Mβ to their counterparts in the CMB map. Our working hypothesis is that galaxies are fair tracers of the gas density and within each set electron temperature is similar, that is, in those pixels galaxies trace the electron pressure. Within each subset , the galaxy density remained roughly constant, so our method returned as a weighted mean of the measured temperature in those pixels. If no tSZ signal is present, then will scatter around zero, as a consequence of CMB and noise being random fields of zero mean.
3 Results and Discussion.
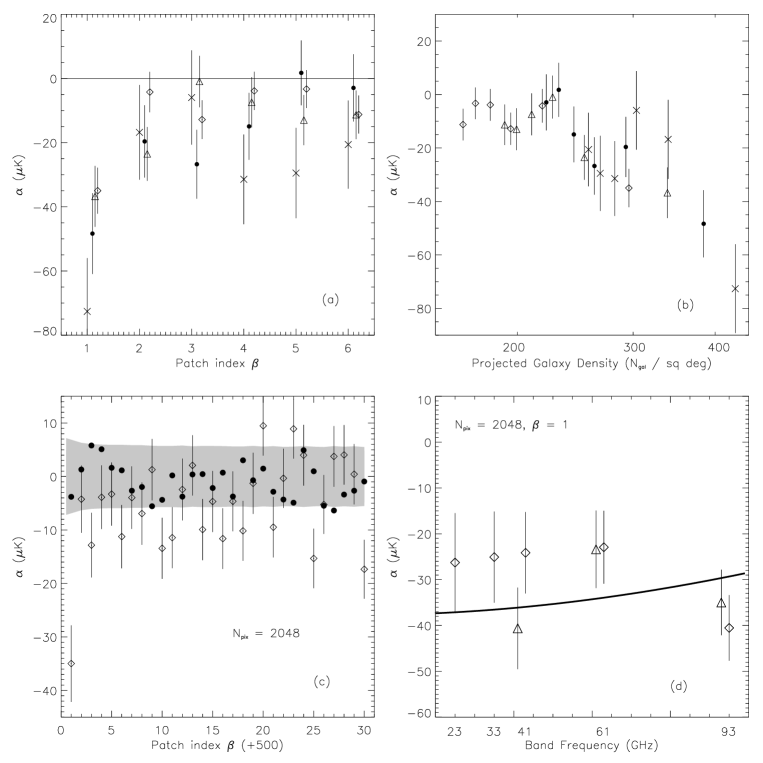
Fig. (1) summarizes our main results: Fig. (1a) shows the estimated ’s for the sets having the highest projected density of galaxies. In abscissas we give the set index (). Crosses, filled circles, triangles and diamonds correspond to 256, 512, 1024 and 2048, respectively. Symbols are slightly shifted for clarity, error bars denote 1 confidence levels. At WMAP instrumental frequencies, the tSZ effect causes temperature decrements, i.e., template and CMB data should anticorrelate giving negative ’s, as found. Sets 1 and 2 of size correspond to the first set of and similarly for all other sizes and sets. Consistently, of a larger set is always bracketed by the ’s measured from its subsets. The largest signal comes from the densest 256 pixels but the highest statistical level of significance is achieved for (K at the detection level), since the error bars shrink due to the higher number of pixels contributing with tSZ signal. In Fig.(1b) the same data sets are plotted versus the average projected galaxy density, i.e., the average number of galaxies per square degree within each subset, as seen by the W band beam. The symbol coding is identical: first sets of 256, 512 show a projected galaxy density as high as 420–380 galaxies per square degree, whereas the 6th set for 2048 contains around 140 galaxies per square degree.
In order to evaluate the significance of the previous results, we repeat the analysis for pixels of intermediate and low projected density of galaxies. In Fig. (1c) diamonds correspond to sets of size with , whereas filled circles correspond to indices . The shaded area limits the 1 error bar for diamonds, that is about a factor of 1.2 bigger than for filled circles. While the latter scatter around zero with the expected dispersion, diamonds are clearly biased towards negative values: besides the first patch (K), there are seven other sets above the 2 level, one of them at .
We also tested the consistency of our results with respect to frequency. In Fig. (1d) we estimate by cross-correlating the densest pixel set (, ) with all WMAP bands: K (23GHz), Ka (33GHz), Q (41GHz), V(61GHz) and W(93GHz). Diamonds give the obtained ’s from raw maps, whereas triangles refer to analyses performed on foreground cleaned maps available in the LAMBDA site. Note that the WMAP team only provided clean maps for the three highest frequency channels. In all maps, the signal is compatible with being due to tSZ. A more quantitative comparison is not straighforward since the maps have different angular resolution and galactic contamination. When compared in pairs, all ’s are within 1 of each other and they are all within 2 of the expected frequency dependence of the tSZ effect, whose best fit for the cleaned Q, V and W band maps is plotted as a solid line.
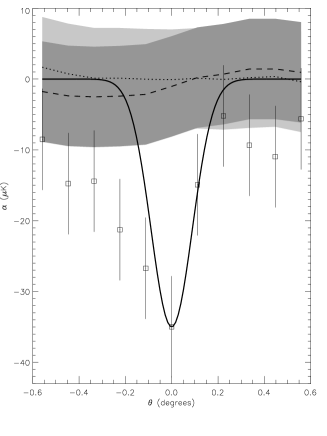
We measure the extent of the tSZ regions by rotating the template around the z-axis (perpendicular to the galactic plane) and cross-correlating the densest 2048 pixels. In Fig. (2) squares give versus the average angular displacement of the pixel set. Error bars are again 1. The solid line represents the gaussian approximation of the W-band beam. The size of the tSZ sources is typically 20–30 arcmins, slightly bigger than the beam but remarkably smaller than the values obtained by Myers et al. (2004) from rich ACO clusters. Actually, when one studies the angular distribution of the 2048 densest pixels, one finds that they are associated in groups of typically 3–4 members, and that the groups are uniformly distributed on the sky.
By comparing, in Fig. (1d), results from the raw and cleaned maps built from the W band, one can conclude that foregrounds will have little impact on our results. We made a more detailed study using Monte Carlo simulations: we performed 100 simulations of the CMB and W-band noise components and added and removed a foreground residual template. As a conservative model for foreground residuals left after cleaning the W-band, we took the sum of the dust, free-free and synchrotron emission maps for the W band released by the WMAP team. In each simulation we (i) added and (ii) substracted the whole foreground template. In Fig. (2) we plot the average ’s for these simulations, after adding (dotted line) and substracting (dashed line) the residuals for several angular displacements. The shaded bands display the 1 dispersion areas. The errors practically equal the statistical estimates of eq. (1). To summarize, foregrounds do not significantly affect our estimated amplitude of the tSZ contribution.
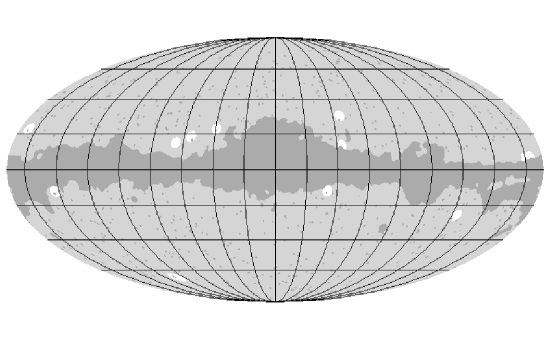
Finally, we removed from our galaxy template all those pixels that were associated with known galaxy clusters. We used the ACO and APM catalogues of optically selected clusters and the XBC (Ebeling et al., 2000), de Grandi (de Grandi et al., 1999), NORAS (Böhringer et al., 2000), ROSAT-PSPC (Vikhlinin et al., 1998) and Vogues (Vogues et al., 1999) X-ray cluster catalogues. We excised from the analyses all pixels lying within a virial radius of the cluster center (taken to be ten times the core radius). For clusters without measured core radius but with known redshift, we assumed a virial radius of 1.7 Mpc, and removed all pixels within that distance. For the rest (the majority), we conservatively removed all pixels within a circle of 30 arcmin from the cluster centre. Out of the 2048 pixels for , 1681 were eliminated. For the patches with , i.e., the next 60,000 densest pixels in Fig.(1c), a large fraction of them were also associated to known clusters and were eliminated with the excising. In Fig.(3) we show the cross correlation of these remaining pixels outside known clusters with the clean W band map. Note that here patch sortening has been regenerated using surviving pixels. For the densest sets of 64 (filled circles), 128 (triangles) and 256 (diamonds), we still find evidence of tSZ, but at much lower level of significance. For the densest 64 pixels, subtending square degrees on the sky, we obtain K, at significance level. The signal gets dilluted rapidly as more pixels are included in the analysis: K and K for 128, 256, respectively. Out of the 64 densest pixels, 54 pixels are in the ZoA, and 45 of them coincide with five different cluster candidates in the CIZA (Ebeling, Mullis, & Tully, 2002) catalogue, (Ebeling, private communication). The remaining group of pixels are not associated to any known galaxy cluster. In Fig. (4) we plot the location of those pixels in the sky. The shaded area correspond to the Kp0 mask, that also remove many point sources outside the galactic plane (dark grey dots). The 64 pixels are ploted as big white circles for convenience.
4 Conclusions
Under the assumption that galaxies trace hot gas, we have used the 2MASS galaxy catalogue to search for tSZ signal present in WMAP data. In square degrees on the sky we have found a contribution of average amplitude -35 7 K, spectrally compatible with tSZ, and mostly generated by ACO clusters of galaxies. Our study, based on a pixel-to-pixel comparison, reaches the highest sensitivity level reported so far. Compared with methods based on power spectrum or correlation function analysis, our method gives a larger level of significance since we restrict the analysis to the regions of the sky where the tSZ contribution is expected to be the largest.
We have found that the typical angular extension of this signal is somewhere between 20–30 arcmins. Furthermore, once all known clusters of galaxies are excised from the analysis, we are left with square degrees with an average amplitude of K: those pixels fall mostly in the ZoA and after performing our analyses we found that 45 of them are associated to five different galaxy clusters in the CIZA catalogue. We have found no conclusive evidence that, in the volume probed by 2MASS, structures less bound than clusters contribute to the tSZ signal present in the WMAP data.
References
- Abell, Corwin & Olowin (1989) Abell, G.O, Corwin, H.G.Jr. & Olowin, R.P. 1989 ApJSS 70, 1
- Afshordi, Loh, & Strauss (2004) Afshordi, N., Loh, Y., & Strauss, M. A. 2004, PhRvD, 69, 083524
- Banday et al. (1996) Banday, A. J., Górski, K. M., Bennett, C. L., Hinshaw, G., Kogut, A., & Smoot, G. F. 1996, ApJ 468, L85
- Bennett et al. (2003) Bennett, C.L. et al. 2003 ApJS, 148, 97
- Bennett et al. (1993) Bennett, C. L., Hinshaw, G., Banday, A., Kogut, A., Wright, E. L., Loewenstein, K., & Cheng, E. S. 1993, ApJ 414, L77
- Böhringer et al. (2000) Böhringer, H. et al. 2000 ApJS 129, 435
- Carlstrom et al. (2002) Carlstrom, J. E., Holder, G. E., Reese, E. D. (2002) ARA&A, 40, 643
- Dalton et al. (1997) Dalton, G. B., Maddox, S. J., Sutherland, W. J., & Efstathiou, G. 1997, MNRAS 289, 263
- de Grandi et al. (1999) de Grandi, S. et al. 1999 ApJ 514, 148
- Ebeling et al. (2000) Ebeling, H., Edge, A. C., Allen, S. W., Crawford, C. S., Fabian, A. C., & Huchra, J. P. 2000, MNRAS 318, 333
- Ebeling, Mullis, & Tully (2002) Ebeling, H., Mullis, C. R., & Tully, R. B. 2002, ApJ, 580, 774
- Fosalba, Gaztañaga & Castander (2003) Fosalba, P., Gaztañaga, E., & Castander, F. J. 2003, ApJL, 597, L89
- Fukugita & Peebles (2004) Fukugita, M. & Peebles, P. J. E. (2004). Astro-ph/0406095
- Górski, Hivon & Wandelt (1999) Górski, K.M., Hivon, E. & Wandelt, B.D., 1999, Proceedings of the MPA/ESO Cosmology Conference ”Evolution of the Large Scale Structure”, eds. A.J.Banday, R.S.Sheth, and L.Da Costa, PrintPartners Ipskamp, NL, pp.37-42, (also astro-ph/9812350)
- Hernández-Monteagudo & Rubiño-Martín (2004) Hernández-Monteagudo, C. & Rubiño-Martín, J. A. 2004, MNRAS, 347, 403
- Jarosik et al. (2003) Jarosik, N., et al. 2003, ApJS, 148, 29
- Jarrett et al. (2003) Jarrett, T. H., Chester, T., Cutri, R., Schneider, S. E., & Huchra, J. P. 2003, AJ, 125, 525
- Kull & Böhringer (1999) Kull, A. & Böhringer, H. 1999, A&A, 341, 23
- Myers et al. (2004) Myers, A. D., Shanks, T., Outram, P. J., Frith, W. J., & Wolfendale, A. W. 2004, MNRAS, 347, L67
- Penton, Stocke & Shull (2004) Penton, S. V., Stocke, J. T. & Shull, J. M. (2004) ApJS, 152, 29
- Spergel et al. (2003) Spergel, D.N. et.al., 2003, ApJS, 148, 175
- Springel, White, & Hernsquist (2001) Springel, V., White, M. & Hernsquist, L. 2001 ApJ 549, 681
- Sunyaev & Zeldovich (1980) Sunyaev, R. A. & Zeldovich, I. B. 1980, ARA&A, 18, 537
- Vikhlinin et al. (1998) Vikhlinin, A., McNamara, B. R., Forman, W., Jones, C., Quintana, H., & Hornstrup, A. 1998, ApJ 502, 558
- Vogues et al. (1999) Vogues, W. et al. 1999, A&A 349, 389
- Zappacosta et al. (2002) Zappacosta et al. 2002 A& A, 394, 7