Pattern Speeds of BIMA-SONG Galaxies with Molecule-Dominated ISMs Using the Tremaine-Weinberg Method
Abstract
We apply the Tremaine-Weinberg method of pattern speed determination to data cubes of CO emission in six spiral galaxies from the BIMA SONG survey each with an ISM dominated by molecular gas. We compare derived pattern speeds with estimates based on other methods, usually involving the identification of a predicted behavior at one or more resonances of the pattern(s). In two cases (NGC 1068 and NGC 4736) we find evidence for a central bar pattern speed that is greater than that of the surrounding spiral and roughly consistent with previous estimates. However, the spiral pattern speed in both cases is much larger than previous determinations. For the barred spirals NGC 3627 and NGC 4321, the method is insensitive to the bar pattern speed (the bar in each is nearly parallel to the major axis; in this case the method will not work), but for the former galaxy the spiral pattern speed found agrees with previous estimates of the bar pattern speed, suggesting that these two structures are part of a single pattern. For the latter, the spiral pattern speed found is in agreement with several previous determinations. For the flocculent spiral NGC 4414 and the “Evil Eye” galaxy NGC 4826, the method does not support the presence of a large-scale coherent pattern. We also apply the method to a simulated barred galaxy in order to demonstrate its validity and to understand its sensitivity to various observational parameters. In addition, we study the results of applying the method to a simulated, clumpy axisymmetric disk with no wave present. The TW method in this case may falsely indicate a well-defined pattern.
1 Introduction
While it is generally accepted that spirals and bars in galaxies are largely wave phenomena, one of the fundamental difficulties in their study has been the measurement of the angular speed of the wave patterns, especially for spirals. These angular frequencies are not directly observable but crucial for understanding the rate by which spirals and bars affect the evolution of galaxies. Spiral density waves have been shown to trigger star formation in grand-design spirals (e.g. Rand, 1993; Knapen et al., 1992), so the rate at which gas encounters spiral arms may affect the rate of star formation. Scattering of stars off spiral arms is likely to be a significant source of disk heating, which may be particularly important in late-type spirals (Merrifield, Gerssen, & Kuijken, 2001). The rate of heating in this way is therefore linked to the rate at which stars encounter the arms, and thus the pattern speed.
Traditionally, pattern speeds of spirals have been determined by identifying theoretically predicted behaviors associated with various resonances of the wave with the periodic motions of the stars and gas, such as the Lindblad and Corotation radii (e.g. Tully, 1974; Elmegreen, Elmegreen, & Seiden, 1989; Lord & Kenney, 1991). Knowledge of the rotation curve is also needed. Such analyses have yielded pattern speed estimates for several galaxies.
However, theoretical predictions for resonant behavior vary significantly, not least because the nonlinear response at resonances is difficult to address either analytically or by simulation, and is different for stars and gas. We do not attempt to present a full summary of the various theoretical studies, but rather highlight the diversity of predictions. For instance, the beginning of spiral structure is often associated with the Inner Lindblad Resonance (ILR). However, waves may be sustained beyond the Lindblad Resonances in the gas (and therefore in the young stars) but not in the old stellar disk (Bertin, 1994). But although waves in the gas might propagate through these resonances, it is also possible that gaps in the gas distribution may be created at these locations, depending on gas viscosity and other parameters, if the stellar wave is strong enough (Lubow, 1993). Of course, depending on the rotation curve and pattern speed, some galaxies may not have an ILR. Good knowledge of the rotation curve is necessary to determine whether a galaxy has an ILR (or two), and its location. For a typical rotation curve with a turnover, the ILR is often near the turnover radius where the slope of the curve, and thus the epicyclic frequency, is changing rapidly, while noncircular motions can hinder determination of the axisymmetric rotation curve. Lubow (1993) also notes reasons why the gaseous response at corotation may be complex.
There have also been various theoretical predictions regarding the outer extent of spiral structure, which have been used to estimate pattern speeds. For instance, Lin (1970) predicted that spiral waves should be damped at the Corotation Radius (CR), but attempts to determine the pattern speed of M81 based on this prediction were sensitive to the depth of the imaging and the choice of tracer (e.g. stars vs HI), which led to substantially different results (see Westpfahl 1998). This prediction was superseded by Shu (1970), who argued that significant damping should occur at the Outer Lindblad Resonance (OLR). Orbit calculations by Contopoulos & Grosbol (1986) indicate on the other hand that strong spirals can only be maintained up to the 4:1 resonance.
Pattern speeds of some spirals – M51, for example (Garcia-Burillo, Combes, & Gerin, 1993) – have also been estimated by matching observed spiral morphology with predictions from numerical simulations, while the change in character of the streaming motions induced by the wave on either side of corotation has been used to find pattern speeds in other spirals (e.g. Canzian, 1993; Elmegreen, Wilcots, & Pisano, 1998; García-Burillo et al., 2003; Chemin et al., 2003). This method is potentially very useful as the change in streaming motions is a more direct and simple prediction of density wave theory, although it may not always be easy to identify observationally.
While the main focus of this paper is on spiral patterns, we note that for bars, there is a body of observational and theoretical evidence that the CR lies just beyond the end of the bar (e.g. Contopoulos, 1980; Elmegreen et al., 1996, Puerari & Dottori, 1997; Aguerri, Beckman, & Prieto, 1998). Based on this result, many bar pattern speeds have been estimated [see compilation in Elmegreen et al. (1996)].
Because of the various assumptions involved in these methods of determining pattern speeds in spiral galaxies, a completely independent method, with applicability to a large number of galaxies while not relying, for example, on any particular theory of density waves or a numerical simulation, is desirable. In this paper, we continue our exploration of the use of the Tremaine-Weinberg (Tremaine & Weinberg, 1984, hereafter TW) method in determining pattern speeds in spiral galaxies with molecule-dominated ISMs, begun in Zimmer, Rand, & McGraw (2004, hereafter ZRM).
1.1 The Tremaine-Weinberg Method
The Tremaine-Weinberg method (hereafter TW method) allows pattern speeds to be determined for spirals and bars under several assumptions:
1. The disk has a single, well defined pattern speed.
2. A disk component can be found that obeys the continuity equation as it orbits through the spiral pattern: it is neither created nor destroyed in significant amounts over an orbit.
3. The relation between the emission from this component and its surface density is linear, or if not, suspected deviations from linearity can be modeled.
4. The surface density of the component goes to zero (within noise) at some radius and all azimuths within the map boundary.
5. The disk of the galaxy must be flat (no warps), at least out to a distance where the intensity of the tracer is nearly zero. Motions and variations in structure perpendicular to the disk must be negligible.
Under these assumptions, TW show how the continuity equation, written in cartesian coordinates in the plane of the disk:
can be integrated in the major and minor axis directions to allow the pattern speed to be determined from maps of the intensity and velocity field of the tracer (skipping several steps of derivation; see TW):
where is the pattern speed, is the surface density of the component, and are the major and minor axis coordinates, and and are the velocity components along those axes – thus is simply the observed velocity divided by the galaxy inclination. The pattern speed enters because the time derivative of the surface density at a given location depends on the rate at which the rotating pattern carries material through that location (in a stationary spiral, the pattern speed would be zero, and the surface density at every point would not change with time).
Equation (2) says that if the relation between the emission and surface density of the component is understood, then , modulo the galaxy inclination, can be determined by dividing the sum of the intensity-weighted observed velocity along a line parallel to the major axis by the intensity-weighted position coordinate. Since each line parallel to the major axis provides an independent measurement of , many determinations can be made for a galaxy, depending on resolution and sensitivity. A better value can then be found by averaging measurements of for individual apertures. If more than one pattern is present for a given aperture [as in, e.g., the bar-within-bar models of Pfenniger & Norman (1990) and Friedli & Martinet (1993), or the bar-within-spiral models of Sellwood & Sparke (1988)], will have contributions from the various patterns. Alternatively, one can plot the intensity-weighted, inclination-corrected line-of-sight velocity, hereafter denoted , vs. the intensity-weighted position coordinate, , for all apertures and find the best-fit slope – a variation introduced by Merrifield & Kuijken (1995). This refinement has the advantages that errors in the systemic velocity and -coordinate of the kinematic center of the galaxy do not affect the final value. Also, apertures close to the center of the galaxy, for which values of and tend to be small, leading to noisy measurements of , carry less weight in the fit. However, the best fit slope will be biased by the outer apertures.
The TW method has been mainly applied to early-type bars using starlight and absorption-line kinematics from long-slit spectra [see Gerssen, Kuijken, & Merrifield (2003) and references therein], since older stars will survive many passages through the pattern and the extinction problem, which is of concern because of the third assumption above, is minimized. Modified forms of the method have also been used by Sambhus & Sridhar (2000) to determine the pattern speed of the nucleus of M31, and by Debattista, Gerhard, & Sevenster (2002), who used 1612 MHz emission from OH/IR stars in the Milky Way to determine the speed of the pattern (or patterns) they participate in.
Applications to gaseous phases are complicated especially by the second and third assumptions above. Phase changes as gas orbits through a pattern will lead to the second assumption being violated in general if only one gaseous phase is studied. In general, the ISM mass will be dominated by the molecular and atomic phases, and there may be significant exchange of gas from one phase to the other as a result of molecule formation in self-shielding atomic gas clouds and dissociation of molecular gas clouds by stellar radiation, especially in spiral arms. However, if the ISM is dominated everywhere by either atomic or molecular gas, then it is clear that phase changes involve only a small percentage of the dominant phase. Also, star formation is a potential sink in the continuity equation, but the process is inefficient. Kennicutt (1998) finds that the average spiral converts only 4.8% of its gas into stars every 108 years. CO emission also has the advantage that it is largely concentrated to the inner disks of galaxies where warps are less likely to occur. While 21-cm emission provides a reliable measure of HI column densities, the standard tracer of molecular column densities, CO emission, is subject to larger uncertainties, particularly in metallicity. The TW method has been applied to the spiral M81 by Westpfahl (1998) and the Blue Compact Dwarf NGC 2915 by Bureau et al. (1999) using 21-cm observations.
Application of the method to CO observations in three galaxies with molecule-dominated ISMs has been carried out by ZRM and this paper extends that work. Pattern speeds were measured for M51, M83, and NGC 6946, using fully-sampled CO 1–0 maps from the literature, with results consistent with determinations based on behavior at resonances for M51 (Tully, 1974; Elmegreen et al., 1989) and M83 (Lord & Kenney, 1991). The measured speed for M51, km s-1 kpc-1, is however, inconsistent with the value of 27 km s-1 kpc-1 from Garcia-Burillo et al. (1993), determined from a comparison of the observed CO morphology with a simulation of the dynamics of the molecular clouds. ZRM also found evidence in M51 for a faster pattern speed for the central bar.
ZRM also tested the method for sensitivity to a variation in the conversion factor between CO intensity and H2 column density (commonly denoted by ) with metallicity, evidence for which is discussed by Boselli, Lequeux, & Gavazzi (2002), Dumke et al. (1997),Arimoto, Sofue, & Tsujimoto (1996), and Wilson (1995), with recent studies suggesting a linear relationship. Such an assumed variation of (using measured metallicity gradients) in these galaxies produced no significant change in the derived pattern speed. There are also suggestions that may vary between arm and interarm regions in M51 by perhaps a factor of 2 (Garcia-Burillo et al., 1993), but such a variation also produced no significant change to the derived pattern speed. Note that the overall scaling of for a given galaxy does not affect the TW method, although a value must be assumed to justify molecular dominance of the ISM. In this paper, we assume by default a value, appropriate for solar metallicity, of mol cm-2 (K km s-1)-1, consistent with the relationship of with metallicity found by Boselli et al. (2002). ZRM also showed that the maps used easily extend far enough to allow the ratio of the integrals that are used to calculate and to converge to stable values for most apertures in each galaxy, and to allow the slope in the plot of vs. to converge to a well-defined value.
A great advantage to using data cubes over long-slit spectra is that the quantities and are readily derived from moment maps, and the sensitivity to errors in the assumed position angle (PA) of the major axis, the severity of which has been demonstrated by Debattista (2003), can be directly assessed by varying this parameter.
In this paper, we extend the ZRM study to a larger sample of galaxies, which we argue all have molecule-dominated ISMs, from the BIMA Survey of Nearby Galaxies (BIMA SONG; Helfer et al. 2003). These 44 galaxies encompass all spirals (except M33) between Sa and Sd with a redshift less than 2000 km s-1, inclination 70, Dec. –20, and mag. Most were observed with a seven-pointing mosaic covering 200” on a side. Of these galaxies (excluding M51 and NGC 6946), 22 have single dish data from the NRAO 12-m telescope included in the final maps so that there is no missing flux problem common to interferometers. They all resolve spiral and bar structure (typically 6” resolution), although in some galaxies only a bar is well detected. Fifteen of the galaxies with single-dish CO data have high-resolution Very Large Array (VLA) or Westerbork Synthesis Radio Telescope HI data with in the literature. Six of these have global H2/HI mass ratios greater than 0.9 (Young & Knezek, 1989; Sage, 1993). These are the subject of this paper. Further papers will explore galaxies with HI-dominated ISMs and those for which neither phase dominates (for the latter, molecular and atomic gas must be considered together in the continuity equation). Properties of these galaxies are shown in Table 1.
First, however, we carry out some explorations of the TW method. We first show the results of applying the method to a clumpy disk with no wave as a cautionary example. Also, although our main focus is on spiral patterns, we demonstrate the effectiveness of the method and its robustness to various parameters using simulations of a bar.
2 Tests of the Tremaine-Weinberg Method
2.1 A Clumpy Axisymmetric Disk
One of the main assumptions of the TW method is that the galaxy have a single, clear wave pattern. However, as we show in this subsection, even in the absence of any wave, use of the TW method may still lead to the erroneous conclusion that a wave pattern with a well-defined speed exists.
We use the Groningen Image Processing System (GIPSY) program GALMOD to generate an axisymmetric, clumpy disk of gas with a specified (constant apart from the clumpiness) surface density, rotation curve, inclination and major axis PA. We place the model galaxy at a distance of 10 Mpc, with a pixel size of 1”. We smooth the simulated data cube to 6” resolution, and apply the TW method to zeroth- and first-moment maps created with no intensity cutoffs, using apertures spaced by 6”. The degree of clumpiness results in a root-mean-square variation of 2% of the mean value in the zeroth-moment map. Since the cube is built by counting clouds in spatial and velocity bins, generated by probability distribution functions using Monte Carlo techniques, the noise is essentially governed by Poisson statistics.
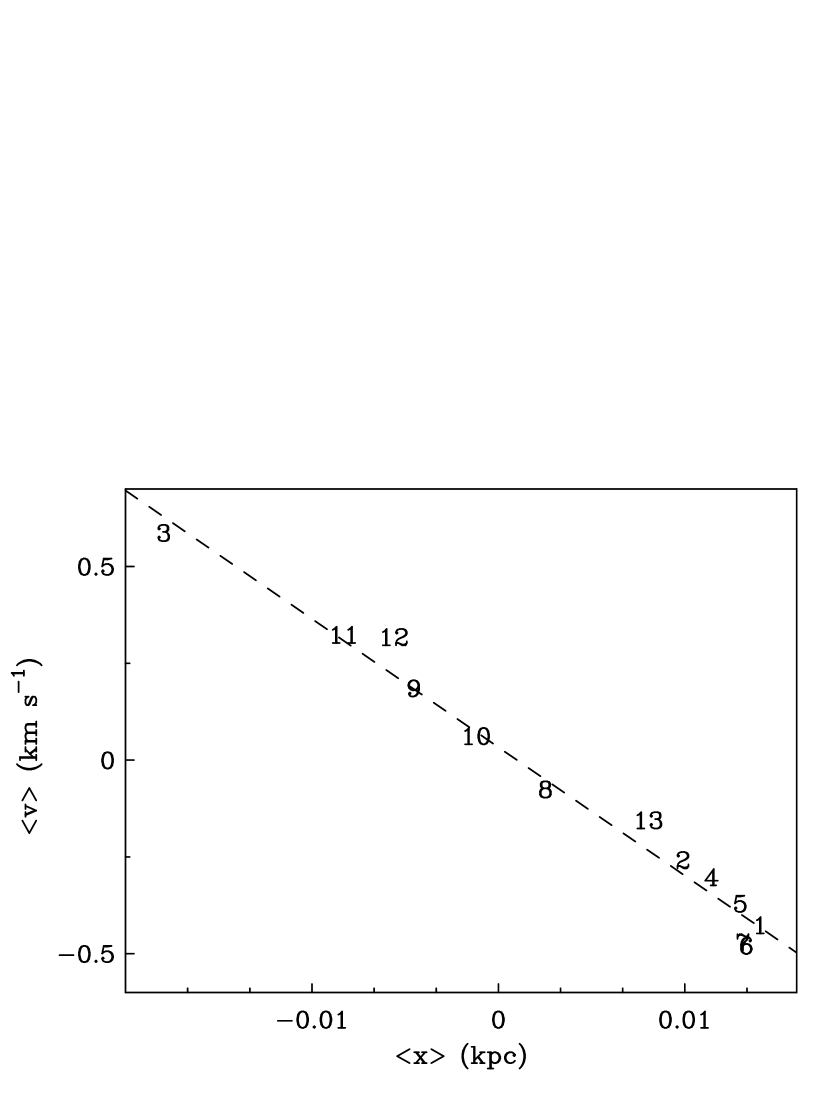


The first case we study is a galaxy with a rising rotation curve with a gradient of 31 km s-1 kpc-1 at an inclination of 65. Figure 1 shows a zeroth-moment map and the apertures used in the TW method. The root-mean-square scatter in the zeroth-moment map is 72% of the mean value. Figure 2 shows the resulting plot of vs. (hereafter – plot), and Figure 3 shows pattern speed vs. aperture number. There is a clear correlation in Figure 2, and a well defined mean value in Figure 3, suggesting that a pattern is present. However, this is an artifact of the clumpiness. First, note that negative values of correspond to the receding side of the galaxy (this convention is true throughout this paper – as a consequence, we will quote absolute values of all best fit slopes). Then, along a given aperture, if the distribution of clumps biases toward a positive (or negative) value, then they will also bias toward a negative (positive) value. However, the range of values of and will depend on the degree of clumpiness, and is here very small. It is also easy to show in general for a linearly rising rotation curve that the slope in the – plot will tend to the slope of the rotation curve. In this case, the best fit slope is km s-1 kpc-1 (the error bar is derived from the scatter in the plot). Another important indicator that no pattern is present is in the sequence of aperture numbers in the – plot. Subsets of aperture numbers only form sequences when they are dominated by a clump or a group of clumps crossing several apertures (artificial sequencing can also be produced if the apertures oversample the resolution). Otherwise, there should be no sequence. For random clumpiness, a given aperture is just as likely to have a positive value of or as a negative value.
For a more typical spiral with a rotation curve turning over to a flat value at some radius, the slope in the – plot should be less than the gradient of the rising part of the curve, depending on the distribution of clumps and the exact shape of the curve. Indeed, for a rotation curve that rises with the above gradient in the inner half of the disk before becoming flat, we measure a slope in the – plot of km s-1 kpc-1.
The results of this simulation are very sensitive to the assumed PA. The relative lack of a sequence of aperture numbers can vanish if the position angle is inaccurately known. Figure 4 shows vs. for a error in PA. The aperture numbers are now in sequence, the scatter is reduced, and the range of and is larger. These are natural consequences of the asymmetry introduced by this error (see Debattista 2003). For a error, the plot is very similar but with the aperture sequence essentially reversed. The slope in both cases is km s-1 kpc-1. In general, PA errors increase the slope.
These effects are less obvious if there is more scatter, which will occur if the disk is clumpier or the inclination is reduced. For example, for , the slope is km s-1 kpc-1, with even less evidence for sequencing of aperture numbers and a larger range of and . PA errors of still introduce clear sequencing. For a given inclination, we find that decreasing the degree of clumpiness does not significantly change the slope but does decrease the range of and , as expected. For a perfectly smooth disk, all apertures would yield values of zero for and .
2.2 The Method Applied to a Simulated Bar
Here we carry out tests of the TW method on numerical simulations of a bar, in order to demonstrate the utility of the method and to understand its sensitivity to the angle of the bar relative to the major and minor axes, the angular resolution, the inclination, and [as already explored by Debattista (2003)] the uncertainty in the PA. A bar presents more constraints than a spiral because the latter has no preferred position angle relative to the principle axes (as long as it wraps through a large enough angle).
To create a bar with a defined pattern speed, we created a self-consistent three-component model of a galaxy following the commonly used general recipe of Hernquist (1993). His procedure includes parameters for a disk, bulge, and a halo. We changed half the disk particles into gas particles using smoothed particle hydrodynamics (SPH).
The parameters for the galaxy in our simulations are given in Table 2. Obviously the masses listed are in relative units, and can be rescaled as needed. The primary difference between these parameters and those given by Hernquist are the ratios between disk and halo. By setting the mass ratio between the disk and halo to be , we create a system that is dynamically unstable to bar formation as shown by Ostriker & Peebles (1973) and others.
The code used to evolve the system is “mass99”, a tree gravity + SPH code developed at George Mason University. For these simulations, the code was set to have similar run parameters to those in other galaxy simulations (Hernquist & Katz, 1989). There are 32,000 total particles, of which 6400 are SPH particles. The simulation grid is 500 pixels on a side. In physical units, the masses in Table 2 are in units of M, and the pixel size is 120 pc.
We choose a frame from the simulation where the bar is clearly well developed, is not significantly evolving in shape, and has settled into a constant angular speed, which we measure directly from an animation of the time evolution of the galaxy to be km s-1 kpc-1. This angular speed was checked over several periods to make sure that it was not rapidly evolving.
Using the SPH data from the simulations, we created simulated observations of the gas distribution in our system. After picking a viewing angle, data were binned into a three-dimensional grid of projected position and line-of-sight velocity. These data were then convolved with a Gaussian filter of a specified size in each velocity plane and an initial cutoff threshold was included to drop pixels that were below a specified “noise” threshold. Using the convolved and clipped data, we formed zeroth- and first-moment maps of the gas distribution. Phase changes in the gas component were not modeled.
In the frame we used for our primary analysis, a weak spiral exists with the same pattern speed, along with clumpy disk gas with no pattern. We found that further intensity clipping to remove disk gas improves many of the results described below by decreasing the scatter induced by this clumpiness (the intensity contour at which the data were clipped is indicated in the relevant figures). However, clipping may also remove gas participating in the bar pattern, violating the assumptions of the TW method, and we find that clipping at too high an intensity leads to incorrect pattern speed determinations.
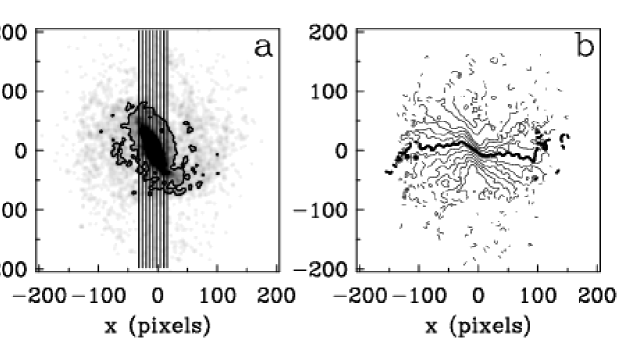
As a representative case, we examine a frame from the simulation, viewed at , where the bar makes a large angle with both axes. Figure 5 shows the zeroth-moment map and the apertures used, and the first-moment map. Here the data cube was convolved to 720 pc resolution before the moment maps were made. The clear sign of bar orbits, namely isovelocity contours running at an angle to the galaxy major axis, is evident. In all cases the apertures are spaced by the resolution FWHM. The contour indicates the clipping level. The – plot is shown in Figure 6, and the best fit slope is km s-1 kpc-1, within the error bars of the true value (note that in Figure 6 refers to the major axis coordinate, which is actually the vertical axis in Figure 5 and thus labeled ’y’). Here, the sequence of aperture numbers reflects the structure of the simulated galaxy: as one proceeds from aperture 1 to 9, the bulk of the emission steadily moves from the negative to the positive side of the minor axis. The sequencing is slightly different from that of the simulated bar of Debattista (2003) because the shape of the bar changes with distance from its center. The relatively round iso-density contours of the emission (his Figure 3) that dominates the first (and last) two apertures results in values of and in his Figure 5 somewhat closer to zero than the following (preceding) two apertures, which cross the bar where it is rather elongated.

Debattista (2003) has demonstrated the sensitivity of the TW method to errors in the assumed major axis position angle. We confirm this sensitivity here, finding that, for the above simulation, and errors in the PA, typical of real observations, result in best fit slopes of km s-1 kpc-1 and km s-1 kpc-1, or percent errors of 35% and 22%, respectively.
To study the sensitivity of the TW method on bar viewing parameters, we tilt the galaxy at four different inclinations (10, 35, 65, and 80) around a range of PAs in increments of 10 (sometimes 5 when the bar is nearly aligned with a principle axis). The linear resolution is again 720 pc. Results for the derived pattern speed vs. these angles are shown in Figure 7. Alignments with the principle axes are indicated, as well as the pattern speed measured from the animation. For and PA, only three apertures cross the bar, making the resultant slope highly uncertain, and thus no data points are plotted. In general, a pattern speed accurate to within the combined errors can be measured as long as the bar is not within about of a principle axis, for all inclinations, even as high as . The reason for the failure of the TW method for bars closely aligned with a principle axis is that, because of the symmetry introduced in positions and velocities around the principle axes, both integrals in Eq. 2 tend to zero. In some cases, a reliable pattern speed can be measured when the bar is as close as 5 to the major axis, probably due to gas from the beginnings of the spiral arms being included in many of the apertures.

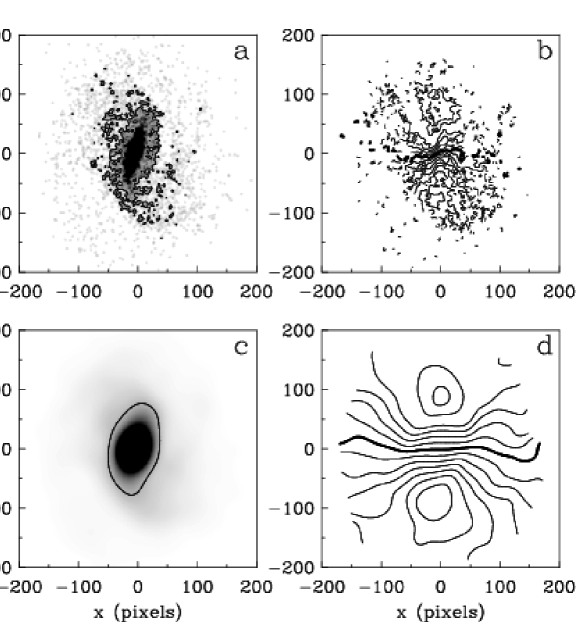
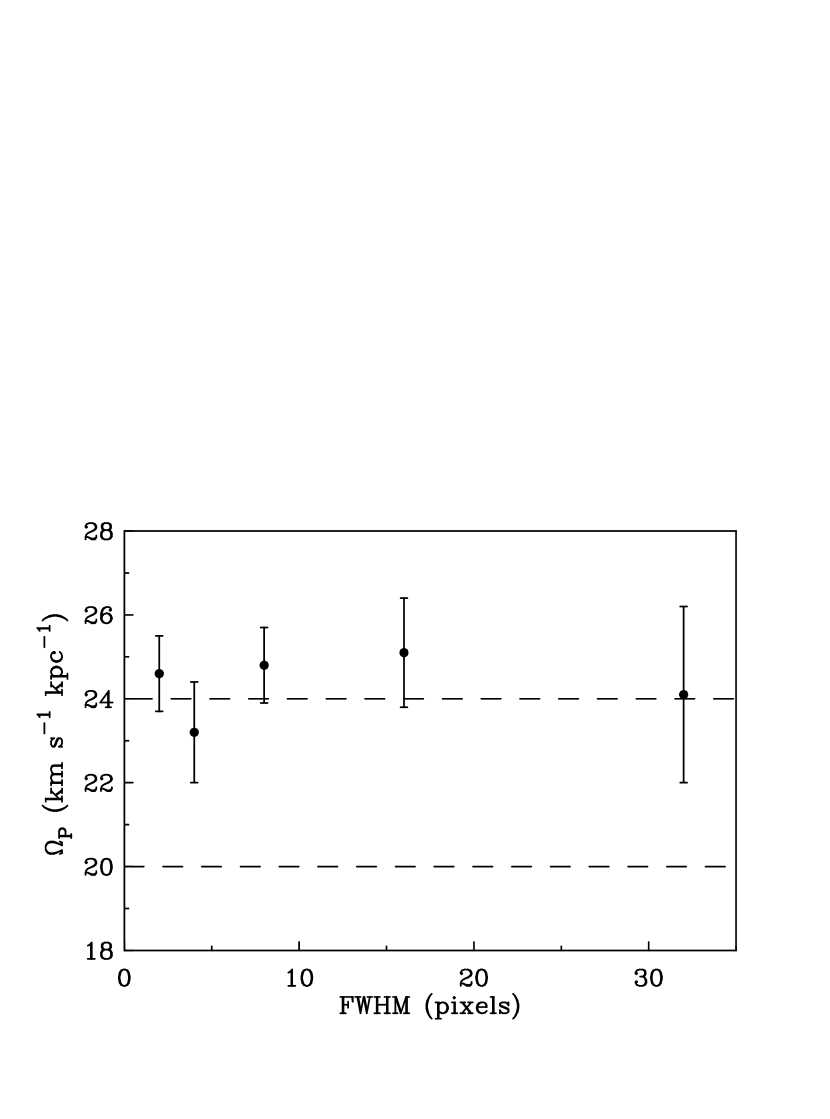
Finally, we test the sensitivity of the method to angular resolution. We smooth the simulated data cube using Gaussians of FWHM approximately 2, 4, 8, 16 and 32 pixels, before creating moment maps. As examples, the zeroth- and first-moment maps at 4- and 32- pixel resolution are shown in Figure 8. Even with the highest degree of smoothing, the twist in the isovelocity contours is still clear. Figure 9 shows a plot of best fit slope vs. resolution. The slopes are consistent within the error bars (they are slightly larger than the value derived from the animation because in the chosen frame the bar is fairly well aligned with the major axis). The implication is that the TW method can be applied to even poor angular resolution observations as long as the morphological and kinematic signatures of the pattern are evident. In ZRM, we performed a similar test by degrading the original 16” resolution of the CO data cube of M51 by factors of 2 and 3, finding no significant difference in the determined spiral pattern speed. TW also noted that resolution did not cause a bias in the determination.
3 Results for the BIMA-SONG Galaxies
For each galaxy, zeroth- and first-moment maps were made from full-resolution data cubes. Angular resolutions are of order 6” (more precise beam parameters are given below). In some galaxies (noted below) with well-resolved spiral structure, cubes Gaussian-smoothed to 12” resolution were used. In all cases, sensitivity was greatly improved by using the GIPSY program BLOT to remove noise that can be distinguished as emission features that clearly do not follow the rotation of the galaxy. Moment maps were made using 1–2 cutoffs and excluding any channels at either end of the cube that were judged not to include real emission. The quantities and were calculated for apertures spaced by approximately one beam width in all cases. For all galaxies, the channel width is 10 km s-1. All previous pattern speed determinations quoted are scaled to our adopted galaxy distances.
3.1 NGC 1068
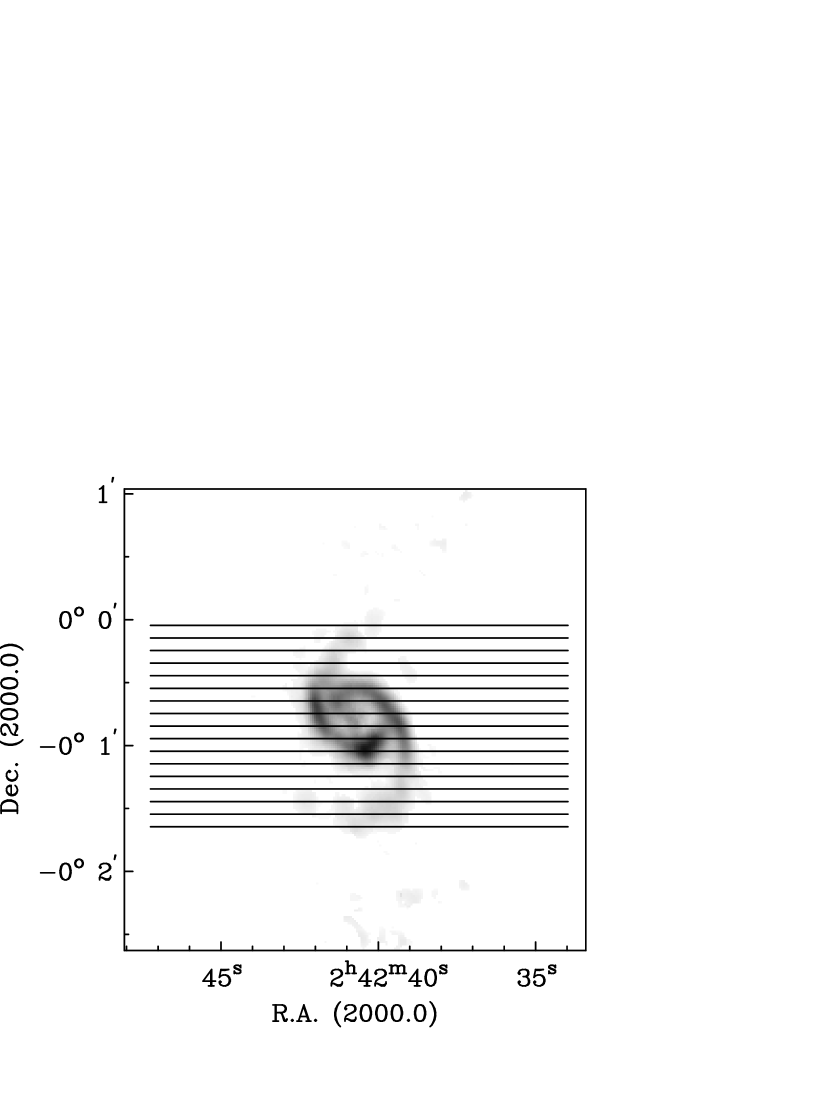
NGC 1068 is a very well studied Seyfert 2 galaxy and is classified as (R)SA(rs)b in the RC3 catalog (de Vaucouleurs et al., 1991). Running through the Seyfert nucleus is a 2.3 kpc long [for an assumed distance of 14.4 Mpc; Bland-Hawthorn et al. (1997)] stellar bar (Scoville et al., 1988; Thronson et al., 1989), also detected in CO (e.g. Schinnerer et al. 2000). A two-arm spiral begins near the ends of the bar, the bright inner segments wrapped tightly enough to appear as a pseudo-ring at . The bar and spiral are clearly evident in the zeroth-moment map from the BIMA SONG data (Figure 10). Note that the bar runs at a substantial angle to both principle axes.

On the basis of images analyzed by Bland-Hawthorn et al. (1997), Schinnerer et al. (2000) conclude that there is a large-scale bar of radius oriented nearly along the minor axis. By assuming corotation is near the end of this bar, they estimate a pattern speed of km s-1 kpc-1. They interpret the pseudo-ring as a pile-up of gas between the outer ILR (oILR) and inner ILR (iILR). They further interpret the CR of the inner bar to coincide with the oILR of the outer bar, yielding a pattern speed for the former of km s-1 kpc-1. Helfer & Blitz (1995) derive a slightly larger speed of km s-1 kpc-1, using a slightly shorter measured inner bar length of 15” and assuming the pseudo-ring lies between corotation and the OLR of the inner bar (they find that the pseudo-ring molecular gas shows streaming motions indicative of a location beyond the CR).
The inclination of NGC 1068 is taken to be 40 (e.g. Schinnerer et al. 2000). The major axis PA is a matter of some uncertainty. From HI, at radii between 30” and 70”, where most of the CO emission is concentrated, Brinks et al. (1997) find a PA of . From OVRO CO 1–0 observations, Schinnerer et al. (2000) find that the PA is about outside , increasing within 10” of the nucleus to about 305. Helfer & Blitz (1995), using BIMA CO 1–0 data, found a PA of 264 in the region of the spiral arms, with a similar increase within 10” of the center as found by Schinnerer et al. (2000). It is clear from Figure 8 of Helfer et al. (2003), showing the BIMA SONG CO 1–0 velocity field, or Figure 3 of Dehnen et al. (1997), showing the H velocity field, that the kinematic major and minor axes are not parallel, presumably due to density wave streaming motions, complicating the choice of PA. We assume a PA of but test our results for sensitivity to this assumption. The kinematic center is determined to be at R.A. 02h42m40.6s, Dec. -0000′45′′ (2000.0), and the systemic velocity is km s-1 (Helfer & Blitz, 1995). The beam of the BIMA SONG data cube is 8.9”x5.5” (PA 15.5). The apertures are spaced by 6” and are shown in Figure 10.
That NGC 1068 is dominated by molecular gas over the mapped region is indicated by the global value of 3.1 (using our value of ), as well as a typical column density ratio of about 10 in the pseudo-ring, as estimated from the BIMA SONG zeroth-moment map and from the 21-cm data of Brinks et al. (1997).
The resulting – plot is shown in Figure 11. The best fit slope is km s-1 kpc-1, but the figure suggests that a single pattern may not be a good description of the data, with apertures that cross the region of the inner bar (8–11) indicating a somewhat steeper slope. A fit to just these apertures yields a slope of km s-1 kpc-1. A fit to the remaining apertures (that cross only the spiral) yields km s-1 kpc-1. As apertures 8–11 contain emission from both the inner bar and the pseudo-ring and disk, if two patterns are actually present with the outer pattern having the slower speed then the slope for these apertures represents a lower limit to the inner pattern speed. Thus, this result is at least consistent with the inner pattern speeds determined by Schinnerer et al. (2000) and Helfer & Blitz (1995), although the uncertainty is somewhat large. However, the slope for the remaining apertures is inconsistent with the outer pattern speed of Schinnerer et al. (2000).
The – plot for an assumed PA of 275, shown in Figure 12a, shows much more scatter than the plot for the nominal PA, with best fit slope to all apertures of km s-1 kpc-1. For a PA of 265, the best fit slope in the – plot (Figure 12b) is km s-1 kpc-1. The scatter noticeably worsens for PAs further from the nominal value, and we therefore conclude that the correct PA is within this range. We therefore allow that the PA may be uncertain by 5. As this is the dominant uncertainty in , we arrive at a best fit value for all apertures of km s-1 kpc-1. For apertures 8–11, taking into account the same uncertainty in PA, we find a best fit inner pattern speed of km s-1 kpc-1, still consistent with the two previous determinations but now with a large uncertainty. Similarly, using all apertures other than 8–11, we arrive at a best fit outer pattern speed of km s-1 kpc-1. Positive slope uncertainties correspond to positive PA uncertainties.
![[Uncaptioned image]](/html/astro-ph/0406426/assets/x12.png)

Our results indicate that the spiral/pseudo-ring is not a response to the inner bar pattern as found by Helfer & Blitz (1995); neither is it part of an outer pattern as slow as the one argued for by Schinnerer et al. (2000). By inspecting the CO velocity field in Figure 3a of Schinnerer et al. (2000), where the angular resolution is about three times better than in the CO map of Helfer & Blitz (1995), the radial streaming motions where the pseudo-ring crosses the minor axis on both sides of the nucleus indicate an inward radial motion within the arms, which is as expected for gas inside the CR of a pattern [e.g. Roberts et al. (1990); the sense is also in agreement with the bar model of Schinnerer et al. (2000) where the pseudo-ring is part of the outer pattern and located inside its CR; see below], not outside as argued for by Helfer & Blitz (1995). The streaming motions therefore support the conclusion that the pseudo-ring is not part of the inner bar pattern.
In the interpretation of Schinnerer et al. (2000), the iILR and oILR of the outer pattern roughly bound the spiral/pseudo-ring structure. In their Figure 7, showing curves of , and vs. radius [or Figure 18 of Helfer & Blitz (1995), which is based on the HI rotation curve of Brinks et al. (1997)], pattern speeds of about 35 km s-1 kpc-1 or greater would indeed result in two ILRs which bracket the pseudo-ring (although for their nominal choice of km s-1 kpc-1 there would be no iILR and the oILR would be near or greater). In particular, a pattern with speed 72 km s-1 kpc-1 as indicated by the TW method would have its iILR and oILR at 14” and 19”, respectively - a good match to the radial limits of the strong spiral structure. One should note, however, that there is some uncertainty, estimated by Schinnerer et al. (2000) to be km s-1 kpc-1, in the three curves in their Figure 7, which will affect the location of the resonances. It is also plausible that the CR of the inner pattern, at for pattern speeds of km s-1 kpc-1, coincides with one of the ILRs of the outer pattern, and this may be an example of non-linear mode coupling (Tagger et al., 1987; Masset & Tagger, 1997; Rautiainen & Salo, 1999), through which energy and momentum is efficiently transferred from the inner to the outer pattern, even if the patterns are relatively weak. However, we note that Rautiainen & Salo (1999) conclude from their simulations that mode coupling does not necessarily exist in all galaxies with multiple patterns. We also note that, for a pattern of speed 72 km s-1 kpc-1, corotation and the OLR of the outer pattern would be at roughly 50” and 72”, respectively [using Figure 18 of Helfer & Blitz (1995)], with fairly large uncertainties due to the shallow slopes of the and curves, such that the outer pattern, if it indeed has a radius of 120”, may extend well beyond its OLR.
The discrepancy between the outer pattern speeds from the TW method and Schinnerer et al. (2000) is unlikely to be due to the assumptions in the TW method being violated. The most likely cause for concern is the assumed value of and thus the molecule-dominance of the region covered by the BIMA SONG map. However, the oxygen abundances of four HII regions with galactocentric radii ranging from 20” to 50” are 12+log(O/H) (Evans & Dopita, 1987), close to the solar value of 8.81 (Aller, 1987). Based on the empirical calibration of vs. oxygen abundance from Boselli et al. (2002), the choice of the Galactic value would seem optimal, although there is considerable scatter. Thus we conclude that NGC 1068 is indeed most likely molecule-dominated in the region covered by the map.
3.2 NGC 3627
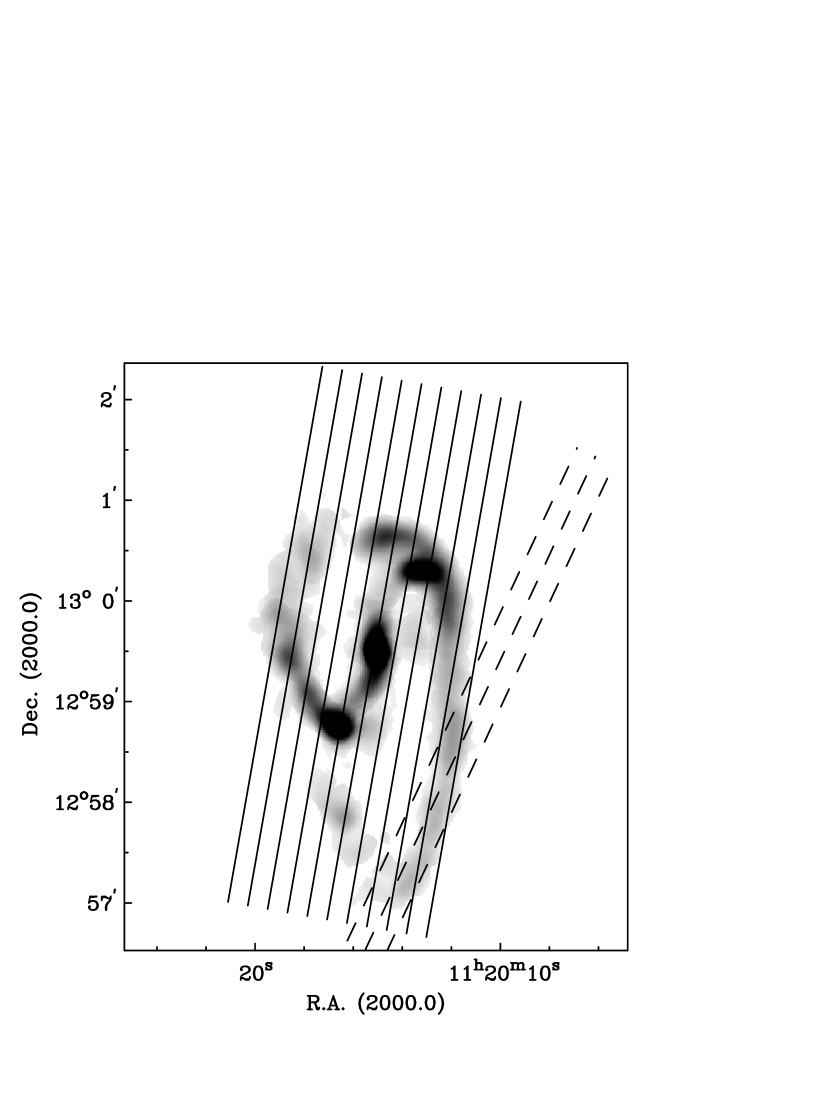
NGC 3627 (M66) is a member of the Leo Triplet (with NGC 3628 and NGC 3623), and is classified as SAB(s)b in the RC3 catalog. We adopt a distance of 11.1 Mpc, based on observations of Cepheid variables with the Hubble Space Telescope (Saha et al., 1999) . A spectrum of the nucleus indicates Liner/Seyfert 2 activity (Ho, Filippenko, & Sargent, 1997). HI observations (Rots, 1978; Haynes, Giovanelli, & Roberts, 1979) indicate a tidal encounter with NGC 3628, which has been modeled by Toomre (1978) and Rots (1978). The zeroth-moment CO map from the BIMA SONG data at 12” resolution (Figure 13) shows a two-arm barred spiral with an extension of one arm to the south. Here, and in near-IR images (Jarrett et al., 2003), the bar is long (about 2.6 kpc radius) and very linear. At full resolution, Regan et al. (2002) note in the BIMA SONG data weak emission 20” east and west of the bar which they interpret as tracing an inner ring. Emission from this structure is also seen in H emission in the Fabry-Perot data of Chemin et al. (2003). From the same data, these authors find overall kinematic parameters of km s-1, , PA= and a kinematic center at R.A. 11h20m15s, Dec. 1259′30′′ (2000.0). Unfortunately, the bar appears to be aligned very well with the major axis, and therefore the TW method may not be applicable to it. However, if the strong spiral structure is generated by the bar potential with the same pattern speed, then the TW method will indicate the speed of the bar/spiral. The southern extended arm does not lie in the same plane as the rest of the galaxy. Beyond about , Chemin et al. (2003) find and PA for this arm.

Assuming that the CR of the bar is at 1–1.4 bar radii (49–69”), Chemin et al. (2003) infer a bar pattern speed in the range km s-1 kpc-1. In support of this interpretation, they find evidence in the residual velocity field for the signature of a change in sign of the radial streaming motions induced by the pattern across the CR, as described by Canzian (1993), at . The low end of this range of places the inner m=4 resonance at the location of the inner ring. Sheth et al. (2002) find a bar pattern speed of 55 km s-1 kpc-1 by similarly assuming that the bar radius is 80% of the CR, but using a CO rotation curve from Das et al. (2001).
NGC 3627 is strongly molecule-dominated. The global molecular to atomic gas mass ratio within the optical disk is estimated by Reuter et al. (1996) to be about 7 (using our value of ). The radial profiles of Zhang, Wright, & Alexander (1993) indicate that the molecular-to-atomic gas column density ratio never drops below 7 within the detectable limit of emission in Figure 13.
The TW method was applied to moment maps made from the BIMA SONG data cube smoothed to 12” resolution. The 12”-spaced apertures used are shown for PA=170 in Figure 13 as the solid lines, and the – plot is shown in Figure 14. Apertures 1–3 are dominated by emission from the southern extension of the western arm, where and PA are both determined to be 15 smaller than for the rest of the disk, as discussed above. They obviously do not fit the relation as defined by the remaining apertures, and we consider them separately. The best fit slope to apertures 4–11 is km s-1 kpc-1. Allowing for the uncertainty in the PA quoted by Chemin et al. (2003), the best fit slope is km s-1 kpc-1, with positive uncertainties corresponding to positive PA uncertainties. This value is in reasonable agreement with the previous determinations of the bar’s pattern speed quoted above, and suggests that the spiral and bar may indeed form a pattern with a single speed. If so, then only the bright peaks at the very beginnings of the arms are inside the CR, which, using the rotation curve of Chemin et al. (2003), would fall at . Bright, narrow two-armed structure extends beyond this radius to about east and west of the nucleus in the plane of the galaxy (Figure 13). There is a hint of a similar extent in the near-IR (Jarrett et al., 2003), although the emission is faint. Such a situation is found generally for galaxies with large bars by Elmegreen & Elmegreen (1995).
For the southern extension of the western arm, using the three apertures for PA=155, shown as dashed lines in Figure 13, a best fit slope of km s-1 kpc-1 is found. Allowing for a uncertainty in the PA does not increase the uncertainty in the slope significantly. However, the result is more uncertain than the formal error bar would indicate as it is only based on three apertures, at least two of which probably contain emission from gas participating in both patterns, if the outer pattern begins at the radius where and PA begin to change. We therefore conclude only tentatively that this arm segment may represent a distinct pattern.
3.3 NGC 4321
NGC 4321 (M100) is a well-studied grand-design spiral galaxy in the Virgo Cluster, carrying a classification of SAB(s)bc in the RC3 catalog. We use the Cepheid-based distance of 16.1 Mpc (Ferrarese et al., 1996). The central region includes a bar of length and PA (e.g. Sakamoto et al. 1995; Sempere et al. 1995; Knapen et al. 1995a, b; Wada, Sakamoto, & Minezaki 1998; Knapen et al. 2000). Using hydrodynamical simulations and a potential derived from an analytical bar model, Wada et al. (1998) conclude that a bar with a pattern speed of about 70 km s-1 kpc-1 produces gas morphology and kinematics in best agreement with CO data. For the disk, Sempere et al. (1995) used two methods to estimate the pattern speed. The first is the method of Canzian (1993, see above), through which a value of about 29 km s-1 kpc-1 (scaled to the inclination of 27 that we adopt below) was found. The second involves numerical hydrodynamic simulations of the response of a cloud population to a potential derived from an image of the galaxy in red light. This method indicated a pattern speed of about 25 km s-1 kpc-1, which must also be scaled to account for the different assumed inclinations (they assumed ), although this scaling is presumably model-dependent. Elmegreen et al. (1989) find that a pattern with a speed of about 27 km s-1 kpc-1 (again scaled to our adopted inclination) for the disk has its ILR and OLR roughly bounding the extent of the spiral structure, with gaps in the I-band light at the 4:1 resonance and the CR. Rand (1995) estimates a value of km s-1 kpc-1 by identifying the CR with the location where the southern CO arm in his BIMA map crosses the major axis, where tangential streaming motions all but vanish. Sheth et al. (2002) identify a large bar of radius 54” in a -band image (see also Das et al. 2003) associated with the inner molecular spiral structure. Using the same assumptions as for NGC 3627, they derive a pattern speed of 40 km s-1 kpc-1 (again scaled to our assumed inclination). If the bulk of the CO emission morphology outside the inner bar is due to this stellar bar potential, then Sheth et al. (2002) should be measuring the same pattern as in the other studies.
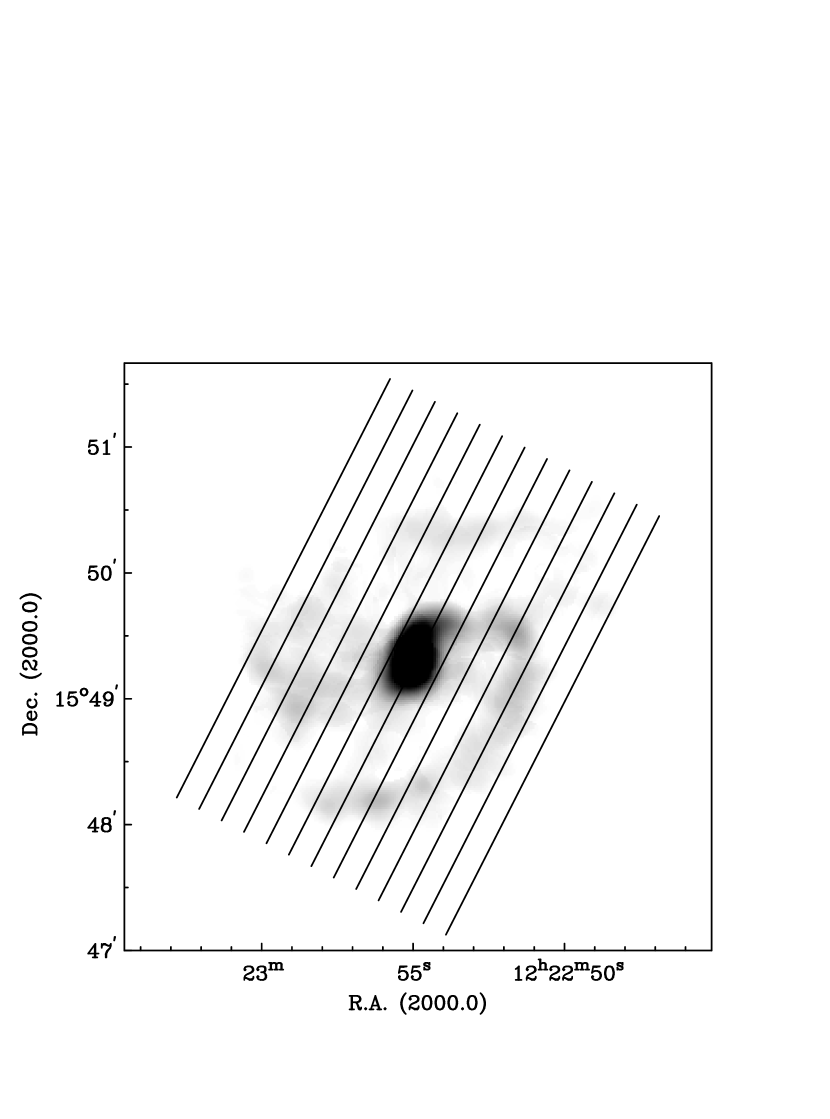

We use the kinematic center of R.A. 12h22m55.0s, Dec. 1549′20′′ (2000.0), PA of 153, and km s-1 from the CO study of Sempere & Garcia-Burillo (1997), and from the analysis of VLA 21-cm data by Knapen et al. (1993). The kinematic center and systemic velocity agree well with values derived from interferometric CO data by Sakamoto et al. (1995). We found uncertainty in the results was decreased significantly after smoothing the data cube to 12” resolution. The 12”-spaced apertures used are shown in Figure 15. Note that the nominal major axis PA is equal to that of the inner bar, and thus it should have no signature in the TW method.
At the detection limit of CO in the BIMA SONG map, at about , we estimate the ratio of molecular to atomic column density to be about 1.2–1.7 (using our value of ), the range largely determined by whether the CO data used derive from the BIMA SONG zeroth-moment map, or the single-dish data of Knapen et al. (1996), Kenney & Young (1988), or Sempere & Garcia-Burillo (1997). The HI data are from Knapen et al. (1993). Within this radius, the CO intensity rises while the 21-cm intensity stays flat, eventually falling in the central regions. Hence, we assume this galaxy is molecule-dominated over the region of detectable CO in the BIMA SONG map.
In Figure 16, we show the – plot. The best fit slope is km s-1 kpc-1. Aperture 1, which has somewhat extreme values of and relative to Apertures 2–10 may significantly bias the fit. However, without this aperture, the slope becomes km s-1 kpc-1, equal to the above value within the uncertainties. It is very difficult to put constraints on possible errors in the PA. An analysis of the rotation curve using the GIPSY program ROTCUR on the first-moment map, fixing the systemic velocity, inclination and kinematic center at their above values, indicates a very constant PA of at . Inside this radial range, the PA is generally larger but varies greatly, between 144 and 171, due to very strong streaming motions which are obvious in the first-moment map of, e.g., Sempere & Garcia-Burillo (1997). Beyond there are few data points. If we allow for an uncertainty of in the PA, the best fit slope becomes km s-1 kpc-1, where the error bars incorporate the PA uncertainty and the scatter in the – plot for the nominal PA. Positive slope uncertainties correspond to positive PA uncertainties. This value agrees within the error bars with the above pattern speed determinations for the disk by Sempere et al. (1995) and Elmegreen et al. (1989), using three independent methods, and is somewhat lower than the upper limit found by Rand (1995) and the large-scale bar pattern speed inferred by Sheth et al. (2002). We therefore conclude that the pattern speed for the disk of NGC 4321 is fairly robustly determined.
3.4 NGC 4414
NGC 4414 is a flocculent spiral classified as SA(rs)c? in the RC3 catalog. Thornley & Mundy (1997) analyze a -band image, making an attempt to correct it for contamination by supergiants, and find that despite the flocculent optical appearance there are smooth, kpc-scale coherent features in the old stellar disk. Most noticeable is a patchy ring structure of radius 20”. However, it is unclear what large-scale dynamical influence might be responsible for these features. Hence it is not clear whether large-scale density waves exist in this galaxy, let alone whether there is only one pattern or more. The first-moment map (their Figure 9) indicates a very regular velocity field, lacking the characteristic wiggles in the iso-velocity contours that would suggest density wave streaming motions. Furthermore, they find from a BIMA (combined with single-dish data) map at about 3” resolution that, although the flocculent molecular structure shows some correlation with the coherent -band structure (especially the ring evident in Figure 17), there are many molecular peaks which do not follow this relation, suggesting a significant role for stochastic effects. The TW method can of course be attempted, but the result may not be identifiable as a pattern speed.
We adopt a Cepheid-based distance of 19.1 Mpc (Turner et al., 1998). The CO and HI velocity fields were studied by Thornley & Mundy (1997). Their CO rotation curve analysis indicates , PA=160, and km s-1. We also adopt their central position of R.A. 12h26m27.1s, Dec. 3113′24′′ (2000.0). The beam for the BIMA SONG data is 6.4”x5.0” (PA 5). Figure 17 shows the zeroth-moment map and the apertures used. The apertures are spaced by 6”.
Figure 8 of Thornley & Mundy (1997) demonstrates that the ISM of NGC 4414 is molecule-dominated. The ratio of molecular to atomic surface density (with our value of ) is everywhere over the region where emission is detected in the BIMA SONG map.
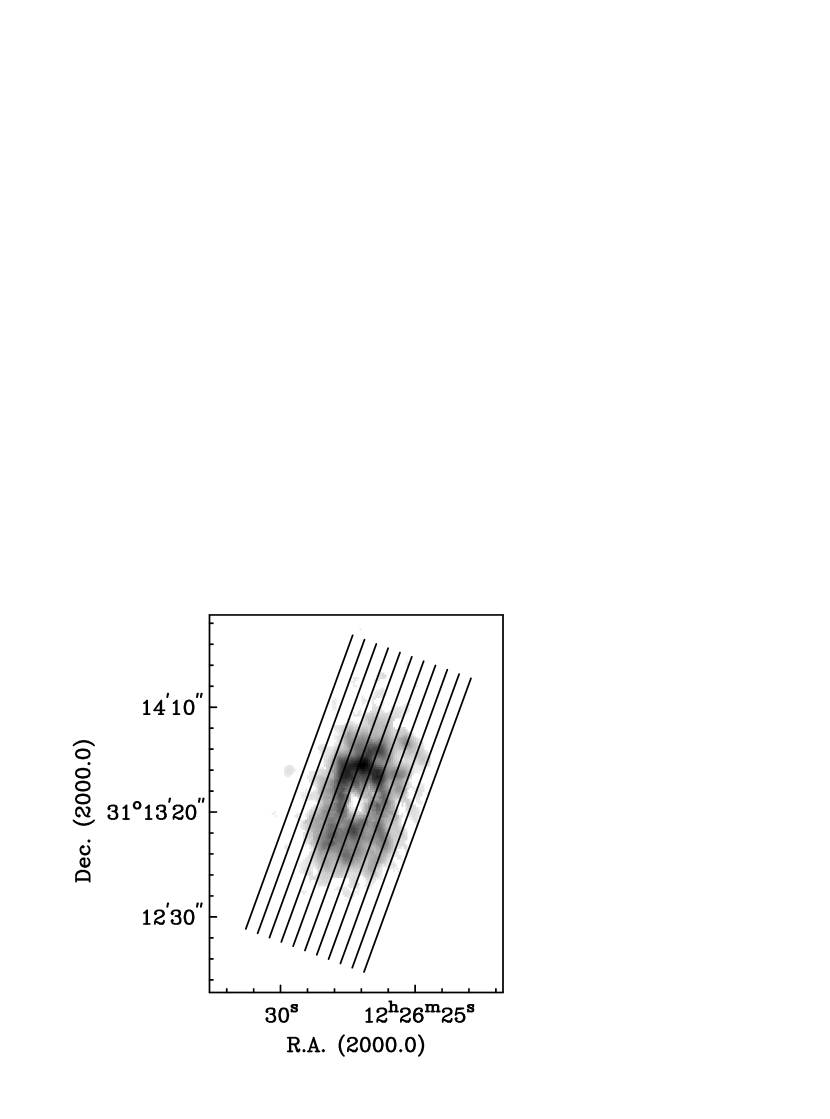

Figure 18 shows the – plot. There is no well defined slope and thus no indication of a simple pattern in this galaxy. Even eliminating the discrepant Aperture 1, a fit to the remaining apertures yields a very uncertain slope of km s-1 kpc-1. The points are almost all found in positive-, negative- quadrant because the patchy ring is brighter on the approaching side of the galaxy for almost all apertures. Better correlations in the – plot start to appear for PA’s of only away from the nominal value, but the ROTCUR analysis of Thornley & Mundy (1997) (their Figure 11) indicates that the PA is well determined to within about or so, due to the very regular velocity field. The correlations are therefore certainly due to the PA error, as found for the simulations of the tilted, axisymmetric clumpy disk (§3.1), which this galaxy’s CO distribution resembles. Given the lack of evidence for a pattern in this galaxy, we cannot conclude that we have measured the speed of any pattern.
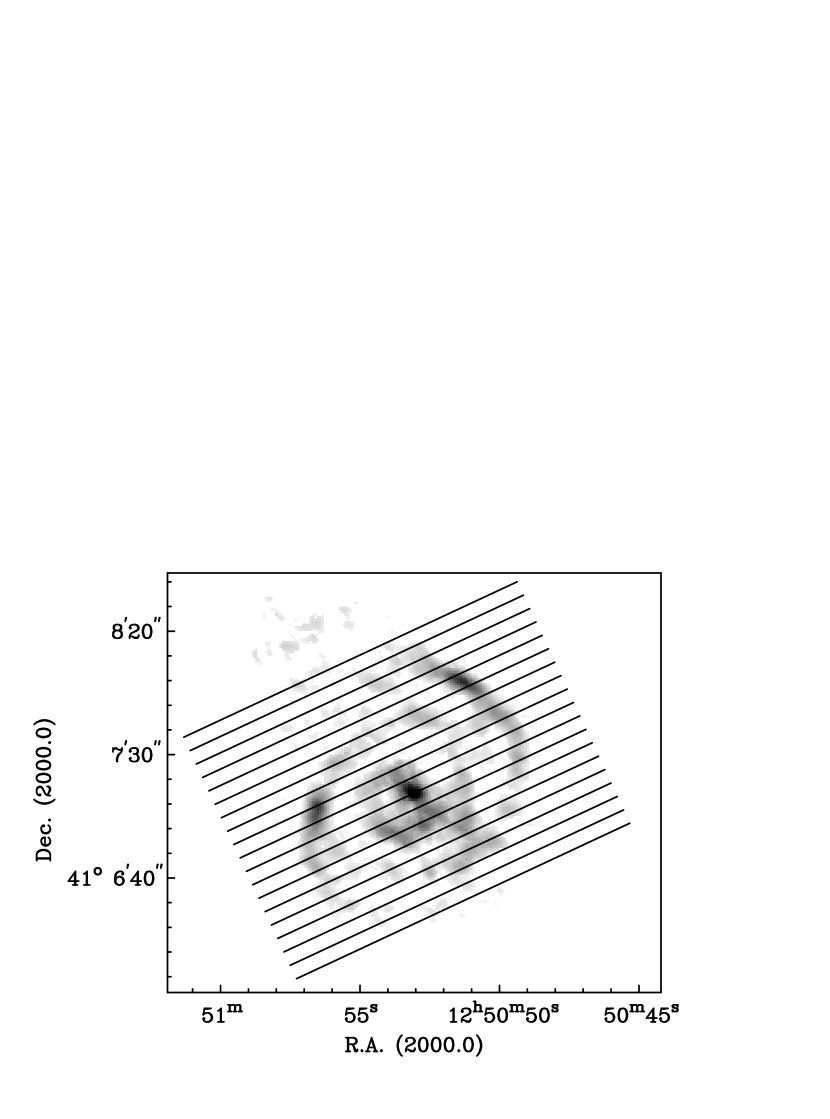
3.5 NGC 4736
NGC 4736 (M94) is classified as (R)SA(r)ab in the RC3 catalog and is also classified as a LINER (Heckman, 1980). We adopt the distance of 4.2 Mpc used by Wong & Blitz (2000). The galaxy features a bar of radius , seen in the near-IR (Moellenhoff, Matthias, & Gerhard, 1995) and CO (Figure 19; Wong & Blitz 2000; Sakamoto et al. 1999), and a ring of star formation of radius visible in the H image of Pogge (1989). While quite ringlike in H emission, the corresponding structure in CO is a pair of tightly wrapped spiral arms (see Figure 19 of Wong & Blitz 2000). Optical images also reveal a faint outer stellar ring of radius . Gerin, Casoli, & Combes (1991) find that the disk is nonaxisymmetric, and suggest that the spiral/ring and the outer ring may be located at the ILR and OLR of an oval potential, deriving a pattern speed of 45 km s-1 kpc-1. Moellenhoff et al. (1995) suggest, based on their bar models and those of Schwarz (1981), that the inner spiral/ring represents gas transported outward by the bar to near its OLR (thus its OLR roughly coincides with the ILR of the outer pattern), and thus find a bar pattern speed of about 460 km s-1 kpc-1. Wong & Blitz (2000) analyze CO (from the BIMA SONG data) and HI rotation curves and conclude that, if the gas spiral/ring is at the OLR of the bar, its pattern speed must also be high, around 400 km s-1 kpc-1. CR is at about 1.3 bar radii, or 26”, for this speed. They also find about the same pattern speed for the oval distortion as found by Gerin et al. (1991), under the same assumptions regarding the ILR and OLR, but the uncertainties are large due to the poorly determined HI rotation curve in the outer disk. Furthermore, Wong & Blitz (2000) note that the deprojected bar and oval are neither aligned nor orthogonal, and thus cannot be sustained by a single pattern as shown by Louis & Gerhard (1988).
We take kinematic parameters from the CO rotation curve analysis of Wong & Blitz (2000): km s-1, R.A. 12h50m53.1s, Dec. 4107′14′′ (2000.0), PA= (although it rises from to between and ). They adopted the photometric inclination of 35 from Moellenhoff et al. (1995) which we will also use. The beam for the BIMA SONG data is 6.9”x5.0” (PA 63).
The radial profiles of Wong & Blitz (2000) show that the galaxy is molecule-dominated in the region detected in CO in the BIMA SONG survey. Almost all of the emission is within 1’ from the center, where the ratio of molecular to atomic hydrogen column density is 2 or greater (using our value of X).
The apertures used are shown in Figure 19, and the resulting – plot is shown in Figure 20. A clear correlation is present. The best fit slope to all apertures is km s-1 kpc-1. Apertures 9–13 cross the central bar and may be affected by more than one pattern. In Figure 20, it is clear that a line fit to these apertures would have a higher slope. For these apertures alone, the best fit slope is km s-1 kpc-1. For the remaining apertures, the best fit slope is km s-1 kpc-1.

We assess the effects of PA errors by considering the above 10 range of PA found for the radial range of detected CO emission by Wong & Blitz (2000). For all apertures, the best fit slope becomes km s-1 kpc-1, with larger values corresponding to smaller choices of PA. For apertures 9–13 alone, the uncertainties due to this range of possible PA is insignificant compared to the formal uncertainty above. For all apertures other than 9–13, the best fit slope becomes km s-1 kpc-1.
The value for the central apertures is at least consistent with the fast bar argued for by Wong & Blitz (2000), although the uncertainties are large and emission in these apertures may arise from gas participating in more than one pattern. The value for the disk outside the central bar is much larger than the pattern speed of 45 km s-1 kpc-1 argued for by Gerin et al. (1991). Using the resonance diagram (Figure 9) of Wong & Blitz (2000), this larger pattern speed would place CR just outside the gas spiral/ring, at about . The OLR would be at about . There may be one or two ILRs, at around , but these placements are uncertain due to the large error bars in the determination of the curve.
Nevertheless, can a sensible explanation of the resonance locations and associated structures be found for this larger pattern speed? Within the large uncertainties, the ILR(s) of the outer pattern may coincide with the CR of the inner bar, thus making this galaxy another potential example of mode coupling. Given these uncertainties, coupling involving coincidence of the inner 4:1 resonance of the outer pattern with the CR of the inner one, which is found by Rautiainen & Salo (1999) to be more common than CR-ILR coupling, is also possible.
The CR of the outer pattern would be just outside the bright CO emission and star formation. Elmegreen et al. (1989) argued for this arrangement for M81 and M100, and indeed their derived pattern speed for M100 agrees with the two estimates of Sempere et al. (1995) and our analysis above. The outer stellar ring at may not be associated with any resonance of these patterns and could potentially be due to a third pattern. However, it may have a more natural explanation if it is indeed at the OLR of a 45 km s-1 kpc-1 outer pattern, as the ratio of its radius to the spiral/ring radius is close to the ratio of the OLR to ILR radius of 5.8 for a single pattern with a flat rotation curve (Wong & Blitz, 2000). Nevertheless, the assumptions for the TW method are quite well satisfied for this galaxy (especially for the apertures that do not cross the bar). As for NGC 1068, the most likely concern is that may be lower for this galaxy than assumed, calling into doubt the molecular-dominance of the region covered by the BIMA SONG map. However, the oxygen abundances of nine HII regions with galactocentric radii ranging from 35” to 135” are in the range 12+log(O/H) (Oey & Kennicutt, 1993), again close to the solar value of 8.81 (Aller, 1987), suggesting that the choice of the Galactic value of is reasonable. Hence, we conclude that the ISM of the region we analyze is indeed most likely dominated by molecular gas, and thus our application of the TW method should be well justified.
3.6 NGC 4826
NGC 4826 (M64) is classified as (R)SA(rs) in the RC3 catalog. It is also well known as the Evil Eye galaxy as a result of its dust morphology, and features an outer disk of gas which rotates in the opposite sense to the stars and gas in the inner disk (Braun, Walterbos, & Kennicutt 1992; van Driel & Buta 1993; Casoli & Gerin 1993; Braun et al. 1994; Rix et al. 1995). Braun et al. (1994) find that the inner disk shows well ordered rotation within 1’ (1.1 kpc at their assumed distance of 3.8 Mpc, which we also assume here) of the nucleus, outside of which is a region of disturbed kinematics and, beyond a radius of 200”, the counterrotating gas disk seen in 21-cm emission. These authors conclude that the counterrotating HI gas was accreted during an interaction or in a continuous process. Braun et al. (1994) find that the intermediate region shows a signature of infalling HI gas, although Rix et al. (1995) find that the ionized gas kinematics in this region are more complex than a simple infall model would predict. Our zeroth-moment map from the BIMA SONG data (Figure 21) reveals CO emission out to a radius of about 50”, and thus all the molecular gas detected is in the inner disk. García-Burillo et al. (2003) observe CO 1–0 and 2–1 emission with the IRAM Plateau de Bure interferometer and find evidence for a prominent mode in the gas in the inner 1 kpc through the observation of two molecular arms on opposite sides of the galaxy occupying distinct radial ranges (11–16” and 16–33”, respectively). The inner arm shows evidence of radial outflow, while the outer arm shows a radial inflow signature, and thus the authors suggest that the inner arm is located outside the CR of a fast mode ( km s-1 kpc-1; placing CR near 100 pc, well inside the inner arm) while the outer arm is part of a stationary mode, which is found in simulations of galaxies with counter-rotation (García-Burillo et al., 2000). The F450W Hubble Space Telescope image of García-Burillo et al. (2003) suggests a rather flocculent spiral in the central 1 kpc.
We adopt a PA of , inclination of 60, dynamical center of R.A. 12h56m43.7s, Dec. 2140′59′′ (2000.0), and km s-1 from the CO kinematic study of García-Burillo et al. (2003). The beam for the BIMA SONG data is 7.5”x5.2” (PA 3).
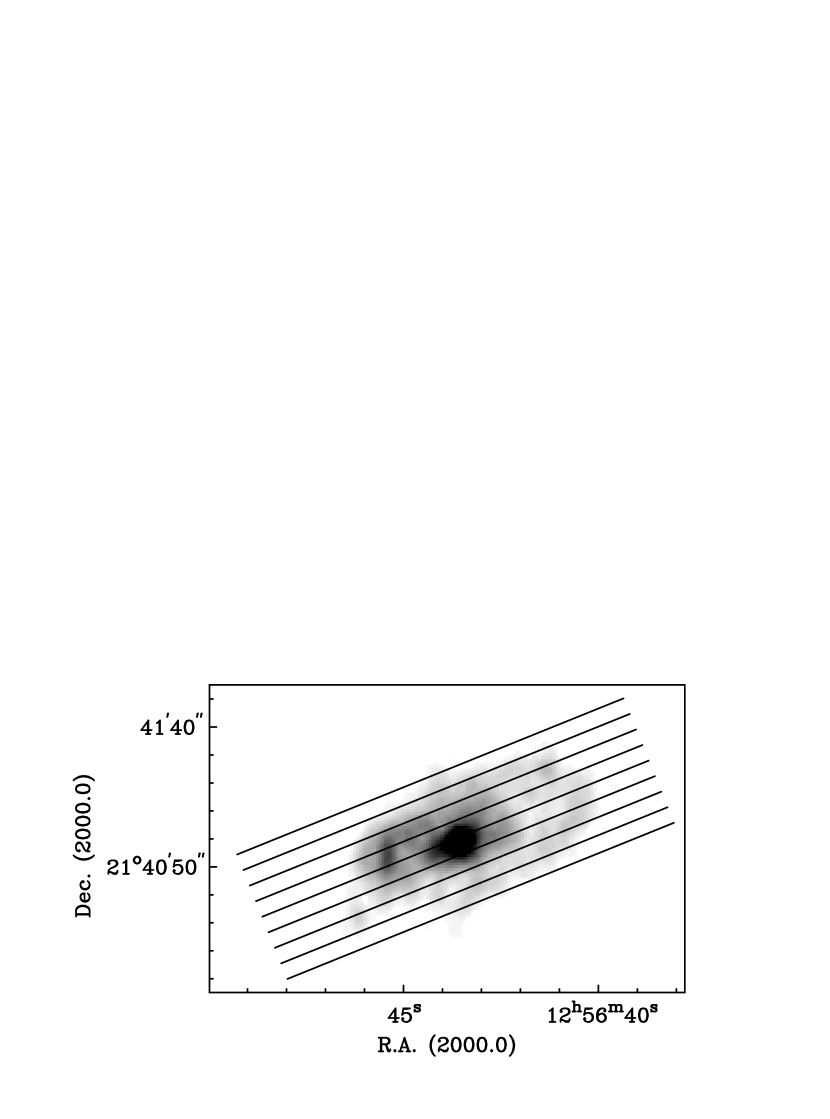

In the normally rotating inner disk, Casoli & Gerin (1993) measured a molecular mass of M (scaled to our value of ) with the IRAM 30-m telescope, while the HI mass in the same region is M (Braun et al., 1994), so that the region of the ISM over which CO is detected in the BIMA SONG map (within ) is clearly molecule-dominated.
The apertures used are shown in Figure 21, overlaid on a zeroth-moment map of the BIMA SONG data cube. The resulting – plot is shown in Figure 22. There is a well-defined slope whose best fit value is km s-1 kpc-1. However, many pieces of evidence suggest that there is no pattern here. First, there is no clear sequence of aperture numbers in Figure 22, suggesting that random clumpiness may dominate the integrals used to calculate and . The values of and are also small, with absolute values of reaching no more than 8” even for the apertures furthest from the major axis. Second, for our simulated clumpy, axisymmetric disk, we found that the slope in the – plot reflected the slope of the rotation curve. We have used ROTCUR to determine a rotation curve from a first-moment map. We exclude points within of the minor axis, and fix the kinematic center, systemic velocity, PA and inclination at their above values. We also assume no expansion. We fit and plot approaching and receding sides separately to allow the general velocity gradient to be seen. The resulting rotation curve is shown in Figure 23. Also plotted are lines representing the best fit linear slope of the rotation curve of km s-1 kpc-1, and the best fit slope for the data in Figure 22. These slopes agree well. Therefore, the best fit slope may simply be reflecting the gradient in the rotation curve. Third, there is no evidence for any strong bar or spiral structure in near-IR images of NGC 4826 (Möllenhoff & Heidt, 2001). Therefore, despite the evidence for radial motions presented by García-Burillo et al. (2003), it seems doubtful that the best fit slope for the apertures in Figure 22 is indicative of a pattern speed.

4 Summary and Conclusions
In this paper we have carried out experiments using a simulated barred galaxy which have demonstrated the effectiveness of the TW method, and we have tested the method on a clumpy, axisymmetric gas disk with no wave. We have shown in the former case that a correlation can naturally appear in – plots even when no large-scale wave is present. Our bar simulations showed that the TW method is robust, even at poor angular resolution, except when the bar becomes too closely aligned with one of the principle axes.
We have applied the method to high-resolution CO data cubes with full flux information for six galaxies from the BIMA SONG survey, each of which has an ISM dominated by molecular gas. This work builds on the initial exploration of this application of the TW method by ZRM.
For the two spiral galaxies with bars closely aligned with a principle axis, NGC 3627 and NGC 4321, we find spiral pattern speeds in agreement with previous determinations by other means. For the two barred galaxies NGC 1068 and NGC 4736, where the bar is not closely aligned with either principle axis, we have found some evidence that the bar and spiral patterns rotate with different speeds, the same conclusion made for M51 by ZRM. Unfortunately, the nature of the method has made it difficult to determine unambiguously the bar pattern speed in these cases because apertures which cross the bar also include emission from the spiral. Higher resolution observations would allow more independent apertures to be placed across the bar region, reducing the formal error in the best fit slope, but the above ambiguity would still remain. Nevertheless, the results demonstrate the power of the TW method to address observationally the long standing question of how bar and spiral pattern speeds relate. Our results for the spiral patterns in these two galaxies disagree with previous determinations based on identifying predicted behaviors at resonance locations. However, it is also possible to interpret our results in such terms with some success, including tentative indications of mode coupling. Our results for NGC 4414 and NGC 4826, along with our tests on a simulated clumpy disk, demonstrate that one must exercise caution in applying the TW method to galaxies for which there is little evidence of a large-scale wave.
As mentioned in the Introduction, further work will focus on galaxies with HI-dominated ISMs and those with substantial amounts of both molecular and atomic gas, from the BIMA SONG survey and elsewhere in the literature.
References
- Aguerri et al. (1998) Aguerri, J. A. L., Beckman, J. E., & Prieto, M. 1998, AJ, 116, 2136
- Aller (1987) Aller, L. H. 1987, in Spectroscopy of Astrophysical Plasmas, 89–124
- Arimoto et al. (1996) Arimoto, N., Sofue, Y., & Tsujimoto, T. 1996, PASJ, 48, 275
- Bertin (1994) Bertin, G. 1994, in ASP Conf. Ser. 66: Physics of the Gaseous and Stellar Disks of the Galaxy, 35–+
- Bland-Hawthorn et al. (1997) Bland-Hawthorn, J., Gallimore, J. F., Tacconi, L. J., Brinks, E., Baum, S. A., Antonucci, R. R. J., & Cecil, G. N. 1997, Ap&SS, 248, 9
- Boselli et al. (2002) Boselli, A., Lequeux, J., & Gavazzi, G. 2002, A&A, 384, 33
- Braun et al. (1992) Braun, R., Walterbos, R. A. M., & Kennicutt, R. C. 1992, Nature, 360, 442
- Braun et al. (1994) Braun, R., Walterbos, R. A. M., Kennicutt, R. C., & Tacconi, L. J. 1994, ApJ, 420, 558
- Brinks et al. (1997) Brinks, E., Skillman, E. D., Terlevich, R. J., & Terlevich, E. 1997, Ap&SS, 248, 23
- Bureau et al. (1999) Bureau, M., Freeman, K. C., Pfitzner, D. W., & Meurer, G. R. 1999, AJ, 118, 2158
- Canzian (1993) Canzian, B. 1993, ApJ, 414, 487
- Casoli & Gerin (1993) Casoli, F., & Gerin, M. 1993, A&A, 279, L41
- Chemin et al. (2003) Chemin, L., Cayatte, V., Balkowski, C., Marcelin, M., Amram, P., van Driel, W., & Flores, H. 2003, A&A, 405, 89
- Contopoulos (1980) Contopoulos, G. 1980, A&A, 81, 198
- Contopoulos & Grosbol (1986) Contopoulos, G., & Grosbol, P. 1986, A&A, 155, 11
- Das et al. (2001) Das, M., Teuben, P. J., Vogel, S. N., Harris, A., Regan, M. W., Sheth, K., Helfer, T. T., & Thornley, M. D. 2001, Bulletin of the American Astronomical Society, 33, 1391
- Das et al. (2003) Das, M., Teuben, P. J., Vogel, S. N., Regan, M. W., Sheth, K., Harris, A. I., & Jefferys, W. H. 2003, ApJ, 582, 190
- de Vaucouleurs et al. (1991) de Vaucouleurs, G., de Vaucouleurs, A., Corwin, H. G., Buta, R. J., Paturel, G., & Fouque, P. 1991, Third Reference Catalogue of Bright Galaxies (Volume 1-3, XII, 2069 pp. 7 figs.. Springer-Verlag Berlin Heidelberg New York)
- Debattista (2003) Debattista, V. P. 2003, MNRAS, 342, 1194
- Debattista et al. (2002) Debattista, V. P., Gerhard, O., & Sevenster, M. N. 2002, MNRAS, 334, 355
- Dehnen et al. (1997) Dehnen, W., Bland-Hawthorn, J., Quirrenbach, A., & Cecil, G. N. 1997, Ap&SS, 248, 33
- Dumke et al. (1997) Dumke, M., Braine, J., Krause, M., Zylka, R., Wielebinski, R., & Guelin, M. 1997, A&A, 325, 124
- Elmegreen et al. (1996) Elmegreen, B. G., Elmegreen, D. M., Chromey, F. R., Hasselbacher, D. A., & Bissell, B. A. 1996, AJ, 111, 2233
- Elmegreen et al. (1989) Elmegreen, B. G., Elmegreen, D. M., & Seiden, P. E. 1989, ApJ, 343, 602
- Elmegreen et al. (1998) Elmegreen, B. G., Wilcots, E., & Pisano, D. J. 1998, ApJ, 494, L37+
- Elmegreen & Elmegreen (1995) Elmegreen, D. M., & Elmegreen, B. G. 1995, ApJ, 445, 591
- Evans & Dopita (1987) Evans, I. N., & Dopita, M. A. 1987, ApJ, 319, 662
- Ferrarese et al. (1996) Ferrarese, L., Freedman, W. L., Hill, R. J., Saha, A., Madore, B. F., Kennicutt, R. C., Stetson, P. B., Ford, H. C., Graham, J. A., Hoessel, J. G., Han, M., Huchra, J., Hughes, S. M., Illingworth, G. D., Kelson, D., Mould, J. R., Phelps, R., Silbermann, N. A., Sakai, S., Turner, A., Harding, P., & Bresolin, F. 1996, ApJ, 464, 568
- Friedli & Martinet (1993) Friedli, D., & Martinet, L. 1993, A&A, 277, 27
- Garcia-Burillo et al. (1993) Garcia-Burillo, S., Combes, F., & Gerin, M. 1993, A&A, 274, 148
- García-Burillo et al. (2003) García-Burillo, S., Combes, F., Hunt, L. K., Boone, F., Baker, A. J., Tacconi, L. J., Eckart, A., Neri, R., Leon, S., Schinnerer, E., & Englmaier, P. 2003, A&A, 407, 485
- García-Burillo et al. (2000) García-Burillo, S., Sempere, M. J., Combes, F., Hunt, L. K., & Neri, R. 2000, A&A, 363, 869
- Gerin et al. (1991) Gerin, M., Casoli, F., & Combes, F. 1991, A&A, 251, 32
- Gerssen et al. (2003) Gerssen, J., Kuijken, K., & Merrifield, M. R. 2003, MNRAS, 345, 261
- Haynes et al. (1979) Haynes, M. P., Giovanelli, R., & Roberts, M. S. 1979, ApJ, 229, 83
- Heckman (1980) Heckman, T. M. 1980, A&A, 87, 152
- Helfer & Blitz (1995) Helfer, T. T., & Blitz, L. 1995, ApJ, 450, 90
- Helfer et al. (2003) Helfer, T. T., Thornley, M. D., Regan, M. W., Wong, T., Sheth, K., Vogel, S. N., Blitz, L., & Bock, D. C.-J. 2003, ApJS, 145, 259
- Hernquist (1993) Hernquist, L. 1993, ApJS, 86, 389
- Hernquist & Katz (1989) Hernquist, L., & Katz, N. 1989, ApJS, 70, 419
- Ho et al. (1997) Ho, L. C., Filippenko, A. V., & Sargent, W. L. W. 1997, ApJS, 112, 315
- Jarrett et al. (2003) Jarrett, T. H., Chester, T., Cutri, R., Schneider, S. E., & Huchra, J. P. 2003, AJ, 125, 525
- Kenney & Young (1988) Kenney, J. D., & Young, J. S. 1988, ApJS, 66, 261
- Kennicutt (1998) Kennicutt, R. C. 1998, ARA&A, 36, 189
- Knapen et al. (1996) Knapen, J. H., Beckman, J. E., Cepa, J., & Nakai, N. 1996, A&A, 308, 27
- Knapen et al. (1992) Knapen, J. H., Beckman, J. E., Cepa, J., van der Hulst, T., & Rand, R. J. 1992, ApJ, 385, L37
- Knapen et al. (1995a) Knapen, J. H., Beckman, J. E., Heller, C. H., Shlosman, I., & de Jong, R. S. 1995a, ApJ, 454, 623
- Knapen et al. (1995b) Knapen, J. H., Beckman, J. E., Shlosman, I., Peletier, R. F., Heller, C. H., & de Jong, R. S. 1995b, ApJ, 443, L73
- Knapen et al. (1993) Knapen, J. H., Cepa, J., Beckman, J. E., Soledad del Rio, M., & Pedlar, A. 1993, ApJ, 416, 563
- Knapen et al. (2000) Knapen, J. H., Shlosman, I., Heller, C. H., Rand, R. J., Beckman, J. E., & Rozas, M. 2000, ApJ, 528, 219
- Lin (1970) Lin, C. C. 1970, in IAU Symp. 38: The Spiral Structure of our Galaxy, 377–+
- Lord & Kenney (1991) Lord, S. D., & Kenney, J. D. P. 1991, ApJ, 381, 130
- Louis & Gerhard (1988) Louis, P. D., & Gerhard, O. E. 1988, MNRAS, 233, 337
- Lubow (1993) Lubow, S. 1993, PASP, 105, 664
- Möllenhoff & Heidt (2001) Möllenhoff, C., & Heidt, J. 2001, A&A, 368, 16
- Masset & Tagger (1997) Masset, F., & Tagger, M. 1997, A&A, 322, 442
- Merrifield et al. (2001) Merrifield, M. R., Gerssen, J., & Kuijken, K. 2001, in ASP Conf. Ser. 230: Galaxy Disks and Disk Galaxies, 221–224
- Merrifield & Kuijken (1995) Merrifield, M. R., & Kuijken, K. 1995, MNRAS, 274, 933
- Moellenhoff et al. (1995) Moellenhoff, C., Matthias, M., & Gerhard, O. E. 1995, A&A, 301, 359
- Oey & Kennicutt (1993) Oey, M. S., & Kennicutt, R. C. 1993, ApJ, 411, 137
- Ostriker & Peebles (1973) Ostriker, J. P., & Peebles, P. J. E. 1973, ApJ, 186, 467
- Pfenniger & Norman (1990) Pfenniger, D., & Norman, C. 1990, ApJ, 363, 391
- Pogge (1989) Pogge, R. W. 1989, ApJS, 71, 433
- Puerari & Dottori (1997) Puerari, I., & Dottori, H. 1997, ApJ, 476, L73+
- Rand (1993) Rand, R. J. 1993, ApJ, 410, 68
- Rand (1995) —. 1995, AJ, 109, 2444
- Rautiainen & Salo (1999) Rautiainen, P., & Salo, H. 1999, A&A, 348, 737
- Regan et al. (2002) Regan, M. W., Sheth, K., Teuben, P. J., & Vogel, S. N. 2002, ApJ, 574, 126
- Reuter et al. (1996) Reuter, H.-P., Sievers, A. W., Pohl, M., Lesch, H., & Wielebinski, R. 1996, A&A, 306, 721
- Rix et al. (1995) Rix, H. R., Kennicutt, R. C., Braun, R., & Walterbos, R. A. M. 1995, ApJ, 438, 155
- Roberts et al. (1990) Roberts, W. W., Lowe, S. A., & Adler, D. S. 1990, New York Academy Sciences Annals, 596, 130
- Rots (1978) Rots, A. H. 1978, AJ, 83, 219
- Sage (1993) Sage, L. J. 1993, A&A, 272, 123
- Saha et al. (1999) Saha, A., Sandage, A., Tammann, G. A., Labhardt, L., Macchetto, F. D., & Panagia, N. 1999, ApJ, 522, 802
- Sakamoto et al. (1995) Sakamoto, K., Okumura, S., Minezaki, T., Kobayashi, Y., & Wada, K. 1995, AJ, 110, 2075
- Sakamoto et al. (1999) Sakamoto, K., Okumura, S. K., Ishizuki, S., & Scoville, N. Z. 1999, ApJS, 124, 403
- Sambhus & Sridhar (2000) Sambhus, N., & Sridhar, S. 2000, ApJ, 539, L17
- Schinnerer et al. (2000) Schinnerer, E., Eckart, A., Tacconi, L. J., Genzel, R., & Downes, D. 2000, ApJ, 533, 850
- Schwarz (1981) Schwarz, M. P. 1981, ApJ, 247, 77
- Scoville et al. (1988) Scoville, N. Z., Matthews, K., Carico, D. P., & Sanders, D. B. 1988, ApJ, 327, L61
- Sellwood & Sparke (1988) Sellwood, J. A., & Sparke, L. S. 1988, MNRAS, 231, 25P
- Sempere & Garcia-Burillo (1997) Sempere, M. J., & Garcia-Burillo, S. 1997, A&A, 325, 769
- Sempere et al. (1995) Sempere, M. J., Garcia-Burillo, S., Combes, F., & Knapen, J. H. 1995, A&A, 296, 45
- Sheth et al. (2002) Sheth, K., Vogel, S. N., Regan, M. W., Teuben, P. J., Harris, A. I., & Thornley, M. D. 2002, AJ, 124, 2581
- Shu (1970) Shu, F. H. 1970, ApJ, 160, 89
- Tagger et al. (1987) Tagger, M., Sygnet, J. F., Athanassoula, E., & Pellat, R. 1987, ApJ, 318, L43
- Thornley & Mundy (1997) Thornley, M. D., & Mundy, L. G. 1997, ApJ, 490, 682
- Thronson et al. (1989) Thronson, H. A., Hereld, M., Majewski, S., Greenhouse, M., Johnson, P., Spillar, E., Woodward, C. E., Harper, D. A., & Rauscher, B. J. 1989, ApJ, 343, 158
- Toomre (1978) Toomre, A. 1978, in IAU Symp. 77: Structure and Properties of Nearby Galaxies, 267–+
- Tremaine & Weinberg (1984) Tremaine, S., & Weinberg, M. D. 1984, ApJ, 282, L5
- Tully (1974) Tully, R. B. 1974, ApJS, 27, 449
- Turner et al. (1998) Turner, A., Ferrarese, L., Saha, A., Bresolin, F., Kennicutt, R. C., Stetson, P. B., Mould, J. R., Freedman, W. L., Gibson, B. K., Graham, J. A., Ford, H., Han, M., Harding, P., Hoessel, J. G., Huchra, J. P., Hughes, S. M. G., Illingworth, G. D., Kelson, D. D., Macri, L., Madore, B. F., Phelps, R., Rawson, D., Sakai, S., & Silbermann, N. A. 1998, ApJ, 505, 207
- van Driel & Buta (1993) van Driel, W., & Buta, R. 1993, PASJ, 45, L47
- Wada et al. (1998) Wada, K., Sakamoto, K., & Minezaki, T. 1998, ApJ, 494, 236
- Westpfahl (1998) Westpfahl, D. J. 1998, ApJS, 115, 203
- Wilson (1995) Wilson, C. D. 1995, ApJ, 448, L97+
- Wong & Blitz (2000) Wong, T., & Blitz, L. 2000, ApJ, 540, 771
- Young & Knezek (1989) Young, J. S., & Knezek, P. M. 1989, ApJ, 347, L55
- Zhang et al. (1993) Zhang, X., Wright, M., & Alexander, P. 1993, ApJ, 418, 100
| Galaxy | Type | Distance (Mpc)a | b | Gas morphology comments |
|---|---|---|---|---|
| NGC 1068 | Sb | 14.4 | 3.1 | strong spiral/ring structure, bar |
| NGC 3627 | SBb | 11.1 | 3.0 | strong bar and spiral |
| NGC 4321 (M100) | SBbc | 16.1 | 2.3 | strong spiral and bar |
| NGC 4414 | Sc | 19.1 | 1.2 | flocculent spiral |
| NGC 4736 (M94) | Sab | 4.2 | 0.9 | strong spiral and bar |
| NGC 4826 | Sab | 4.1 | 1.3 | clumpy structure |
| Component | Mass | Number of Particles | fraction of particles |
|---|---|---|---|
| Simulation Units | |||
| Halo | 3.4 | 12800 | 0.4 |
| Bulge | 0.33 | 6400 | 0.2 |
| Disk Stars | 3.06 | 6400 | 0.2 |
| Gas | 0.34 | 6400 | 0.2 |