The Nature of Faint 24m sources Seen in Spitzer Observations of ELAIS-N1
Abstract
The Spitzer Space Telescope has undertaken the deepest ever observations of the 24m sky in the ELAIS-N1 field with the MIPS instrument as part of GOODS Science Verification observations. We present completeness corrected extragalactic source counts down to 24m flux densities of 20Jy (30% completeness), a factor of 10000 more sensitive than IRAS. The shape of the counts confirms model predictions for a strong evolution of the infrared luminosity function between redshift of 0 and 1, and suggests a flattening in the evolutionary parameters at higher redshifts. Models that fit the counts indicate that luminous infrared galaxies (10L(8-1000m) L☉) in the redshift range 0.5 constitute 60% of 24m sources seen in the flux range 20S Jy. At least 85%, and possibly all of the 24m sources have a counterpart in the IRAC 3.6m and 4.5m near-infrared channels consistent with the expected spectral energy distribution of infrared luminous galaxies at moderate redshift. The similarity between the observed mid-infrared to near-infrared flux ratios of the Spitzer detected sources and the 15m/HK-band flux ratios of the ISOCAM 15m sources seen in the HDF-N strongly suggests that faint 24m sources are high-redshift analogs of ISOCAM 15m sources, and that they have the potential to provide an evolutionary connection between the well-studied Lyman-break galaxy population and the dusty starburst galaxies seen at .
ads/sa.spitzer#0006006016 (catalog ) ads/sa.spitzer#0006006272 (catalog ) ads/sa.spitzer#0006006528 (catalog )
1 Introduction
Deep extragalactic surveys at mid-infrared and submillimeter wavelengths have revealed a population of dusty galaxies with large mid- and far-infrared luminosities at intermediate and high redshifts (see e.g. Franceschini et al., 2003, and references therein). The number counts of these objects is more than an order of magnitude higher than expected if the local infrared luminosity function of galaxies were constant with redshift. Model fits to the observed counts at these wavelengths by various groups suggest a rapid increase in the co-moving number density of infrared luminous galaxies between redshifts of 0 and 11.5 followed by a flattening or decrease out to higher redshifts (Xu et al., 2001; Chary & Elbaz, 2001; Lagache et al., 2003; King & Rowan-Robinson, 2003, ; hereafter XU, CE, LDP and KRR respectively). The mid-infrared bandpasses i.e. ISOCAM 15m and Spitzer 24m filters trace rest-frame 7.7m and 12m at z1 and z2 respectively where the radiation is dominated by the line and continuum emission from polycyclic aromatic hydrocarbons and very small dust grains (see e.g. Dwek et al., 1997, for a review). As a result, it has been unclear if the evolutionary turn over at z1 is because of the -correction in the ISOCAM 15m filter which would selectively detect objects with strong 7.7m PAH features at that redshift or because of a real change in the evolutionary parameters. In this paper, we present faint 24m counts from Spitzer observations of the European Large Area ISO Survey-N1 (ELAIS-N1) field, evaluate their contribution to the extragalactic background light and compare the properties of these objects with the ISOCAM detected 15m sources with particular emphasis on their near-infrared/IRAC counterparts. Throughout this paper, we refer to luminous infrared galaxies (LIGs) as objects with 10L L☉ and ultraluminous infrared galaxies (ULIGs) as objects with L L☉.
2 Observations
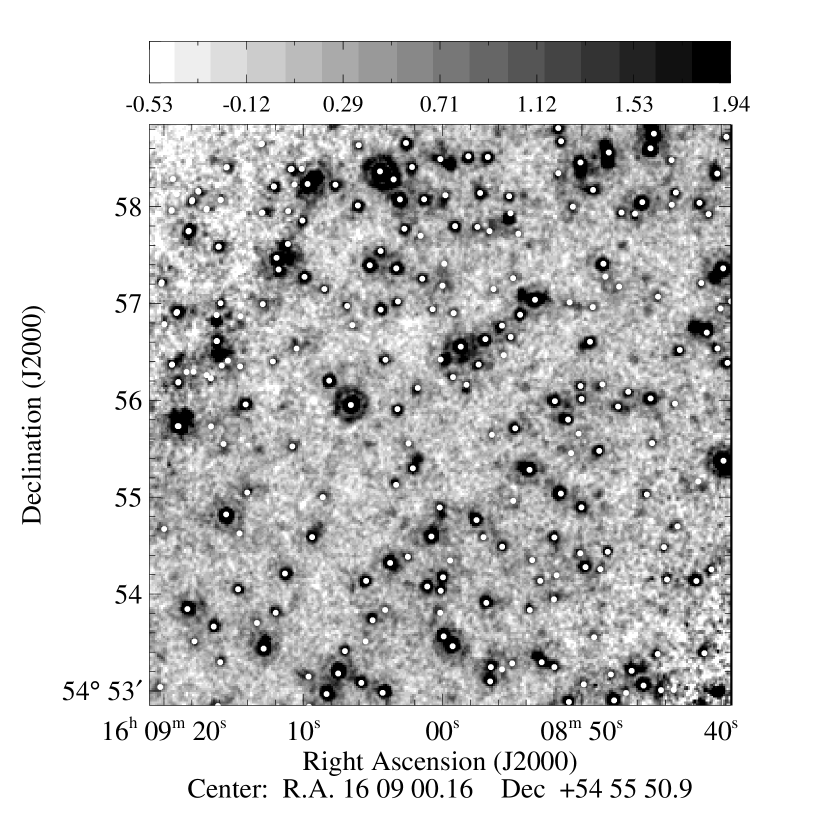
The Spitzer observations of ELAIS-N1 (; ; J2000) were undertaken under Director’s Discretionary Time as part of the Great Observatories Origins Deep Survey (GOODS) Science Verification program to assess the effect of source confusion on ultradeep Spitzer surveys. The maximum integration time amounted to 4620sec per detector pixel of MIPS 24m integration and 6900sec of IRAC observations corresponding to background limited 5 sensitivities of 6Jy/pix and 0.4Jy/pix (3.6 & 4.5m) respectively (see Fazio et al., 2004; Rieke et al., 2004, for instrument description). The output of the Spitzer Science Center v9.5 pipeline was post-processed after making corrections for varying sky background, striping (jailbar) correction for every fourth column due to a bias drift in the readout electronics, and distortion corrections based on a grid of 2MASS stars and cross-channel counterparts in the IRAC and MIPS images. The images were then resampled (drizzled; Fruchter & Hook 2002) onto a 1.2 pixel grid for MIPS and 0.6 for IRAC and sources extracted. The observations covered a total area of 165 with an integration time greater than 900s. Two rectangular strips with a combined area of 50 have the deepest exposures (4200sec). Figure 1 shows a fraction of the 24m image with dots representing the IRAC counterparts of the MIPS sources.
For the IRAC data, roughly half the field was covered by the 3.6m and 5.8m channels, while the other half was covered by the 4.5 and 8.0m channels. Only the 3.6 and 4.5m IRAC images are considered here, which together provide the best angular resolution and faintest flux limits currently available for studying the counterparts to the 24m sources. The source density in the IRAC channels was found to be about a factor of 4 higher than in the 24m image at these depths.
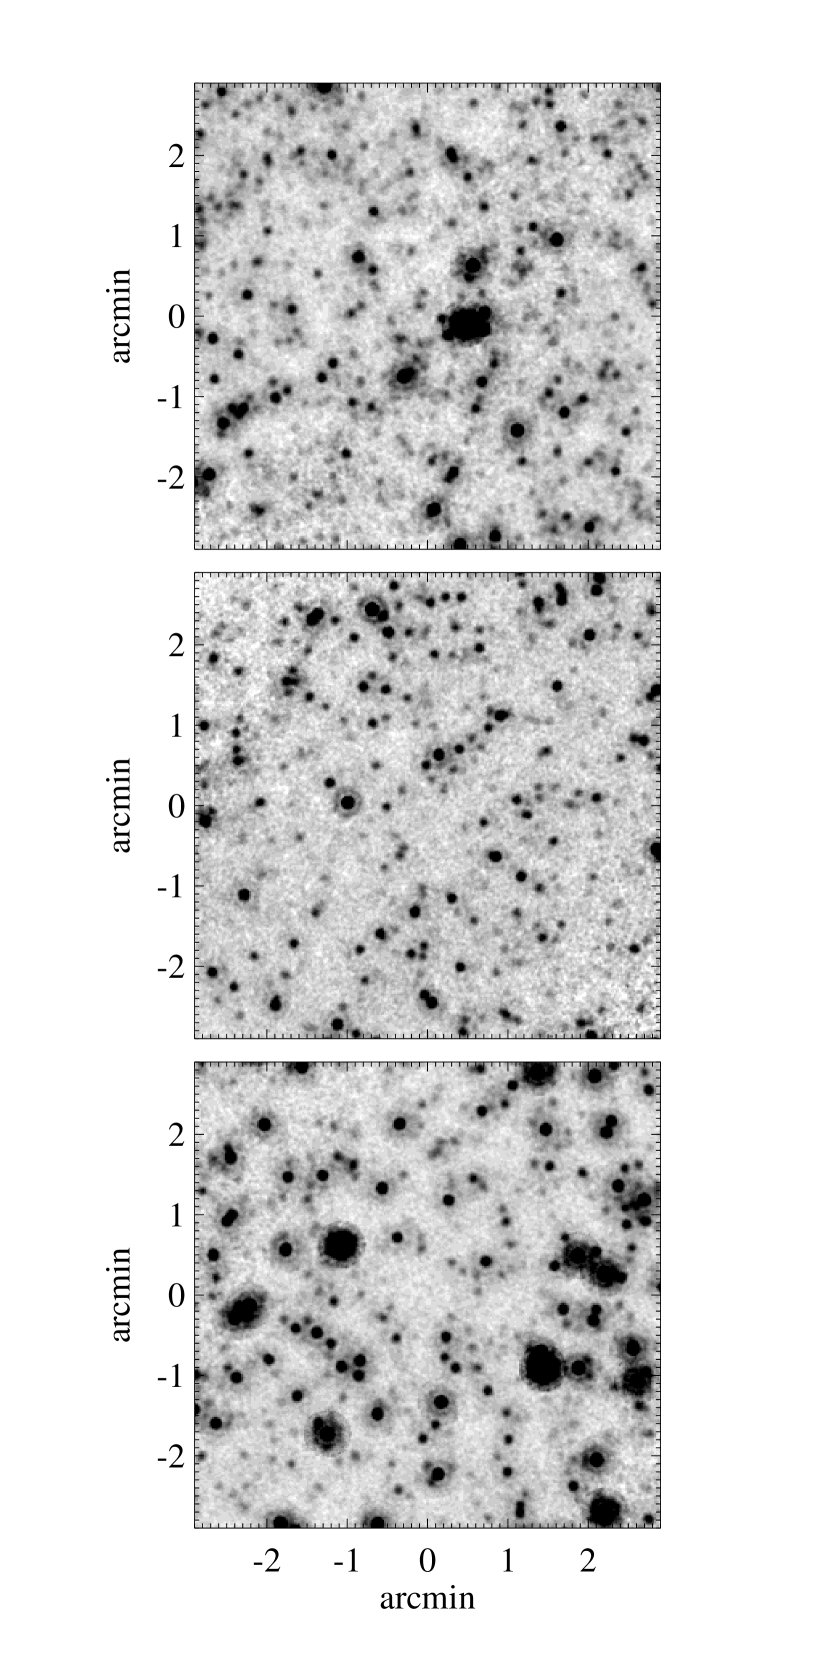
Sources catalogs were generated using SExtractor (Bertin & Arnouts, 1996). SExtractor parameters were fine tuned from simulated pure-noise images. These images were simulated by generating noise-only data frames where the rms for each 30s frame was the same as measured in the data. Each frame was then run through the post-processing pipeline, applying the same distortion corrections and drizzle parameters in generating a final stack as for the real data. In general, we find that the majority of the sources in the real data are indistinguishable from a point source and so hereafter, we assume that all sources are point sources. The PSF was measured from the real data and normalized by comparing the flux in an 18 radius aperture of the PSF with an equivalent SIRTF/TINYTIM (Krist, personal communication) generated PSF with the same FWHM. Point sources were then added on to the pure noise image with three different model flux distributions corresponding to the KRR, CE and LDP models. Figure 2 illustrates the difference in source density between the data and the models. Allowing for a matching radius of 2.9, we find that our SExtractor parameters result in 1% of spurious sources in our simulated images where we know the input catalog of sources. The flux of the extracted source was measured in a circular aperture of radius 6 and corrected upwards by a factor 1.8 to account for the wings of the PSF performed. We found that as a result of the large source density and the 4.7 FWHM PSF, using larger beams results in substantial contamination of the source flux from neighboring sources.
Completeness corrections and flux calibration were measured using a thorough Monte-Carlo approach. In each iteration of the process, 14 artificial sources were added to the original data image, and SExtractor run on the resultant new image, with detection and flux measurement parameters identical to hose used for the original catalogs. The number of sources added was deliberately kept small to minimize source crowding in the images. Sources present in the original image were tagged in the new image depending on the change in their position and/or change in their flux density. Thus, if a source in the new image had a position within 2.9 in the artificial image and had a flux difference of less than 5% it was tagged as unaffected by the artificial sources. An artifical source was regarded as detected if one of the untagged sources matched the input position of the artificial source to within 2.9. Detection and flux measurement parameters were identical to those described above. The process was repeated a 1000 times with the 14 sources randomly generated from a flat flux distribution between 20Jy and 2000Jy. A matrix Pij for the output flux distribution of the artificial sources was generated where is the input flux and the output flux (e.g. Smail et al., 1995). The nature of the Pij matrix is such that for a particular , the sum over all is less than unity. This is the completeness correction factor which was measured to be 50% at an input flux value of 35Jy. The observed catalog of sources in the real image was then distributed among the flux bins. The Pij matrix was renormalized such that the sum over for a particular was equal to the number of detected output sources in that flux bin. The completeness corrected counts in each flux bin is then the sum over of the renormalized Pij matrix. This approach was tested on the three simulated images, each with their own Pij matrix, and the input and output catalog compared to ensure the accuracy of the approach.
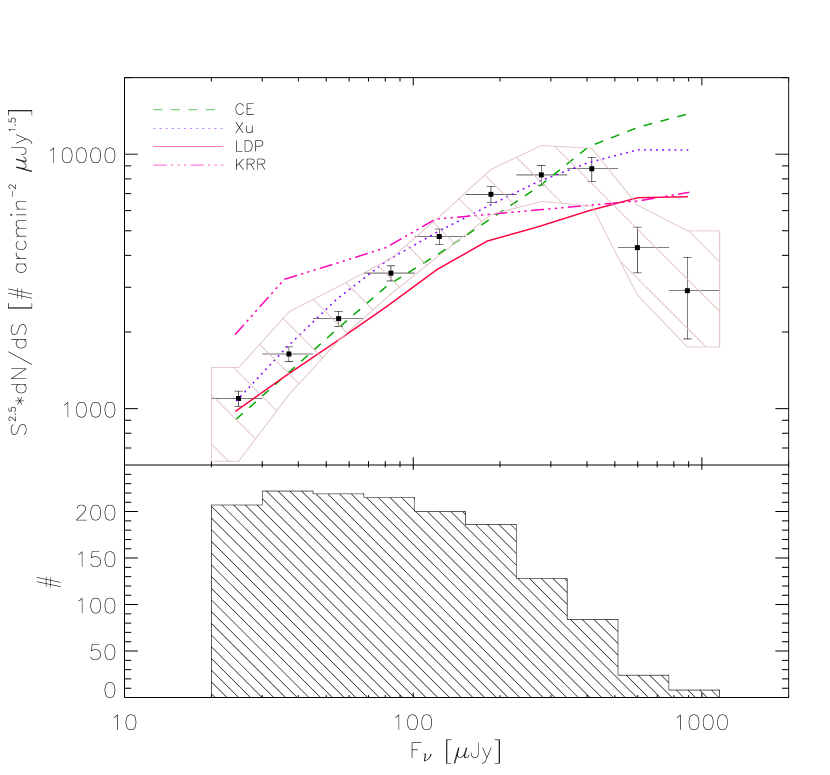
Uncertainties in the observed counts were assumed to be Poissonian i.e. where Nj is the number of observed counts in the Fj flux bin. These were then propagated through the Pij matrix to derive the uncertainty in the completeness corrected counts. Attempts to quantify the systematics in the counts were undertaken. These were dominated by the adopted size of the beam used to measure the flux and the resultant correction. A 5% flux calibration error was also introduced to assess the effect on the counts. The resultant systematic uncertainties are marked as the hatched region on the top panel of Figure 3.
To assess the accuracy of the source extraction at the faintest flux bins, where the completeness fraction is 30%, a pure noise image was generated on a 1.2 pixel grid and point sources added with a flux distribution that is identical to the completeness corrected counts at SJy but with an extrapolation to flux densities of 1Jy using the CE model. Artificial sources were added and extracted from this simulated image using the technique described earlier. The completeness corrected counts in this simulated image are only marginally different from those derived from the real data and hence we conclude that despite the large completeness corrections, the shape of the counts at the faint end are reliably determined.
3 Galaxy Counts and Extragalactic Background Light
Table 1 and Figure 3 shows the completeness corrected 24 m counts in ELAIS-N1 and the actual number of detected sources in each flux bin. Also shown in Figure 3 are the model 24m counts from XU, CE, LDP and KRR. All the model counts are too high at bright flux densities (SJy) with the CE model being the most deviant. This could be attributed to cosmic variance and poor statistics on bright objects in this field. However, based on the Spitzer 24m counts presented by Papovich et al. (2004) in this issue which offer much better statistics at these brighter flux densities, it appears that this is a real feature. This is most likely because the evolutionary models of the various groups were fit to the published ISOCAM 15m counts from various different fields at flux densities of 1 mJy which had large associated uncertainties and have since been shown to be too high (see e.g. Gruppioni et al., 2002; Elbaz et al., 1999). At flux densities fainter than 400 Jy, our counts indicate that both the LDP model and KRR model are inconsistent with the observed counts. The LDP model is about 30% too low and has a faint end slope of S-1.7 while the KRR model is comparably low and has a faint end slope of S-1.95. For comparison, the observed counts in this field at flux densities in the range 20200Jy can be fit by a polynomial of the form dN/dS (arcmin-2 Jy-1)= 92(S Jy)-1.6±0.10. The XU and CE models are within the uncertainties in the counts in this flux range and have S-1.6 slopes as well.
To quantify the quality of the model source counts fits to the data at the faint end, we performed a minimum sum of absolute errors, a minimum chi-square as well as a maximum likelihood analysis of the observed completeness corrected counts since the uncertainty is dominated by Poissonian errors. The likelihood, L is calculated as:
| (1) |
The third term in the calculation of the likelihood, is irrelevant and is omitted in Equation 1. is the model counts in each of flux bins and is the observed counts corrected for completeness in those flux bins. We find that for both the minimum absolute errors and chi-square technique, the CE model which includes both density and luminosity evolution provides the best fit to the counts at flux values fainter 500 Jy. However, the maximum likelihood technique indicates that the XU model is marginally a better fit. Thus, we conclude that the CE and XU models both provide reasonably good fits to the observed data at the faint end. Although neither of these models provide good fits at SJy, the counts at these flux limits are dominated by galaxies at z0.5. Roughly speaking, the implication of this poor fit is that at these redshifts, the LIG component is evolving much more rapidly than the ULIG component. However, the paucity of sources at faint 24m fluxes implies that the rapid increase in the number density of infrared luminous galaxies between redshifts of 0 and 11.5 that is required by the models does not extend to higher redshifts and the evolution either reaches a plateau or declines. Since the optical/ultraviolet luminosity density (with no dust corrections) also rises but at a slower rate between z0 and z1 (see Steidel et al., 1999, and references therein), the implication is that extinction-corrections to UV-derived star-formation rate measurements are increasing with redshift, particularly between 0.
The predicted redshift distribution of the sources (Figure 4) in this flux range as derived from the models shows a bi-modal structure, peaking at redshift 1 and redshift 2 with 20% of sources being at redshifts between 2z3. The bi-modal nature of the redshift distribution is a result of the two strongest set of PAH features, those around 8m and 12m, being redshifted into the 24m passband. Luminous infrared galaxies account for about 60% of all sources while ULIGs are about 10%. The remainder consists of M82-analogs, i.e. low-redshift objects with L(8-1000m) L☉.
The robustness of this redshift distribution can be questioned since it depends on empirical evolutionary models which broadly fit other multi-wavelength counts but provide poor fits at bright 24m flux densities. CE emphasized the degeneracy in evolutionary parameters for the infrared luminosity function i.e. a number of models which provide reasonable fits to the observed counts can yield varying counts/star-formation rate estimates. However, the key conclusion was that all models required a flattening in their (1+z)α evolution at z1. This is confirmed by the Spitzer observations. We have re-derived the evolutionary parameters to fit the 24m counts in this paper and Papovich et al. (2004) as well as the far-infrared counts in Dole et al. (2004). We find that the key variable is the ratio of LIGs to ULIGs which we now evolve independently unlike in CE. Using the new evolutionary parameters which we will discuss in a later paper, we find that although the fractional contribution of LIGs and ULIGs can differ slightly from that presented in Figure 4, the shape of the overall redshift distribution remains the same.
The CE models derive the total 24m EBL to be 3.7nW m-2 sr-1of which 32% comes from sources brighter than 1000Jy. Since the CE model is a factor of 4 too high at the bright flux densities, the 24m EBL must be significantly lower than this estimate. The 24m IGL from the detected sources in the flux density range 20S Jy in these Spitzer observations is 1.80.2 nW m-2 sr-1 while the completeness corrected counts yield a value of 2.00.2 nW m-2 sr-1. Thus, we conclude that these deep Spitzer observations have resolved out at least 50% of the 24m EBL and probably as much as 65%.
4 Near-Infrared Counterparts of 24 Sources
ISOCAM 15m sources appear to be disparate from the SCUBA 850m sources in that they have relatively bright optical/near-infrared counterparts which span the range of Hubble-types in morphology. This seems to suggest that they are typically massive galaxies with stellar mass M☉ (Franceschini et al., 2003). In contrast, the SCUBA 850m sources are optically faint and mostly irregular systems (Chapman et al., 2003). This could be a result of morphological correction since visible light observations of SCUBA sources trace rest-frame ultraviolet emission which could be patchy due to dust extinction internal to the galaxy. Since the models suggest that the 24m sources presented here are at redshifts intermediate to the ISOCAM and 850m sources, this would imply that they have rest-frame properties that are intermediate to those sources.
We matched sources between MIPS and IRAC using a nearest neighbor match between the 24m catalog and the 3.6 and 4.5 m catalogs (Figure 5). At a 24m flux limit of 50Jy, more than 85% of the sources have IRAC counterparts within 3, as compared to the 25% expected for random matches to objects with the same density; thus at least 60% of the matches are physical.
Direct inspection of the remaining 15% shows that in almost all cases, separations of 3 or larger arise not from a lack of physical counterpart, but due to a variety of other factors: 7.8% of MIPS sources fall in a region of low exposure time in either the IRAC image or MIPS image or both; 3.6% are cases where the IRAC counterpart was not automatically detected because it falls near a much brighter IRAC sources and was not deblended from the brighter IRAC sources; 6.5% of MIPS sources appear to be blended emission from two or more nearby IRAC sources in which case the MIPS source appears slightly extended/distorted and its centroid falls between the IRAC positions which are more than 3 away. There are however 0.9% of cases where the MIPS source genuinely appears to have no IRAC counterpart to the sensitivity of the IRAC image. Since the distribution of MIPS/IRAC flux ratios is broad, depending on the nature of the source and its redshift, faint MIPS sources could have counterparts which are below the flux threshold of the IRAC observations. Therefore we conclude that the fraction of 24m sources with reliable near-infrared associations is 100%.
Having identified the counterparts of the sources, we then proceed to estimate a flux ratio between the mid-infrared and near-infrared wavelengths. For the MIPS catalog we adopted a beam size corrected flux value as described in Section 2. For the near-infrared we adopted SExtractor flux values in a 6 diameter beam and applied a 20% beamsize correction based on estimates published by the Spitzer Science Center. Figure 5 illustrates the mid-infrared to near-infrared flux ratios of the Spitzer 24m sources detected here. Also shown as solid circles is the 15m to HK-band flux ratio (partly from Barger et al., 2002, and partly from the GOODS data) for the ISOCAM 15m sources in the HDF-N which have spectroscopically determined redshifts peaking at 0.8. Due to the shape of the dust spectral energy distribution at these wavelengths, sources at the same redshift will mostly be brighter at observed 24m than at observed 15m. However, at , the properties of 24m sources should trace the same rest-frame emission as the 15m observations at z1. Since, the mid-infrared flux of a galaxy traces its total star-formation rate, while the near-infrared flux is a measure of the stellar mass in the galaxies, the similarity in this flux ratio between the ISOCAM and MIPS sources broadly suggests that the specific star-formation rate i.e. the ratio of SFR to stellar mass, is very similar among the z1 ISOCAM galaxies and z1-2 MIPS galaxies.
References
- Barger et al. (2002) Barger, A. J., et al., 2002, AJ, 124, 1839
- Bertin & Arnouts (1996) Bertin, E., & Arnouts, S., 1996, A&AS, 117, 393
- Chapman et al. (2003) Chapman, S. C., et al., 2003, ApJ, 599, 92
- Chary & Elbaz (2001) Chary, R., & Elbaz, D., 2001, ApJ, 556, 562 (CE)
- Dwek et al. (1997) Dwek, E., et al., 1997, ApJ, 465, 565
- Dole et al. (2004) Dole, H., et al., 2004, ApJS, this volume
- Elbaz et al. (1999) Elbaz, D., et al., 1999, A&A, 351, L37
- Fazio et al. (2004) Fazio, G., et al., 2004, ApJS, this volume
- Franceschini et al. (2003) Franceschini, A., et al., 2003, A&A, 403, 501
- Fruchter & Hook (2002) Fruchter, A., & Hook, R., 2002, PASP, 114, 144
- Gruppioni et al. (2002) Gruppioni, C., et al., 2002, MNRAS, 335, 831
- King & Rowan-Robinson (2003) King, A. J., & Rowan-Robinson, M., 2003, MNRAS, 339, 260 (KRR)
- Lagache et al. (2003) Lagache, G., Dole, H., & Puget, J.-L., 2003, MNRAS, 338, 555 (LDP)
- Papovich et al. (2004) Papovich, C., et al., 2004, ApJS, this volume
- Rieke et al. (2004) Rieke, G. R., et al. 2004, ApJS, this volume
- Smail et al. (1995) Smail, I., et al., 1995, ApJ, 449, L105
- Steidel et al. (1999) Steidel, C. C., et al., 1999, ApJ, 519, 1
- Xu et al. (2001) Xu, C., et al., 2001, ApJ, 562, 179 (XU)


| Slow | Shigh | Avg Sν | Observed dN/dS | Corrected dN/dS | Uncertainty dN/dS |
|---|---|---|---|---|---|
| 20.0 | 30.0 | 24.8 | 1.2E-01 | 3.6E-01 | 2.5E-02 |
| 30.0 | 45.0 | 37.1 | 8.9E-02 | 2.0E-01 | 1.3E-02 |
| 45.0 | 67.5 | 55.2 | 5.9E-02 | 1.0E-01 | 6.8E-03 |
| 67.5 | 101.2 | 83.8 | 3.8E-02 | 5.3E-02 | 3.6E-03 |
| 101.2 | 151.9 | 123.1 | 2.4E-02 | 2.8E-02 | 2.0E-03 |
| 151.9 | 227.8 | 185.9 | 1.5E-02 | 1.5E-02 | 1.1E-03 |
| 227.8 | 341.7 | 277.9 | 6.8E-03 | 6.4E-03 | 5.7E-04 |
| 341.7 | 512.6 | 415.8 | 3.0E-03 | 2.5E-03 | 2.7E-04 |
| 512.6 | 768.9 | 597.9 | 5.6E-04 | 4.9E-04 | 1.0E-04 |
| 768.9 | 1153.3 | 891.2 | 1.3E-04 | 1.2E-04 | 4.3E-05 |