The Homogeneity of Interstellar Oxygen in the Galactic Disk111Based on observations with the NASA/ESA Hubble Space Telescope (HST) and the NASA-CNES-CSA Far-Ultraviolet Spectroscopic Explorer (FUSE). HST spectra were obtained at the Space Telescope Science Institute, which is operated by the Association of Universities for Research in Astronomy, Inc. under NASA contract No. NAS 5-26555; FUSE is operated for NASA by the Johns Hopkins University under NASA contract NAS-32985.
Abstract
We present an analysis of high resolution HST Space Telescope Imaging Spectrograph (STIS) observations of O I 1356 and H I Lyman- absorption in 36 sight lines that probe a variety of Galactic disk environments and include paths that range over nearly 4 orders of magnitude in (H2), over 2 orders of magnitude in , and that extend up to 6.5 kpc in length. Since the majority of these sight lines have also been observed by the Far-Ultraviolet Spectroscopic Explorer (FUSE), we have undertaken the study of gas-phase O/H abundance ratio homogeneity using the current sample and previously published Goddard High-Resolution Spectrograph (GHRS) results. Two distinct trends are identified in the 56 sight line sample: an apparent decrease in gas-phase oxygen abundance with increasing mean sight line density () and a gap between the mean O/H ratio for sight lines shorter and longer than about 800 pc. The first effect is a smooth transition between two depletion levels associated with large mean density intervals; it is centered near and is similar to trends evident in gas-phase abundances of other elements. Paths less dense than the central value exhibit a mean O/H ratio of log10(O/H) = -3.410.01 (or 39010 ), which is consistent with averages determined for several long, low-density paths observed by STIS (André et al., 2003) and short low-density paths observed by FUSE (Moos et al., 2002). Sight lines of higher mean density exhibit an average O/H value of log10(O/H) = -3.550.02 (28412 ). The datapoints for low- paths are scattered more widely than those for denser sight lines, due to O/H ratios for paths shorter than 800 pc that are generally about 0.10 dex lower than the values for longer ones. Scenarios which would be consistent with these results include a recent infall of metal-poor gas onto the local Galactic disk and an interstellar environment toward Orion that is conducive to reducing the apparent gas-phase oxygen abundance.
1 Introduction
Ranking as the third most abundant element in the interstellar medium (ISM) after hydrogen and helium, oxygen is a primary constituent of both its gas and dust phases. Consequently, accurate measurements of interstellar oxygen abundances and the homogeneity of its distribution are crucial to a broad range of fields, from galactic chemical evolution (Timmes et al., 1995) to the composition of interstellar dust grains (Sofia & Meyer, 2001). Efforts to determine the interstellar oxygen abundance and investigate its homogeneity using Goddard High-Resolution Spectrograph (GHRS) observations of the optically-thin 1356Å resonance line initially showed that within about 500 pc of the Sun, the gas-phase O/H ratio for 13 sight lines was remarkably uniform at a level of log10(O/H) = 3.460.02 ( , Meyer, Jura, & Cardelli 1998; the original result has been linearly adjusted to reflect the -value used in this paper). It was concluded that the apparent scatter in the local diffuse ISM O/H gas-phase abundance ratio was consistent with the sum of observational and measurement uncertainties, and that the total oxygen abundance and the proportions in gas and dust did not vary significantly in the diffuse ISM. More recent studies based on spectral data from Space Telescope Imaging Spectrograph (STIS) and Far-Ultraviolet Spectroscopic Explorer (FUSE), however, have challenged this picture of homogeneity by identifying sight lines with a much larger range of gas-phase O/H ratios. For instance, Cartledge et al. (2001) reported the first indications of enhanced oxygen depletion when they examined several sight lines with large mean hydrogen sight line densities (), Moos et al. (2002) measured an O/H ratio of log10(O/H) = 3.520.03 (30321 ) toward 5 dwarf stars within 200 pc, and André et al. (2003) determined a mean of log10(O/H) = 3.390.01 (40813 ) for 19 low mean density sight lines with lengths of 0.84 – 5.01 kpc.
The distinctions between these measurements appear to be related to properties of the samples observed by each of the different instruments. In examining the variation of deuterium to oxygen abundance ratios in the local ISM using FUSE, Steigman (2003) concluded that one of the sight lines studied by Moos et al. (2002) may have biased their sample unfairly in terms of the weighted mean. Consequently, the O/H abundance ratio from FUSE data might be thought of as log10(O/H) = 3.41 (32 ; Moos et al. 2002; Steigman 2003) with one strongly deviating sight line. The revised mean is then consistent with the long sight line STIS average of André et al. (2003), but these values remain roughly 0.10 dex larger than the GHRS results for similar sight lines. In an effort to develop a more thorough understanding of variations in the interstellar oxygen abundance, and possibly explain the differences evident in the samples studied to date, we present O I 1356 and H I 1216 data for 36 sight lines and analyze variations in O/H abundance ratios for 56 paths toward stellar objects observed by GHRS, STIS, and FUSE. The current data include sight lines exhibiting a broad range of properties [e.g., log – 1.10 (cm-3), logH – , – 0.66, – 6.56 kpc], and suggest that the gas-phase O/H abundance ratio can be expressed as a function of where oxygen depletion is significantly enhanced for sight lines with mean densities larger than about 1.5 cm-3. Furthermore, it is apparent that among the less dense paths, those extending farther than 800 pc possess larger oxygen abundances than shorter ones.
2 Observations and Data Extraction
The new STIS observations of O I 1356 that are presented in this paper were acquired in the course of two SNAPSHOT HST programs. These programs (GO8241, GO8662) were in part designed to study ISM cloud properties as a function of distance and extinction by acquiring as many observations as possible of O and B type stars that would produce useful spectra in 5, 10, or 20 minute exposures. The current sample includes results from all of these STIS spectra for which a reliable oxygen abundance could be determined. All exposures were made using the 0.2″0.2″ STIS aperture with either the E140H grating setup centered at 1271Å or the E140M grating centered at 1425Å. The full STIS and FUSE observation lists are presented in Table 1. Standard IRAF STSDAS reduction packages were used in calibrating the STIS data, with the exception that X2DCORR rather than SC2DCORR was applied to E140H exposures. This step was taken in order to apply a data extraction code based on the procedure described by Howk & Sembach (2000), used in the interest of consistency with the analysis of Cartledge et al. (2001). In general, O I 1356 absorption appeared in the overlap region between successive spectral orders, which were combined to improve the S/N ratio; examples of the calibrated oxygen absorption profiles are presented in Figure 1, including borderline cases as well as features corresponding to much more reliable measurements. The final S/N per pixel values near 1356Å ranged from 30 – 70.
Adhering to our established method (Cartledge et al., 2001, 2003), column densities were determined from the O I 1356 absorption profiles using independent apparent optical depth (Savage & Sembach, 1991) and profile fitting (Mar & Bailey, 1995; Welty, Hobbs, & York, 1991) procedures with the same constants applied as in previous work (e.g., = 1.161). The results of both methods are presented in Table 2. Of particular note, new column densities derived using each method differ by less than 0.04 dex for an individual sight line and these results are up to 0.13 dex larger than values derived under the assumption of no saturation. The results of profile-fitting measurements for new sight lines are adopted for all further analysis and are listed in Table 3, which also summarizes previous GHRS and STIS measurements. Since the current analysis is comparative, the tabulated 1 oxygen (and hydrogen) abundance errors do not include any contributions from -value uncertainties.
For each sight line where the Lyman- (Ly) absorption in the STIS data appeared to be uncontaminated by a stellar contribution and FUSE data were available, the total interstellar hydrogen column density was derived. The atomic measurement for each path was derived from STIS data in the 1160–1280Å wavelength interval using a continuum-reconstruction method (Bohlin, 1975; Diplas & Savage, 1994). Generally, the current H I measurements deviate from values published in Diplas & Savage (1994) by less than 0.06 dex and even the few severe discrepancies (up to 0.19 dex) are consistent within 1 uncertainties; there are no systematic differences between our measurements and those in the literature. A sample atomic hydrogen measurement is depicted in Figure 2. Molecular hydrogen abundances were determined using = 0 and 1 transitions in the FUSE spectral interval 1040–1120Å, since in general nearly 100% of the molecular hydrogen along a sight line populates these two rotational levels (Savage et al., 1977; Rachford et al., 2002). This assumption was tested and proved accurate for a few cases in the sample which exhibited prominent = 2 absorption features. These data were then calibrated using CALFUSE, the majority with version 1.8.7. For nearly all of the sight lines, continuum-reconstruction provided adequate abundance measurements; in cases where the column density was too small to produce noticeable damping wings, an amount was determined using the profile fitting code FITS6P222The FITS6P code models absorption profiles based on varying the column densities, -values, and velocities of input interstellar components. More details on the technique can be found in Welty, Hobbs, & York (1991)..
While hydrogen column densities were readily determined for all sight lines with both STIS and FUSE data, contamination of the interstellar Ly profile by a stellar component was a concern for main sequence stars with spectral types later than B1.5 or more luminous stars later than B2 (Diplas & Savage, 1994). However, the interstellar krypton abundance can be used as a secondary estimate of the total hydrogen column density for a sight line along which it can be measured (Cardelli & Meyer, 1997; Cartledge et al., 2001). In Figure 3, krypton and measured hydrogen data from the current sample (Cartledge et al., 2003) are combined with measurements by André et al. (2003) made for two stars that are distinct from our collection. The uniformity of Kr/H ratios along sight lines toward stars with types as late as B3 makes a strong argument for the position that the H I column densities determined toward these stars are reliable tallies of their respective interstellar atomic hydrogen abundances.333It should be noted that sight lines toward HD116852 and HD152590 exhibit unusually large (near solar) Kr/H abundance ratios. These paths are considered unique in this respect (see Cartledge et al. 2003) and thus they have been excluded from Figure 3. However, since a majority of them are characterized by and they comprise a significant portion of the denser sight lines being studied, we have also assessed the degree of stellar contamination in (H I) measurements toward each of these later type stars.
Stellar contamination of the Ly profile is potentially significant for nine stars in the sample derived from direct measurements of both oxygen and hydrogen abundances. In order to investigate the severity of this issue, we have employed the Diplas & Savage (1994) procedure of using published values for each star of the reddening corrected Strömgren [] index ([] = - [b - y]) to estimate the stellar H I component. For three stars, namely HD79186 (Crawford, Barnes, & Golson, 1970), HD165955 (Tobin & Kaufmann, 1984), and HD198478 (Crawford et al., 1973), this method implied that stellar contributions to their measured H I column densities were insignificant (less than 4%). For two more stars, HD37367 (Westin, 1982) and HD220057 (Sudzius & Bobinas, 1992)444Direct Strömgren photometry was unavailable for HD220057; Vilnius photometry and transforms published by Kaltcheva & Knude (2002) were used to derive ., the suggested stellar fractions rise to about 15%; given this level of contamination, the molecular hydrogen abundances determined for these sight lines limit any possible shift in total abundance to about 0.06 dex, less than the uncertainty associated with the current hydrogen measurements. Published photometry for HD203532 (Eggen, 1977) and HD212791 (Cameron, 1966) imply upper limits on the stellar component of 50 and 25%, respectively, of the total measured atomic hydrogen abundances for these paths. In light of some uncertainty in the index for HD203532 and the excellent agreement between Kr/H abundance ratios for these paths derived without a stellar correction applied and the interstellar mean, however, the atmospheric contribution to (H I) for these paths may not be as severe is the photometry indicates. We must also emphasize that the adjustment of these two O/H datapoints by even their maximal shifts incurs only a minor change in our results (less than 0.02 dex in the plateaus defined in Section 3).
Among the stars potentially affected by stellar H I absorption, HD27778 and HD147888 are crucial because the inferred values are high. Toward HD27778, Rachford et al. (2002) estimated the interstellar H I column density using ; their results for both (H I) and (H2) agree with ours within error and the derived total hydrogen column densities differ by only 0.02 dex. Furthermore, since its Kr/H abundance ratio almost precisely matches the interstellar mean, we conclude that the HD27778 hydrogen measurement is not significantly influenced by a stellar H I component. The hydrogen abundance toward HD147888 ( Oph D) was taken from Cartledge et al. (2001), who used HD147933 ( Oph A) as a proxy. Specifically H toward HD147933 was derived from the weighted mean of atomic measurements published by Bohlin, Savage, & Drake (1978) and Diplas & Savage (1994) and the molecular abundance reported by Savage et al. (1977). It is important to note that Diplas & Savage (1994) found that the HD147933 Ly profile was essentially uncontaminated by stellar absorption and that the atomic hydrogen abundance determined from the HD147888 spectrum matches the HD147933 weighted mean precisely.
In summary, a detailed investigation of atomic hydrogen diagnostics for these stars suggests that the current values are reasonable H I measurements and strengthens the case for using krypton as a reliable indicator of the total interstellar hydrogen abundance for sight lines lacking accurate and direct determinations. Accordingly, Kr I 1236 absorption features have been used to derive the total hydrogen abundance toward HD43818, HD148594, and HD175360; H I toward the latter two stars is severly overestimated by the Ly profile and the lack of a FUSE observation of HD43818 leaves (H2) undetermined for that sight line. Sight line properties not related to hydrogen have been included in the Appendix (Table 4) for all of the compiled STIS and GHRS paths.
3 Density-Dependent Depletion
Previous studies of the variation of interstellar elemental abundances have investigated the dependence they exhibit on several sight line properties including a variety of extinction measures and the fraction of molecular hydrogen (Jenkins et al., 1986; Van Steenberg & Shull, 1988). The characteristic producing the cleanest signal in measured gas-phase abundances is the sight line mean of total hydrogen column density, ; specifically, decreasing gas-phase abundances (or increasing inferred depletions onto dust) are positively correlated with increasing . Interstellar oxygen, however, did not exhibit the same dependence as other elements—in fact, the majority of UV absorption studies to date have found a remarkable O/H ratio consistency within their samples (e.g., York et al. 1983; Keenan et al. 1985; Meyer, Jura, & Cardelli 1998; André et al. 2003). But given the large amounts of CO and other oxygen-bearing molecules observed in dense clouds and conditions that are favorable for the growth of dust grains, it has been expected that oxygen depletion must be enhanced as the particle density increases to values achieved in molecular clouds. The first observations that suggested such enhancement were presented by Cartledge et al. (2001); these data are included in the current sample and provide the basis for a functional description of the interstellar gas-phase O/H abundance ratio based on (see Figure 4).
The 4-parameter Boltzmann function overlaid on the data in Figure 4 has the functional form:
| (1) |
where and are the oxygen gas-phase abundance levels appropriate for low and high mean sight line densities, respectively, is the inflection point of the curve, and is its slope at the inflection point. This function is a variation of the form used by Jenkins et al. (1986), where replaces the original factor . The earlier form has only two free parameters (the two depletion levels), under the assumption that (0.10 cm-3; Jenkins et al. 1986) is a canonical density for the warm neutral ISM below which no cool diffuse clouds contribute to the bulk of interstellar material along a sight line. As shown in Figure 5, the revised form eliminates the kink at and appears to follow the data for oxygen and other elements more naturally (Figure 5; Cartledge et al. 2004); hence, it is used in this analysis.
Although is a somewhat crude measure of the environment through which a sight line passes [ (H)/], its elemental abundance response can be interpreted in terms of the idealized ISM framework postulated by Spitzer (1985). In this model, the superposition of depletion signatures from three phases of the ISM convolved with the distribution of each phase’s filling factor as a function of the mean sight line density555According to the Spitzer (1985) model, warm neutral material dominates sight lines with cm-3, cool diffuse clouds are prevalent where cm-3, and denser clouds contribute the majority of matter along paths with cm-3. leads to a clear dependence of gas-phase abundance on . An implicit assumption of the model is that each ISM phase exhibits a characteristic depletion level. Although densities vary in a continuous fashion in the natural ISM, the appearance of a plateau in a plot of abundance vs. would indicate that an element’s depletion is fairly constant over a range of real densities. Consequently, Figure 4 suggests that oxygen depletion remains roughly fixed in two distinct interstellar density intervals.
By performing an uncertainty-weighted fit of the Boltzmann function to the data, reliable warm- and cold-ISM depletion levels can be measured simultaneously. Using the full oxygen data sample, the values derived from the entire sample correspond to levels of log10(O/H) = 3.410.01 (39010 ) for warm, low- sight lines and log10(O/H) = 3.550.02 (28412 ) along paths dominated by cooler and denser material with the transition centered at = 1.500.22 cm-3. The fit to the data also indicates that the number of parameters associated with the chosen Boltzmann function is reasonable; = 0.69 and the relative data scatter is 0.09 dex. Although the present discussion is focussed on reconciling our STIS data with GHRS results, supplementing the current data set with those sight lines unique to André et al. (2003) does not alter these determinations significantly (log10(O/H)warm shifts to 3.40, log10(O/H)cold is unchanged, the inflection point occurs at 1.46 cm-3, and rises to 0.75; see Figure 6a). Scatter in the data includes contributions from both intrinsic variability and measurement uncertainty, however the apparent distribution of the data around the Boltzmann function has a width roughly equal to a typical datapoint error bar (0.09 dex). But since the Boltzmann function represents a mean depletion signature, a portion of the data dispersion is due to the spread of gas/dust fractions allowed at a given value of . In the idealized picture of Spitzer (1985), this would correspond to scatter in the proportion of sight line material contributed by each of the ISM phases. In consideration of the approximate parity between the data dispersion around the depletion signature and estimated O/H ratio uncertainties, the uniformity of ISM elemental abundances implied for length scales of several hundred parsecs by gas-phase Kr/H ratios (Cartledge et al., 2003) might be extended to distances of a few kpc using oxygen.
The plateaus determined from the Boltzmann fit not only define the mean gas-phase oxygen abundances for sight lines of a given , they also bear on our understanding of dust composition. The sight lines examined in this paper will not contain significant amounts of ice. Any depletion of an element, therefore, should be into grains. The most likely oxygen carriers in dust are silicates and oxides; thus, the large cosmic abundances and heavy depletions of magnesium and iron suggest that the majority of the O-bearing grains will be associated with these two elements. Thus, silicon, magnesium, and iron depletions can be used to place limits on the amount of oxygen incorporated into grains. Our discussion of dust composition assumes that solar photospheric abundances well represent the total (gas + dust) abundances in the ISM; specifically, we use the solar abundances of silicon, magnesium, and iron from Holweger (2001).
The fractions of silicon and magnesium in dust trace each other extremely well from diffuse halo environments to the denser warm and cool disk regions (Sembach & Savage, 1996; Savage & Sembach, 1996; Theodosiou & Federman, 1999; Sofia, 2004). Moreover, since their solar abundances are nearly identical, approximately equal numbers of silicon and magnesium atoms are incorporated into dust from low- (50% of silicon resides in dust) to high-depletion interstellar regions (90% of silicon is in dust; Fitzpatrick 1997). In combination with the fact that Mg-bearing silicates better fit interstellar spectral features than Fe-bearing silicates (Whittet, 2003), this correlation suggests that silicon and magnesium are usually incorporated into the same grains. Jones (2000), however, finds that silicon is returned to the gas-phase ISM a bit more readily than magnesium, so that not every atom of one element in the dust will be paired with one atom of the other. Nevertheless, if we assume that most magnesium atoms deplete onto silicate grains in a 1-to-1 ratio with silicon atoms, then a likely grain mineral would be MgSiO3 (Ossenkopf et al., 1992) which has a high O-to-Si ratio. If the silicates are primarily Mg-based, then most or all of the iron would have to be incorporated into metal grains, or more likely oxides such as FeO, Fe3O4 or Fe2O3 (Jones, 1990). Using these grain types, an average halo-like region will have up to 7214 oxygen atoms incorporated into dust per million hydrogen atoms in the gas, while for typical cool disk regions the value would rise to 14014 in the same units. It should be noted that the uncertainties have been derived from the solar abundances alone and do not account for fluctuations of the measured gas-phase abundances in these regions. Other reasonable combinations of silicate and oxide grain types would all suggest lower oxygen dust abundances.
Two recent measurements of the solar photospheric oxygen abundance are (O/H)☉ = 545107 and 45756 (Holweger 2001 and Asplund et al. 2004, respectively); a weighted average yields (O/H)☉ = 47650 . Assuming this abundance for the ISM, our low- and high-density sight line averages imply 8651 and 19251 oxygen atoms incorporated into dust per million hydrogen atoms in the gas phase, respectively. The dust-phase oxygen abundance in the average low-density sight line would thus agree quite well with our above halo estimate within the given uncertainties, although the corresponding high density path value is just at the edge of 1 larger than the value we have derived for cool disk material. Opting for the Asplund et al. (2004) abundance rather than the mean would somewhat improve the accord in both regimes; however, given the magnitude of the uncertainties associated with the Holweger (2001) and Asplund et al. (2004) solar references and recent work suggesting that these levels are inconsistent with helioseismic results and current opacity tables (Basu & Antia, 2004), we regard none of these values as strictly preferred. Upon adopting any of these photospheric standards, the gas-phase abundance levels we measure imply 10616 more oxygen atoms per million hydrogen atoms in the gas along high mean density sight lines than along more diffuse paths. This difference is somewhat larger than would be expected solely from an enhanced oxygen dust abundance (6820). The gap is thus difficult to explain physically unless oxygen in denser regions can be incorporated into grain types other than those discussed or if it is substantially depleted into molecules. Of note, CO is not a major contributor to the carbon abundance along 5 of the denser sight lines in this sample (Sofia et al., 2004).
4 Local vs. Distant O/H Ratios
The large inferred oxygen dust abundance for high- sight lines might be influenced, however, by an apparent spatial effect. GHRS sight lines were the basis for the conclusion that the oxygen abundance in the local ISM was constant, in spite of the diversity in the properties of paths included in the study (Meyer, Jura, & Cardelli, 1998). Yet gas-phase O/H ratios determined from STIS and FUSE data imply measurably higher abundances among paths with low mean densities ( 1.0 cm-3) than were measured using GHRS666Hydrogen column densities toward stars observed with GHRS were derived a combination of Copernicus (Savage et al., 1977; Bohlin, Savage, & Drake, 1978) and International Ultraviolet Explorer (Diplas & Savage, 1994) measurements. Atomic hydrogen column densities determined from each instrument’s data were consistent within 1 errors and their weighted mean was used for each GHRS sight line in this sample.. The property that aside from the O/H ratio most clearly distinguishes the samples observed by GHRS, STIS, and FUSE is sight line pathlength. As shown in Figure 6b, the GHRS sample was constructed almost exclusively from sight lines shorter than about 800 pc while STIS has generally examined more distant targets. Consequently, if the GHRS and STIS low density ( 1.0 cm-3) samples are divided into groups shorter and longer than 800 pc, the weighted mean O/H abundance ratios diverge (log10(O/H)short = -3.460.02 and log10(O/H)long = -3.360.02).
Perhaps the simplest explanation for any short and long sight line abundance discrepancy would be that the local ISM has experienced an infall of metal-poor gas, recently enough that mixing processes have not yet erased its elemental abundance signature (Meyer et al., 1994). However, since all but one of the high- paths are also shorter than 800 pc, they would also be affected by infall. In this scenario, the density-depletion signature that is evident in the current data would be mitigated but not erased, since it is apparent in Figure 7 that sight lines that exhibit enhanced oxygen depletion when compared with hydrogen also evince somewhat reduced gas-phase O/Kr ratios. As a result, metal-poor gas infall might conveniently account for the larger-than-anticipated oxygen depletion enhancement that we determine for high mean density sight lines. Such infall, however, should also reduce other gas-phase elemental abundance ratios by a similar factor—but although spatial variations in Cu/H ratios for a similar grouping of sight lines are suggestive (Cartledge et al., 2004), not enough measurements of sufficient quality have been made to rigorously evaluate this scenario. The uniformity of Kr/H for many of the same sight lines that appear in the current sample (Cartledge et al., 2003) does not provide clear evidence for or against this possibility, since the overwhelming majority of these paths are shorter than 800 pc.
An intriguing alternative gap explanation arises, however, if one examines the character of the short diffuse sight lines exhibiting low O/H ratios (see Figure 8). These GHRS sight lines are dominated by paths directed toward Orion; among the five Meyer, Jura, & Cardelli (1998) sight lines pointed in this direction, four fall at or below the GHRS weighted O/H mean and only one sits near the gas-phase oxygen levels determined for diffuse paths using STIS and FUSE data. It has previously been suggested that the Orion region is oxygen-poor; for instance, Cunha & Lambert (1994) found that stellar atmospheres there were consistent with Orion nebular measurements, approximately 0.26 dex underabundant in oxygen relative to the Sun. While subsequent downward revisions of the solar level have reduced the contrast, it should be noted that these independent oxygen abundance values agree with the Orion GHRS measurements. Although one would expect that mixing processes would alleviate the signature of oxygen-poor stars in Orion interstellar gas studied at the current epoch, the coincidence of these measurements suggest that the apparent gap between short and long low-density sight line oxygen levels might be a consequence of reduced abundances in Orion convolved with measurement uncertainties.
Regardless of the origin of the pathlength-based gap among low- sight lines, the effect on the depletion signature determined by fitting the oxygen data to the Boltzmann function is limited in magnitude. A sample constructed of dense sight lines and only the longer diffuse paths shifts the low-density plateau by just 0.03 dex, raising the gas-phase O/H ratio by about 8%; these values are not significantly altered if the André et al. 2003 data for sight lines distinct from our sample are also included. In light of the very minor adjustments that this effect generates in the depletion signature, it should be noted that although the trends identified in the current set of oxygen data are clearly recognizable, they are present only at levels comparable to datapoint uncertainties. Consequently, additional precise interstellar gas-phase abundance measurements (oxygen and hydrogen), for both low and high mean density sight lines, are required in future in order to more reliably constrain our knowledge of the interstellar oxygen abundance in the Milky Way, the reasons why the O/H ratio may vary spatially, and the role oxygen plays in dust.
Appendix A APPENDIX
The common sight line properties for stars in the current sample are presented in Table 4 for easy reference. Spectral types were compiled by James T. Lauroesch in preparation for HST SNAPSHOT programs GO8241 and GO8662; the tabulated color excesses and distances (assigned by group membership) are drawn from Bertiau (1958), Bohlin & Savage (1981), Humphreys & McElroy (1984), Seab & Snow (1984), Westin (1985), Mermilliod (1986), Gies (1987), Reed (1993), Brown, de Geus, & de Zeeuw (1994), Diplas & Savage (1994), Sembach & Savage (1996), Raboud, Cramer, & Bernasconi (1997), Eggen (1998), de Zeeuw et al. (1999), Baumgardt, Dettbarn, & Wielen (2000), Reed (2000), and Rachford et al. (2002).
References
- André et al. (2003) André, M. K., Oliveira, C. M., Howk, J. C., Ferlet, R., Désert, J.-M., Hébrard, G., Lacour, S., Lecavelier des Étangs, A., Vidal-Madjar, A., Moos, H. W. 2003, ApJ, 591, 1000
- Asplund et al. (2004) Asplund, M, Grevesse, N., Sauval, A. J., Allende Prieto, C., & Kiselman, D. 2004, A&A, 417, 751
- Basu & Antia (2004) Basu, S., & Antia, H. M. 2004, ApJ, 606, L85
- Baumgardt, Dettbarn, & Wielen (2000) Baumgardt, H., Dettbarn, C., & Wielen, R. 2000, A&AS, 146, 251
- Bertiau (1958) Bertiau, F. C. 1958, ApJ, 128, 533
- Bohlin (1975) Bohlin, R. C. 1975, ApJ, 200, 402
- Bohlin & Savage (1981) Bohlin, R. C., & Savage, B. D. 1981, ApJ, 249, 109
- Bohlin, Savage, & Drake (1978) Bohlin, R. C., Savage, B. D., & Drake, J. F. 1978, ApJ, 224, 132
- Brown, de Geus, & de Zeeuw (1994) Brown, A. G. A., de Geus, E. J., & de Zeeuw, P. T. 1994, A&A, 289, 101
- Cameron (1966) Cameron, R. C. 1966, Georgetown Obs. Mono., 21
- Cardelli & Meyer (1997) Cardelli, J. A., & Meyer, D. M. 1997, ApJ, 477, L57
- Cardelli et al. (1991) Cardelli, J. A., Savage, B. D., Bruhweiler, F. C., Smith, A. M., Ebbets, D. C., Sembach, K. R., & Sofia, U. J. 1991, ApJ, 377, L57
- Cartledge et al. (2001) Cartledge, S. I. B., Meyer, D. M., Lauroesch, J. T., & Sofia, U. J. 2001, ApJ, 562, 394
- Cartledge et al. (2003) Cartledge, S. I. B., Meyer, D. M., & Lauroesch, J. T. 2003, ApJ, 597, 408
- Cartledge et al. (2004) Cartledge, S. I. B., Lauroesch, J. T., Meyer, D. M., & Sofia, U. J. 2004, in preparation
- Crawford, Barnes, & Golson (1970) Crawford, D. L., Barnes, J. V., & Golson, J. C. 1970, AJ, 75, 624
- Crawford et al. (1973) Crawford, D. L., Barnes, J. V., Golson, J. C., & Hube, D. P. 1973, AJ, 78, 738
- Cunha & Lambert (1994) Cunha, K., & Lambert, D. L. 1994, ApJ, 426, 170
- de Zeeuw et al. (1999) de Zeeuw, P. T., Hoogerwerf, R., de Bruijne, J. H. J., Brown, A. G. A., & Blaauw, A. 1999, AJ, 117, 354
- Diplas & Savage (1994) Diplas, A., & Savage, B. D. 1994, ApJS, 93, 211
- Eggen (1977) Eggen, O. J. 1977, PASP, 89, 205
- Eggen (1998) Eggen, O. J. 1998, AJ, 116, 1314
- Fitzpatrick (1997) Fitzpatrick, E. L. 1997, ApJ, 482, L199
- Gies (1987) Gies, D. R. 1987, ApJS, 64, 545
- Hamdy, Elazm, & Saad (1991) Hamdy, M. A., Elazm, M. S. A., & Saad, S. M. 1991, Ap&SS, 186, 161
- Holweger (2001) Holweger H. 2001, in AIP Conference Proceedings 598, Solar and Galactic Composition, ed. R. F. Wimmer-Schweingruber (Berlin: Springer), 23
- Howk & Sembach (2000) Howk, J. C., & Sembach, K. R. 2000, AJ, 119, 2481
- Humphreys & McElroy (1984) Humphreys, R. M., & McElroy, D. B. 1984, ApJ, 284, 565
- Jenkins et al. (1986) Jenkins, E. B., Savage, B. D., & Spitzer, L. 1986, ApJ, 301, 355
- Jones (1990) Jones, A. P. 1990, MNRAS, 245, 331
- Jones (2000) Jones, A. P. 2000, J. Geophys. Res., 105, 10257
- Kaltcheva & Knude (2002) Kaltcheva, N. & Knude, J. 2002, A&A, 385, 1107
- Keenan et al. (1985) Keenan, F. P., Hibbert, A., & Dufton, P. L. 1985, A&A, 147, 89
- Kohoutek & Wehmeyer (1999) Kohoutek, L., & Wehmeyer, R. 1999, A&AS, 134, 255
- Mar & Bailey (1995) Mar, D. P., & Bailey, G. 1995, PASA, 12, 239
- Mermilliod (1986) Mermilliod, J. -C. 1986, A&AS, 63, 293
- Mermilliod, Mermilliod, & Hauck (1997) Mermilliod, J. -C., Mermilliod, M., & Hauck, B. 1997, A&AS, 124, 349
- Meyer, Jura, & Cardelli (1998) Meyer, D. M., Jura, M., & Cardelli, J. A. 1998, ApJ, 493, 222
- Meyer et al. (1994) Meyer, D. M., Jura, M., Hawkins, I., & Cardelli, J. A. 1994, ApJ, 437, L59
- Moos et al. (2002) Moos, H. W., Sembach, K. R., Vidal-Madjar, A., York, D. G., Friedman, S. D., Hébrard, G., Kruk, J. W., Lehner, N., Lemoine, M., Sonneborn, G., Wood, B. E., Ake, T. B., André, M., Blair, W. P., Chayer, P., Gry, C., Dupree, A. K., Ferlet, R., Feldman, P. D., Green, J. C., Howk, J. C., Hutchings, J. B., Jenkins, E. B., Linsky, J. L., Murphy, E. M., Oegerle, W. R., Oliveira, C., Roth, K., Sahnow, D. J., Savage, B. D., Shull, J. M., Tripp, T. M., Weiler, E. J., Welsh, B. Y., Wilkinson, E., & Woodgate, B. E. 2002, ApJS, 140, 3
- Ossenkopf et al. (1992) Ossenkopf, V., Henning, Th., & Mathis, J. S. 1992, A&A, 261, 567
- Raboud, Cramer, & Bernasconi (1997) Raboud, D., Cramer, N., & Bernasconi, P. A. 1997, A&A, 325, 167
- Rachford et al. (2002) Rachford, B. L., Snow, T. P., Tumlinson, J., Shull, J. M., Blair, W. P., Ferlet, R., Friedman, S. D., Gry, C., Jenkins, E. B., Morton, D. C., Savage, B. D., Sonnentrucker, P., Vidal-Madjar, A., Welty, D. E., & York, D. G. 2002, ApJ, 577, 221
- Reed (1993) Reed, B. C. 1993, PASP, 105, 1465
- Reed (2000) Reed, B. C. 2000, AJ, 119, 1855
- Savage et al. (1977) Savage, B. D., Bohlin, R. C., Drake, J. F., & Budich, W. 1977, ApJ, 216, 291
- Savage & Sembach (1991) Savage, B. D., & Sembach, K. R. 1991, ApJ, 379, 245
- Savage & Sembach (1996) Savage, B. D., & Sembach, K. R. 1996, ARA&A, 34, 279
- Seab & Snow (1984) Seab, C. G., & Snow, T. P., Jr. 1984, ApJ, 277, 200
- Sembach & Savage (1996) Sembach, K. R., & Savage, B. D. 1996, ApJ, 457, 211
- Sofia (2004) Sofia, U. J. 2004, in ASP Conf. Ser. 309, Astrophysics of Dust, ed. A. N. Witt, G. C. Clayton, & B. T. Draine (San Francisco: ASP), 393
- Sofia et al. (2004) Sofia, U. J., Lauroesch, J. T., Meyer, D. M., & Cartledge, S. I. B. 2004, ApJ, 605, 272
- Sofia & Meyer (2001) Sofia, U. J., & Meyer, D. M. 2001, ApJ, 554, L221
- Spaans (1996) Spaans, M. 1996, A&A, 307, 271
- Spitzer (1985) Spitzer, L. 1987, ApJ, 290, L21
- Steigman (2003) Steigman, G. 2003, ApJ, 586, 1120
- Sudzius & Bobinas (1992) Sudzius, J., & Bobinas, V. 1992, Bull. Vilnius Obs., 86, 59
- Theodosiou & Federman (1999) Theodosiou, C. E., & Federman, S. R. 1999, ApJ, 527, 470
- Timmes et al. (1995) Timmes, F. X., Woosley, S. E., & Weaver, T. A. 1995, ApJS, 98, 617
- Tobin & Kaufmann (1984) Tobin, W., & Kaufmann, J. P. 1984, MNRAS, 207, 369
- Van Steenberg & Shull (1988) Van Steenberg, M. E., & Shull, J. M. 1988, ApJ, 330, 942
- Welty, Hobbs, & York (1991) Welty, D. E., Hobbs, L. M., & York, D. G. 1991, ApJS, 75, 425
- Welty et al. (1999) Welty, D. E., Hobbs, L. M., Lauroesch, J. T., Morton, D. C., Spitzer, L., & York, D. G. 1999, ApJS, 124, 465
- Westin (1982) Westin, T. N. G. 1982, A&AS, 49, 561
- Westin (1985) Westin, T. N. G. 1985, A&AS, 60, 99
- Whittet (2003) Whittet, D. C. B. 2003, Dust in the Galactic Environment (Bristol:Institute of Physics)
- York et al. (1983) York, D. G., Spitzer, L., Bohlin, R. C., Hill, J., Jenkins, E. B., Savage, B. D., & Snow, T. P. 1983, ApJ, 266, L55
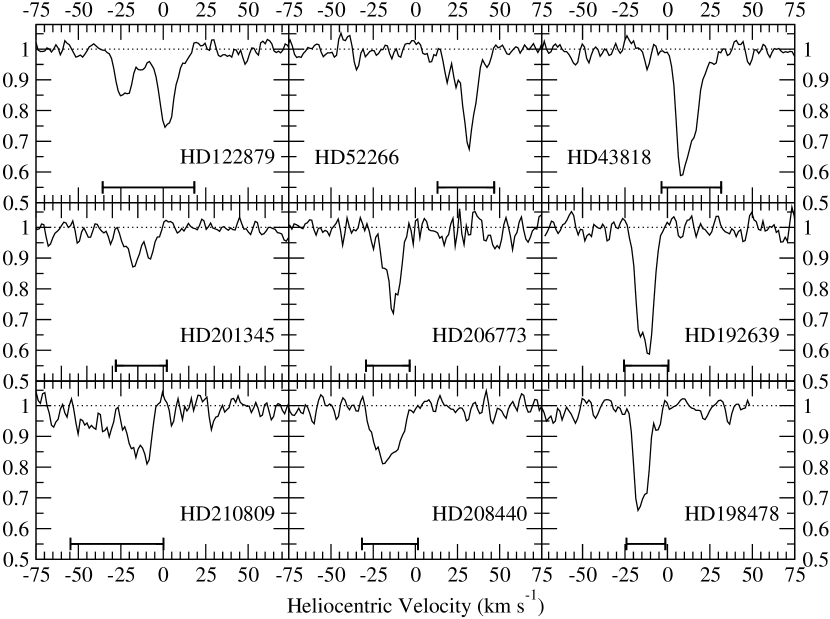
A selection of O I 1356 absorption profiles are plotted above as a function of the heliocentric velocity. In each panel, the velocity range encompassed by the absorption features is identified by the line along the bottom axis. These widths were determined in consideration of the profiles for the dominant ionization states of oxygen, magnesium, phosphorus, manganese, nickel, copper, and germanium; other lines used in an advisory role included C I, S I, and Cl I transitions in the 1170 – 1372Å window. The upper left panel, corresponding to HD122879, depicts a typical example of a multi-component oxygen profile. In the panels below it on the left, for HD201345 and HD210809, examples of the least reliable measurements are shown for relatively narrow and wide profiles, respectively. The middle panels, for HD52266, HD206773, and HD208440, are profiles characteristic of the general narrow (a few to one component) feature. Panels on the right are representative of the deepest and most obvious oxygen profiles among the new sight lines; the bottom right panel depicts the oxygen profile for HD198478, which lies along the high-density plateau of the Boltzmann function.
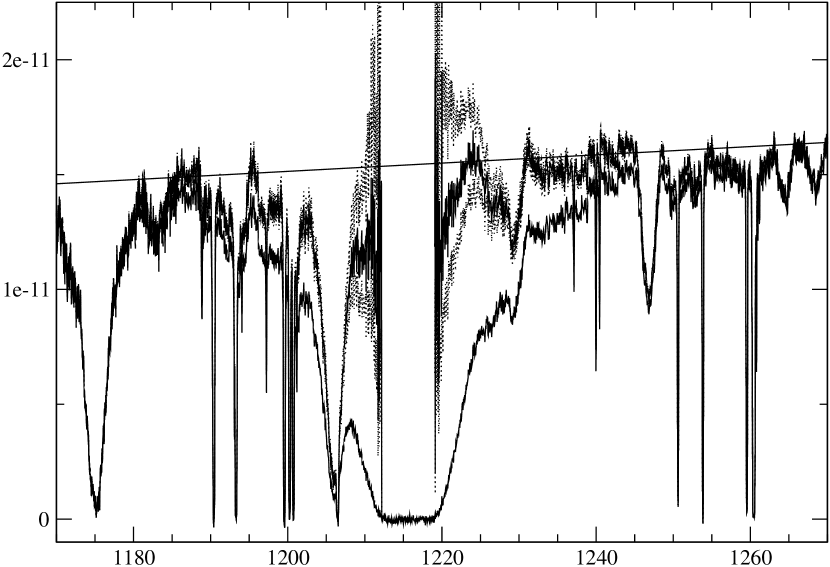
Measurement of the H I column density is performed through division of the calibrated and combined STIS spectrum near 1215.6700Å (Ly) by model absorption profiles generated by FITS6P. The STIS spectrum for HD165955 and the reconstructed continuum are shown above with solid lines; continuum reconstructions for column densities differing from the best value by the 1 uncertainty are plotted as dotted lines. These spectra have been smoothed by a factor of 3 for presentation purposes. The straight line across the spectrum is a linear approximation of the continuum in this region.
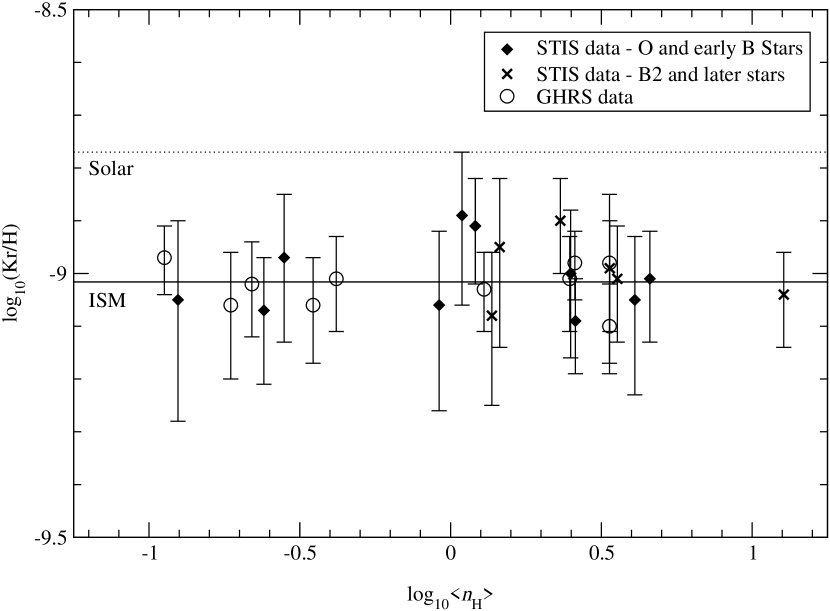
The variation of krypton abundance with mean total hydrogen sight line density is depicted above for paths compiled from Cartledge et al. (2003) and André et al. (2003). The concern that the atomic hydrogen abundances derived for B3 stars in the current sample suffer from stellar contamination is belied by the similarity between the distributions of B3 Kr/H ratios and those for paths ending at stars of other types for which such contamination is not a problem. HD116852 and HD152590 have been excluded (see Cartledge et al. 2003).
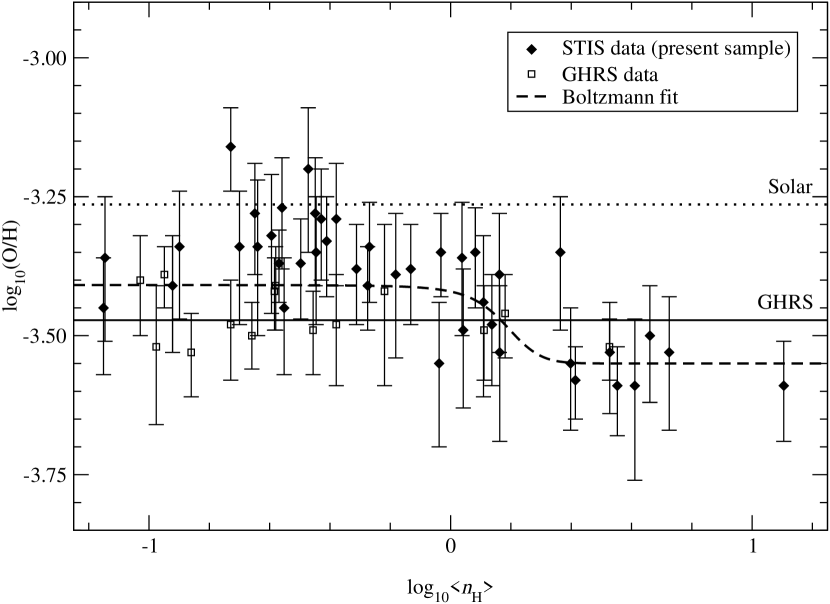
Oxygen abundances are plotted above as a function of the sight line property , identifying a trend consistent with the density-dependent depletion signatures evident for other elements (Cartledge et al., 2004). Fit with a 4-parameter Boltzmann function (dashed line), the data indicate that gas-phase oxygen levels vary from 39010 to 28412 as increases from 0.1 to 10.0 cm-3. The solar (Holweger, 2001) and GHRS (Meyer, Jura, & Cardelli, 1998) O/H levels are plotted for reference; the Asplund et al. (2004) solar oxygen abundance is somewhat lower than the Holweger (2001) value, at log10(O/H)☉ = 3.340.05 (45756 ), but the two levels agree within error.
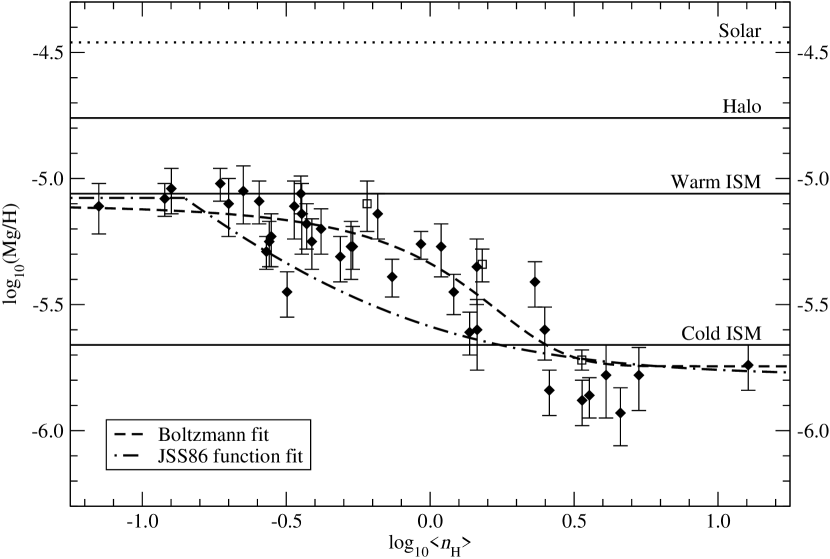
Gas-phase magnesium to hydrogen abundance ratios from Cartledge et al. (2004) are plotted above as a function of the mean total hydrogen sight line density. Visual inspection of this graph and the dependency depicted in Figure 4 demonstrates how similar they are in form, as the gas-phase abundance undergoes a smooth transition from one apparent plateau to a second lower one as mean sight line density increases. Furthermore, the 4-parameter Boltzmann function appears better suited to the data than the 2-parameter function used by Jenkins et al. (1986) (identified as JSS86 in the plot above). The solar reference ratio was taken from Holweger (2001) and the halo and warm and cold ISM Mg/H levels were compiled by Welty et al. (1999).
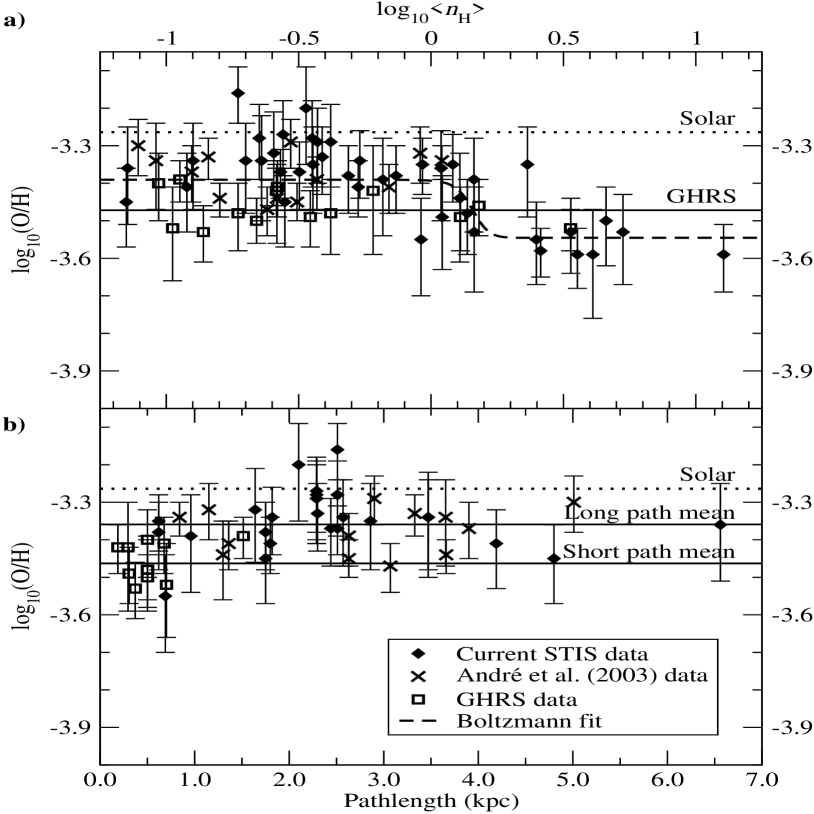
a) Data from André et al. (2003) are added to the comparison of STIS and GHRS O/H abundance ratios as a function of . The additional data are consistent with our measurements for low density sight lines and do not significantly alter the parameters determined for a Boltzmann function fit to the entire dataset. b) Gas-phase O/H ratios for paths with 1.0 cm-3 are plotted as a function of distance to the target star, with the addition of André et al. (2003) data. The GHRS datapoints generally have lower O/H ratios than their STIS counterparts, producing a 0.10 dex difference between the mean O/H value for sight lines shorter and longer than 800 pc. The solar (Holweger, 2001) and GHRS (Meyer, Jura, & Cardelli, 1998) O/H levels are plotted for reference in each panel; the Asplund et al. (2004) solar oxygen abundance is somewhat lower than the Holweger (2001) value, at log10(O/H)☉ = 3.340.05 (45756 ).
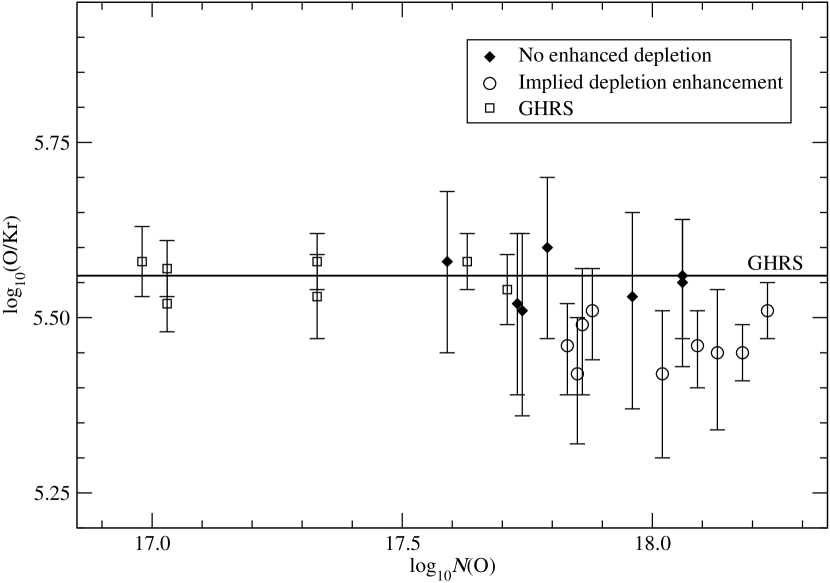
Gas-phase O/Kr abundance ratios are plotted above for all paths in the current sample with reliable oxygen and krypton measurements except HD116852 and HD152590; the krypton abundances along these two sight lines are unusually large and are not included for this reason. The GHRS data are all consistent with a single mean ratio and are well-matched by lower density STIS sight lines. However, higher density paths that exhibit enhanced oxygen depletion with respect to hydrogen also evince lower O/Kr ratios, in contrast to the GHRS data. Unfortunately, this distinction is not definitive because of the large uncertainties associated with the STIS measurements.
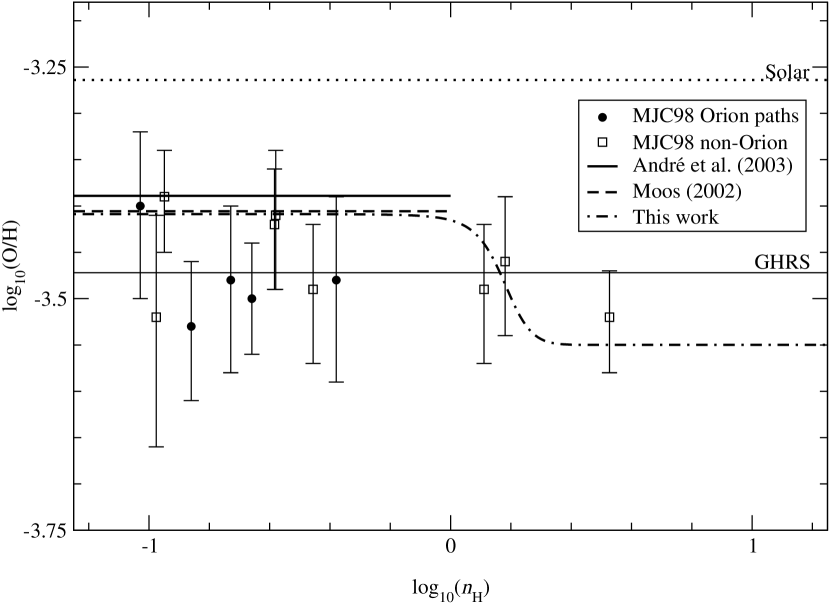
Gas-phase O/H abundance ratios for the GHRS sight lines compiled by Meyer, Jura, & Cardelli (1998) (identified in the plot as MJC98) are plotted above as a function of mean total hydrogen sight line density. Reference oxygen levels are the GHRS weighted mean (Meyer, Jura, & Cardelli, 1998), the solar ratio (Holweger, 2001), the André et al. (2003) and Moos et al. (2002) low- means and the density-dependent depletion trend identified in this paper. Of the five Orion sight lines appearing in Meyer, Jura, & Cardelli (1998), only Ori is situated near the bulk of other low- oxygen measurements. The others dominate the sample that results in the reduced mean for short diffuse sight lines that distinguish them from longer diffuse paths.
| STIS | Time | FUSE | Time | |||
|---|---|---|---|---|---|---|
| Sight Line | Data Set | Date | (s) | Data Set | Date | (s) |
| HD1383 | O5C07C010 | 1999 Nov 08 | 1440 | B0710101000 | 2000 Sep 30 | 23332 |
| HD12323 | O63505010 | 2001 Apr 02 | 1440 | P1020202000 | 1999 Nov 25 | 3865 |
| HD13268 | O63506010 | 2001 Feb 01 | 1440 | P1020304000 | 1999 Nov 24 | 4438 |
| HD14434 | O63508010 | 2001 Apr 06 | 1440 | P1020504000 | 1999 Nov 24 | 4441 |
| HD36841 | O63516010 | 2000 Nov 24 | 1440 | — | — | — |
| HD37367 | O5C013010 | 2000 Mar 31 | 360 | — | — | — |
| HD43818 | O5C07I010 | 2001 Apr 10 | 1440 | — | — | — |
| HD52266 | O5C027010 | 2000 Mar 11 | 360 | — | — | — |
| HD63005 | O63531010 | 2001 May 07 | 1440 | P1022101000 | 2000 Apr 05 | 5311 |
| HD71634 | O5C090010 | 2000 May 22 | 720 | Z9012201000 | 2002 Mar 08 | 504 |
| HD72754 | O5C03E010 | 1999 Oct 14 | 720 | B0710302000 | 2002 May 04 | 5950 |
| HD79186 | O5C092010 | 2000 May 25 | 360 | P2310301000 | 2002 May 04 | 5393 |
| HD91824 | O5C095010 | 2000 Mar 23 | 360 | A1180802000 | 2000 Feb 06 | 4649 |
| HD91983 | O5C08N010 | 2000 May 18 | 1440 | B0710402000 | 2001 May 27 | 4308 |
| HD111934 | O5C03N010 | 2000 Mar 27 | 720 | — | — | — |
| HD116852 | O5C01C010 | 2000 Jun 25 | 360 | P1013801000 | 2000 May 27 | 7212 |
| HD122879 | O5C037010 | 2000 May 08 | 360 | B0710501000 | 2002 Mar 03 | 1532 |
| HD148594 | O5C04A010 | 2000 May 21 | 720 | P2310101000 | 2001 Aug 19 | 4016 |
| HD152590 | O5C08P010 | 2000 Mar 03 | 1440 | B0710602000 | 2001 Aug 12 | 2773 |
| — | — | — | B0710601000 | 2001 Jul 08 | 1389 | |
| HD156110 | O5C01K010 | 1999 Nov 12 | 360 | B0710701000 | 2001 May 08 | 503 |
| HD157857 | O5C04D010 | 2000 Jun 03 | 720 | P1027501000 | 2000 Sep 02 | 4022 |
| HD165955 | O63599010 | 2001 May 11 | 1440 | P1027901000 | 2000 Aug 17 | 4140 |
| HD190918 | O6359J010 | 2000 Oct 12 | 720 | P1028501000 | 2000 Jul 18 | 5510 |
| HD192035 | O6359K010 | 2001 Feb 21 | 1440 | P1028603000 | 2000 Jun 21 | 6624 |
| — | — | — | P1028602000 | 2000 Jun 19 | 6148 | |
| — | — | — | P1028601000 | 2000 Jun 17 | 4942 | |
| HD192639 | O5C08T010 | 2000 Mar 01 | 1440 | P1162401000 | 2000 Jun 12 | 4834 |
| HD198478 | O5C06J010 | 2000 Apr 04 | 720 | P2350201000 | 2001 Jun 06 | 6628 |
| HD198781 | O5C049010 | 1999 Sep 06 | 360 | P2310201000 | 2001 Jul 21 | 844 |
| HD201345 | O5C050010 | 1999 Nov 12 | 360 | P1223001000 | 2000 Jun 13 | 5104 |
| HD203532 | O5C01S010 | 2000 Jun 29 | 720 | B0710801000 | 2001 Aug 23 | 4748 |
| HD206773 | O5C04T010 | 1999 Aug 12 | 360 | B0710901000 | 2001 Jul 19 | 4399 |
| HD208440 | O5C06M010 | 1999 Nov 05 | 720 | B0300401000 | 2001 Aug 03 | 9777 |
| HD210809 | O5C01V010 | 1999 Oct 30 | 720 | P1223103000 | 2000 Aug 08 | 10065 |
| O6359T010 | 2001 Apr 24 | 720 | P1223102000 | 2000 Aug 07 | 7097 | |
| — | — | — | P1223101000 | 2000 Aug 05 | 5508 | |
| HD212791 | O5C04Q010 | 2000 Apr 25 | 1440 | Z9017701000 | 2002 Jun 30 | 2261 |
| HD220057 | O5C01X010 | 2000 Mar 24 | 360 | Z9017801000 | 2002 Aug 30 | 3037 |
| HD232522 | O5C08J010 | 1999 Oct 09 | 1440 | P1220101000 | 1999 Nov 28 | 16800 |
| HD308813 | O63559010 | 2001 Feb 18 | 1440 | P1221903000 | 2000 Mar 27 | 5667 |
| — | — | — | P1221902000 | 2000 Mar 25 | 4340 | |
| — | — | — | P1221901000 | 2000 Mar 23 | 4257 | |
| BD 53 2820 | O6359Q010 | 2001 Feb 05 | 1440 | M1141301000 | 2000 Aug 06 | 2529 |
| — | — | — | P1223203000 | 2000 Aug 08 | 5147 | |
| — | — | — | P1223202000 | 2000 Aug 07 | 7119 | |
| — | — | — | P1223201000 | 2000 Aug 06 | 5815 | |
| CPD 69 1743 | O63566010 | 2001 Feb 20 | 1440 | P1013701000 | 2000 Apr 06 | 3567 |
| Component Velocities | -values | log(O)A | log(O)P | log(O) | ||||||
|---|---|---|---|---|---|---|---|---|---|---|
| Star | (km s-1) | (km s-1) | (mÅ) | (cm-2) | (cm-2) | (cm-2) | ||||
| HD1383 | 62.5 58.0 50.5 45.5 40.6 | 2.2 2.7 2.4 2.6 2.8 | 24.1 | (2.8) | 18.15 | (0.05) | 18.15 | (0.03) | 18.15 | (0.06) |
| 36.1 31.7 25.7 20.6 15.6 | 2.7 1.3 2.2 2.3 2.4 | |||||||||
| 10.8 6.0 2.1 | 2.3 2.4 2.3 | |||||||||
| HD12323 | 45.9 33.8 16.9 8.7 1.1 | 3.5 3.3 4.0 2.5 3.1 | 18.9 | (1.6) | 18.03 | (0.04) | 18.02 | (0.04) | 18.02 | (0.06) |
| HD13268 | 37.4 19.1 9.8 2.2 | 4.3 4.1 3.0 3.6 | 23.3 | (2.6) | 18.12 | (0.05) | 18.13 | (0.04) | 18.13 | (0.06) |
| HD14434 | 78.6 63.8 52.6 40.8 25.0 | 2.8 4.4 5.0 3.8 3.0 | 27.2 | (3.6) | 18.19 | (0.05) | 18.18 | (0.07) | 18.18 | (0.08) |
| 18.5 9.2 1.4 | 3.2 3.7 3.3 | |||||||||
| HD36841 | 29.9 | 3.2 | 7.9 | (1.1) | 17.65 | (0.06) | 17.63 | (0.06) | 17.63 | (0.08) |
| HD37367 | 11.5 16.5 | 2.3 2.7 | 16.4 | (1.1) | 18.03 | (0.08) | 18.06 | (0.02) | 18.06 | (0.08) |
| HD43818 | 4.0 8.8 13.4 17.8 21.1 | 1.7 2.0 2.8 1.8 1.6 | 26.2 | (1.4) | 18.22 | (0.02) | 18.22 | (0.02) | 18.22 | (0.03) |
| 25.3 | 2.4 | |||||||||
| HD52266 | 5.2 11.3 19.1 24.8 32.8 | 2.8 2.0 3.3 2.1 4.2 | 17.1 | (1.3) | 18.00 | (0.03) | 18.01 | (0.01) | 18.01 | (0.03) |
| 42.0 | 1.6 | |||||||||
| HD63005 | 28.7 38.4 | 4.6 3.8 | 14.9 | (0.7) | 17.94 | (0.02) | 17.95 | (0.03) | 17.95 | (0.04) |
| HD71634 | 4.4 8.1 12.2 17.6 22.1 | 2.0 1.6 4.0 3.0 2.7 | 5.4 | (0.6) | 17.49 | (0.05) | 17.49 | (0.03) | 17.49 | (0.06) |
| HD72754 | 17.1 20.8 26.3 | 1.4 1.5 2.7 | 8.7 | (1.1) | 17.72 | (0.05) | 17.74 | (0.04) | 17.74 | (0.06) |
| HD79186 | 6.8 11.8 19.0 24.8 30.2 | 1.2 2.6 2.5 1.5 1.4 | 18.0 | (1.2) | 18.03 | (0.03) | 18.04 | (0.02) | 18.04 | (0.04) |
| HD91824 | 18.7 13.7 7.0 1.1 8.4 | 1.5 2.7 2.8 2.0 3.3 | 17.3 | (1.5) | 18.00 | (0.04) | 18.00 | (0.03) | 18.00 | (0.05) |
| 15.4 | 1.2 | |||||||||
| HD91983 | 16.3 11.2 3.7 7.6 11.9 | 2.2 1.4 2.8 2.9 2.0 | 15.6 | (1.6) | 17.95 | (0.04) | 17.96 | (0.02) | 17.96 | (0.04) |
| 18.4 | 2.0 | |||||||||
| HD111934 | 34.8 24.2 19.5 14.6 9.1 | 1.9 2.5 2.9 2.2 2.3 | 25.4 | (2.8) | 18.17 | (0.05) | 18.18 | (0.07) | 18.17 | (0.08) |
| 3.9 3.3 7.4 15.0 | 1.4 2.4 2.4 3.1 | |||||||||
| HD116852 | 3.4 9.7 15.4 | 2.1 1.8 1.2 | 6.6 | (0.6) | 17.57 | (0.04) | 17.57 | (0.03) | 17.57 | (0.05) |
| HD122879 | 28.4 24.1 19.6 15.6 9.9 | 1.3 2.7 2.2 2.3 2.2 | 23.8 | (1.7) | 18.14 | (0.03) | 18.14 | (0.05) | 18.14 | (0.06) |
| 3.8 0.0 4.3 9.4 | 2.0 2.1 1.8 1.2 | |||||||||
| HD148594 | 10.5 4.7 | 1.6 2.2 | 10.5 | (0.6) | 17.82 | (0.02) | 17.86 | (0.02) | 17.86 | (0.03) |
| HD156110 | 25.3 17.9 | 1.8 2.3 | 3.4 | (0.6) | 17.26 | (0.07) | 17.25 | (0.05) | 17.25 | (0.09) |
| HD157857 | 19.9 12.9 7.3 | 1.0 2.5 3.7 | 19.9 | (0.8) | 18.10 | (0.02) | 18.11 | (0.03) | 18.11 | (0.04) |
| HD165955 | 16.2 3.1 11.2 | 2.9 4.3 2.9 | 11.1 | (1.8) | 17.78 | (0.07) | 17.79 | (0.06) | 17.79 | (0.09) |
| HD190918 | 24.2 13.3 1.2 14.1 | 4.5 5.7 4.0 5.5 | 23.4 | (2.2) | 18.12 | (0.04) | 18.12 | (0.07) | 18.12 | (0.08) |
| HD192035 | 22.5 12.5 3.5 | 5.1 4.9 3.8 | 17.7 | (1.3) | 18.01 | (0.03) | 18.01 | (0.03) | 18.01 | (0.04) |
| HD192639 | 16.1 9.5 | 2.7 2.5 | 21.0 | (1.0) | 18.13 | (0.02) | 18.14 | (0.03) | 18.14 | (0.04) |
| HD198478 | 21.6 17.3 12.1 7.4 | 2.2 2.2 2.0 1.8 | 16.5 | (1.0) | 18.00 | (0.03) | 18.02 | (0.04) | 18.02 | (0.05) |
| HD198781 | 46.5 41.1 35.8 30.9 27.5 | 2.0 1.5 2.1 1.5 1.0 | 9.7 | (0.8) | 17.75 | (0.04) | 17.77 | (0.05) | 17.77 | (0.06) |
| 21.7 15.8 9.2 2.7 | 3.7 2.9 2.3 2.8 | |||||||||
| HD201345 | 25.3 21.1 16.8 13.1 8.6 | 1.3 1.2 2.3 2.0 2.5 | 8.2 | (1.2) | 17.66 | (0.05) | 17.66 | (0.04) | 17.66 | (0.06) |
| 4.3 | 2.7 | |||||||||
| HD206773 | 26.3 20.6 15.2 11.0 6.0 | 2.1 2.4 1.9 1.8 3.1 | 13.0 | (1.3) | 17.88 | (0.04) | 17.90 | (0.04) | 17.90 | (0.05) |
| HD208440 | 29.1 23.1 17.8 12.8 6.3 | 1.3 2.5 1.7 2.8 1.4 | 15.9 | (1.5) | 17.96 | (0.04) | 17.96 | (0.06) | 17.96 | (0.07) |
| HD210809 | 52.1 46.1 38.5 34.2 28.3 | 2.2 1.6 2.1 0.9 1.0 | 18.6 | (2.7) | 18.02 | (0.06) | 17.99 | (0.04) | 17.99 | (0.07) |
| 20.1 13.8 9.1 1.5 | 2.4 2.0 2.5 1.5 | |||||||||
| HD212791 | 27.9 24.9 21.0 16.3 11.0 | 2.8 2.2 2.6 2.6 2.4 | 12.2 | (1.4) | 17.83 | (0.05) | 17.83 | (0.03) | 17.83 | (0.06) |
| 6.8 | 3.5 | |||||||||
| HD220057 | 16.7 10.6 6.3 | 2.6 3.0 3.0 | 11.2 | (1.0) | 17.82 | (0.04) | 17.79 | (0.04) | 17.79 | (0.06) |
| HD232522 | 22.5 16.8 9.6 6.1 | 2.0 2.0 2.2 2.2 | 10.2 | (1.2) | 17.76 | (0.05) | 17.78 | (0.07) | 17.78 | (0.08) |
| HD308813 | 31.9 16.2 5.6 4.9 19.2 | 4.7 4.1 3.7 5.0 2.5 | 15.0 | (1.9) | 17.92 | (0.05) | 17.90 | (0.06) | 17.90 | (0.08) |
| BD+53 2820 | 58.8 44.3 34.6 28.4 16.3 | 3.1 4.1 3.4 2.3 4.9 | 19.8 | (3.9) | 18.05 | (0.08) | 18.05 | (0.09) | 18.05 | (0.12) |
| 6.8 6.1 21.2 | 3.6 4.1 | |||||||||
| CPD-69 1743 | 23.7 13.5 2.5 7.4 20.2 | 2.6 3.4 3.9 5.0 1.8 | 11.5 | (2.7) | 17.80 | (0.09) | 17.80 | (0.09) | 17.80 | (0.12) |
Note. — The three oxygen column densities listed above refer to the values determined by apparent optical depth analysis (subscript ), profile fitting (subscript ), and the adopted result. Table entries are restricted to sight lines for which we have not previously published oxygen profile data.
| log10[(H I)] | log10[(H2)] | log10[(H)] | log10[(O)] | log | |||||||||
|---|---|---|---|---|---|---|---|---|---|---|---|---|---|
| Star | (cm-2) | (cm-2) | (cm-2) | (cm-2) | log10[O/H] | (cm-3) | log(H2) | ||||||
| HD1383 | 21.42 | (0.09) | 20.45 | (0.07) | 21.50 | (0.08) | 18.15 | (0.06) | 3.35 | (0.10) | 0. | 45 | 0.75 |
| HD12323 | 21.18 | (0.09) | 20.32 | (0.08) | 21.29 | (0.07) | 18.02 | (0.06) | 3.27 | (0.09) | 0. | 56 | 0.67 |
| HD13268 | 21.32 | (0.09) | 20.42 | (0.07) | 21.42 | (0.07) | 18.13 | (0.06) | 3.29 | (0.09) | 0. | 43 | 0.70 |
| HD14434 | 21.37 | (0.09) | 20.47 | (0.07) | 21.47 | (0.07) | 18.18 | (0.08) | 3.29 | (0.10) | 0. | 38 | 0.70 |
| HD27778 | 21.10 | (0.12) | 20.72 | (0.08) | 21.36 | (0.08) | 17.83 | (0.04) | 3.53 | (0.09) | 0. | 53 | 0.34 |
| HD37021 | 21.68 | (0.12) | … | 21.68 | (0.12) | 18.09 | (0.03) | 3.59 | (0.12) | 0. | 61 | … | |
| HD37061 | 21.73 | (0.09) | … | 21.73 | (0.09) | 18.23 | (0.02) | 3.50 | (0.09) | 0. | 66 | … | |
| HD37367 | 21.28 | (0.09) | 20.53 | (0.09) | 21.41 | (0.07) | 18.06 | (0.08) | 3.35 | (0.10) | 0. | 36 | 0.58 |
| HD37903 | 21.16 | (0.09) | 20.85 | (0.07) | 21.46 | (0.06) | 17.88 | (0.02) | 3.58 | (0.06) | 0. | 41 | 0.31 |
| HD43818aaAtomic hydrogen column densities cannot reliably be measured toward HD148594 and HD175360 because of significant stellar contamination of the interstellar H I absorption features. The H I abundances listed above for these paths refer to the combined stellar and interstellar profiles in each spectrum. FUSE data are not available for HD43818; consequently, a measurement of (H@) cannot be made for this sight line. The total hydrogen column density for each of these paths was thus derived from krypton measurements assuming the constancy of the Kr/H abundance ratio within several hundred parsecs (Cartledge et al., 2003). The krypton abundance measurement for HD43818 is somewhat poorer in quality (log(Kr) = 12.690.09) than those for HD148594 and HD175360 (Cartledge et al., 2001, 2003), necessitating larger (H) error bars for this sight line in the Figures and a correspondingly lower weight in the Boltzmann function fitting procedure. | 21.60 | (0.12) | … | 21.71 | (0.11) | 18.22 | (0.03) | 3.49 | (0.11) | 0. | 04 | … | |
| HD63005 | 21.24 | (0.06) | 20.23 | (0.09) | 21.32 | (0.05) | 17.95 | (0.04) | 3.37 | (0.06) | 0. | 57 | 0.79 |
| HD72754 | 21.18 | (0.12) | 20.35 | (0.10) | 21.29 | (0.10) | 17.74 | (0.06) | 3.55 | (0.11) | 0. | 04 | 0.64 |
| HD75309 | 21.08 | (0.09) | 20.20 | (0.12) | 21.18 | (0.08) | 17.73 | (0.05) | 3.45 | (0.09) | 0. | 55 | 0.68 |
| HD79186 | 21.20 | (0.09) | 20.72 | (0.09) | 21.42 | (0.07) | 18.04 | (0.04) | 3.38 | (0.08) | 0. | 31 | 0.40 |
| HD91824 | 21.12 | (0.06) | 19.85 | (0.07) | 21.16 | (0.05) | 18.00 | (0.05) | 3.16 | (0.07) | 0. | 73 | 1.01 |
| HD91983 | 21.17 | (0.09) | 20.14 | (0.07) | 21.24 | (0.08) | 17.96 | (0.04) | 3.28 | (0.09) | 0. | 65 | 0.80 |
| HD116852 | 20.96 | (0.09) | 19.79 | (0.11) | 21.02 | (0.08) | 17.57 | (0.05) | 3.45 | (0.09) | 1. | 15 | 0.93 |
| HD122879 | 21.26 | (0.12) | 20.24 | (0.09) | 21.34 | (0.10) | 18.14 | (0.06) | 3.20 | (0.11) | 0. | 47 | 0.80 |
| HD147888bbAs stated in the text, HD147933 was used as a proxy for hydrogen abundances toward HD147888. Of note, the atomic component determined from Ly absorption in the STIS UV spectrum for HD147888 matched the value for HD147933 determined by a weighted mean of abundances determined by Bohlin, Savage, & Drake (1978) and Diplas & Savage (1994). | 21.71 | (0.09) | 20.57 | (0.15) | 21.77 | (0.08) | 18.18 | (0.02) | 3.59 | (0.08) | 1. | 11 | 0.90 |
| HD148594aaAtomic hydrogen column densities cannot reliably be measured toward HD148594 and HD175360 because of significant stellar contamination of the interstellar H I absorption features. The H I abundances listed above for these paths refer to the combined stellar and interstellar profiles in each spectrum. FUSE data are not available for HD43818; consequently, a measurement of (H@) cannot be made for this sight line. The total hydrogen column density for each of these paths was thus derived from krypton measurements assuming the constancy of the Kr/H abundance ratio within several hundred parsecs (Cartledge et al., 2003). The krypton abundance measurement for HD43818 is somewhat poorer in quality (log(Kr) = 12.690.09) than those for HD148594 and HD175360 (Cartledge et al., 2001, 2003), necessitating larger (H) error bars for this sight line in the Figures and a correspondingly lower weight in the Boltzmann function fitting procedure. | 21.80 | (0.15) | 19.88 | (0.07) | 21.39 | (0.10) | 17.86 | (0.03) | 3.53 | (0.10) | 0. | 72 | 1.21 |
| HD152590 | 21.37 | (0.06) | 20.47 | (0.07) | 21.47 | (0.05) | 18.06 | (0.05) | 3.41 | (0.07) | 0. | 28 | 0.70 |
| HD157857 | 21.26 | (0.09) | 20.68 | (0.10) | 21.44 | (0.07) | 18.11 | (0.04) | 3.33 | (0.08) | 0. | 41 | 0.46 |
| HD165955 | 21.11 | (0.06) | 16.53 | (0.04) | 21.11 | (0.06) | 17.79 | (0.09) | 3.32 | (0.11) | 0. | 59 | 4.28 |
| HD175360aaAtomic hydrogen column densities cannot reliably be measured toward HD148594 and HD175360 because of significant stellar contamination of the interstellar H I absorption features. The H I abundances listed above for these paths refer to the combined stellar and interstellar profiles in each spectrum. FUSE data are not available for HD43818; consequently, a measurement of (H@) cannot be made for this sight line. The total hydrogen column density for each of these paths was thus derived from krypton measurements assuming the constancy of the Kr/H abundance ratio within several hundred parsecs (Cartledge et al., 2003). The krypton abundance measurement for HD43818 is somewhat poorer in quality (log(Kr) = 12.690.09) than those for HD148594 and HD175360 (Cartledge et al., 2001, 2003), necessitating larger (H) error bars for this sight line in the Figures and a correspondingly lower weight in the Boltzmann function fitting procedure. | 21.53 | (0.09) | … | 21.02 | (0.11) | 17.59 | (0.06) | 3.43 | (0.12) | 0. | 11 | … | |
| HD185418 | 21.19 | (0.09) | 20.71 | (0.12) | 21.41 | (0.07) | 18.06 | (0.05) | 3.35 | (0.08) | 0. | 08 | 0.40 |
| HD190918 | 21.38 | (0.06) | 19.84 | (0.08) | 21.40 | (0.06) | 18.12 | (0.08) | 3.28 | (0.10) | 0. | 45 | 1.26 |
| HD192035 | 21.20 | (0.09) | 20.62 | (0.07) | 21.38 | (0.07) | 18.01 | (0.04) | 3.37 | (0.08) | 0. | 50 | 0.46 |
| HD192639 | 21.29 | (0.09) | 20.73 | (0.10) | 21.48 | (0.07) | 18.14 | (0.04) | 3.34 | (0.08) | 0. | 27 | 0.45 |
| HD198478 | 21.32 | (0.15) | 20.87 | (0.15) | 21.55 | (0.11) | 18.02 | (0.05) | 3.53 | (0.12) | 0. | 16 | 0.38 |
| HD198781 | 20.91 | (0.09) | 20.48 | (0.07) | 21.15 | (0.06) | 17.77 | (0.06) | 3.38 | (0.08) | 0. | 13 | 0.37 |
| HD201345 | 20.97 | (0.09) | 19.55 | (0.13) | 21.00 | (0.08) | 17.66 | (0.06) | 3.34 | (0.10) | 0. | 90 | 1.15 |
| HD203532 | 21.27 | (0.09) | 20.64 | (0.08) | 21.44 | (0.07) | 17.85 | (0.02) | 3.59 | (0.07) | 0. | 55 | 0.50 |
| HD206773 | 21.09 | (0.06) | 20.44 | (0.10) | 21.25 | (0.05) | 17.90 | (0.05) | 3.35 | (0.07) | 0. | 03 | 0.51 |
| HD207198 | 21.53 | (0.07) | 20.83 | (0.10) | 21.68 | (0.09) | 18.13 | (0.04) | 3.55 | (0.10) | 0. | 40 | 0.55 |
| HD208440 | 21.23 | (0.09) | 20.29 | (0.07) | 21.32 | (0.08) | 17.96 | (0.07) | 3.36 | (0.10) | 0. | 04 | 0.73 |
| HD210809 | 21.29 | (0.09) | 20.00 | (0.09) | 21.33 | (0.08) | 17.99 | (0.07) | 3.34 | (0.10) | 0. | 70 | 1.03 |
| HD212791 | 21.21 | (0.09) | 19.42 | (0.11) | 21.22 | (0.09) | 17.83 | (0.06) | 3.39 | (0.11) | 0. | 16 | 1.50 |
| HD220057 | 21.17 | (0.09) | 20.28 | (0.07) | 21.27 | (0.07) | 17.79 | (0.06) | 3.48 | (0.09) | 0. | 14 | 0.69 |
| HD232522 | 21.08 | (0.06) | 20.22 | (0.09) | 21.19 | (0.05) | 17.78 | (0.08) | 3.41 | (0.09) | 0. | 92 | 0.67 |
| HD308813 | 21.20 | (0.09) | 20.25 | (0.07) | 21.29 | (0.08) | 17.90 | (0.08) | 3.39 | (0.11) | 0. | 18 | 0.74 |
| BD 53 2820 | 21.35 | (0.09) | 20.01 | (0.11) | 21.39 | (0.08) | 18.05 | (0.12) | 3.34 | (0.12) | 0. | 64 | 1.08 |
| CPD 69 1743 | 21.11 | (0.09) | 19.90 | (0.09) | 21.16 | (0.08) | 17.80 | (0.12) | 3.36 | (0.11) | 1. | 15 | 0.96 |
| Cas | 20.17 | (0.06) | 17.51 | … | 20.18 | (0.05) | 16.76 | (0.04) | 3.42 | (0.06) | 0. | 58 | 2.37 |
| Per | 20.81 | (0.04) | 20.67 | (0.10) | 21.20 | (0.06) | 17.71 | (0.05) | 3.49 | (0.07) | 0. | 11 | 0.23 |
| Per | 20.42 | (0.06) | 19.53 | (0.15) | 20.52 | (0.06) | 17.03 | (0.04) | 3.49 | (0.07) | 0. | 46 | 0.68 |
| Per | 21.08 | (0.06) | 20.53 | (0.08) | 21.27 | (0.05) | 17.81 | (0.05) | 3.46 | (0.07) | 0. | 18 | 0.44 |
| 23 Ori | 20.74 | (0.08) | 18.30 | (0.11) | 20.74 | (0.08) | 17.32 | (0.10) | 3.42 | (0.12) | 0. | 22 | 2.14 |
| OriA | 20.20 | (0.05) | 14.58 | … | 20.20 | (0.05) | 16.67 | (0.05) | 3.53 | (0.07) | 0. | 86 | 5.22 |
| Ori | 20.79 | (0.08) | 19.11 | (0.11) | 20.81 | (0.07) | 17.33 | (0.06) | 3.48 | (0.09) | 0. | 38 | 1.40 |
| Ori | 20.16 | (0.05) | 14.69 | … | 20.16 | (0.05) | 16.76 | (0.07) | 3.40 | (0.08) | 1. | 03 | 5.17 |
| Ori | 20.46 | (0.07) | 16.57 | … | 20.46 | (0.07) | 16.98 | (0.05) | 3.48 | (0.08) | 0. | 73 | 3.59 |
| Ori | 20.53 | (0.04) | 15.68 | … | 20.53 | (0.04) | 17.03 | (0.04) | 3.50 | (0.06) | 0. | 66 | 4.55 |
| 15 Mon | 20.36 | (0.06) | 15.55 | … | 20.36 | (0.06) | 16.84 | (0.09) | 3.52 | (0.11) | 0. | 98 | 4.51 |
| CMa | 20.71 | (0.02) | 15.48 | … | 20.71 | (0.04) | 17.33 | (0.04) | 3.39 | (0.05) | 0. | 96 | 4.93 |
| Oph | 20.71 | (0.02) | 20.65 | (0.05) | 21.15 | (0.03) | 17.63 | (0.04) | 3.52 | (0.05) | 0. | 53 | 0.20 |
| Ara | 20.71 | (0.06) | 19.24 | (0.13) | 20.74 | (0.06) | 17.33 | (0.04) | 3.41 | (0.07) | 0. | 58 | 1.20 |
Note. — Only sight lines with reliable measurements of both oxygen and hydrogen absorption or those for which a reasonable proxy for (H) was available have been included in this table; sight lines identified by their HD numbers or BD or CPD designations were observed using STIS–the remainder were observed with GHRS.
| Sight Line | Alternate | Spectral | Distance | Group | |||
|---|---|---|---|---|---|---|---|
| (HD) | Name | Type | (kpc) | Membership | |||
| 1383 | BD60 25 | B1 II | 0. | 51 | 2. | 86 | Field |
| 12323 | BD54 441 | O9 V | 0. | 41 | 2. | 29 | Per OB1 |
| 13268 | BD55 534 | O8 V | 0. | 44 | 2. | 29 | Per OB1 |
| 14434 | BD56 567 | O5.5 Vnfp | 0. | 48 | 2. | 29 | Per OB1 |
| 27778 | 62 Tau | B3 V | 0. | 38 | 0. | 22 | Gould B. |
| 36841 | BD00 1002 | O8 | 0. | 34 | 0. | 36 | Ori OB1b |
| 37021 | Ori B | B0 V | 0. | 44 | 0. | 38 | Ori OB1d |
| 37061 | Ori | B1 V | 0. | 54 | 0. | 38 | Ori OB1d |
| 37367 | BD29 947 | B2 IV-V | 0. | 40 | 0. | 36 | Field |
| 37903 | BD02 1345 | B1.5 V | 0. | 35 | 0. | 36 | Ori OB1b |
| 43818 | LU Gem | B0 II | 0. | 58 | 1. | 51 | Gem OB1 |
| 52266 | BD05 1912 | O9 V | 0. | 30 | 1. | 73 | Field |
| 63005 | CPD26 2525 | O6 Vf | 0. | 30 | 2. | 51 | Pup OB1 |
| 71634 | CPD57 1513 | B7 IV | 0. | 10 | 0. | 40 | Unknown |
| 72754 | FY Vel | B2 Ia pe | 0. | 36 | 0. | 69 | Unknown |
| 75309 | CPD45 3056 | B1 IIp | 0. | 27 | 1. | 75 | Vel OB1 |
| 79186 | CPD44 5206 | B5 Ia | 0. | 30 | 1. | 75 | Vel OB1 |
| 91824 | CPD57 3463 | O7 | 0. | 27 | 2. | 51 | Car OB1 |
| 91983 | CPD57 3516 | O9.5/B0 Ib | 0. | 26 | 2. | 51 | Car OB1 |
| 111934 | CPD59 4543 | B3 Ib | 0. | 32 | 2. | 40 | Cen OB1 |
| 116852 | CPD78 813 | O9 III | 0. | 22 | 4. | 80 | Runaway |
| 122879 | CPD59 5395 | B0 Ia | 0. | 36 | 2. | 10 | Field |
| 147888 | Oph D | B3 V | 0. | 52 | 0. | 15 | Sco OB2-2 |
| 148594 | CPD27 5408 | B8 V | 0. | 21 | 0. | 15 | Sco OB2-2 |
| 152590 | CPD40 7624 | O7.5 V | 0. | 38 | 1. | 80 | Sco OB1 |
| 156110 | BD45 2509 | B3 Vn | 0. | 03 | 0. | 72 | Unknown |
| 157857 | BD10 4493 | O6.5 IIIf | 0. | 50 | 2. | 30 | Runaway |
| 165955 | CPD34 7625 | B3 Vn | 0. | 14 | 1. | 64 | Field |
| 175360 | CPD23 7307 | B6 III | 0. | 12 | 0. | 27 | Unknown |
| 185418 | BD16 3928 | B0.5 V | 0. | 51 | 0. | 69 | Field |
| 190918 | BD35 3953 | O9.5 Iab | 0. | 41 | 2. | 29 | Cyg OB3 |
| 192035 | BD47 3038 | B0 IV | 0. | 35 | 2. | 44 | Field |
| 192639 | BD36 3958 | O8e | 0. | 66 | 1. | 82 | Cyg OB1 |
| 198478 | 55 Cyg | B3 Ia | 0. | 53 | 0. | 79 | Cyg OB7 |
| 198781 | BD63 1663 | B0.5 V | 0. | 35 | 0. | 62 | Cep OB2 |
| 201345 | BD32 4060 | O9 V | 0. | 18 | 2. | 57 | Field |
| 203532 | CPD83 716 | B3 IV | 0. | 33 | 0. | 25 | Unknown |
| 206773 | BD57 2374 | B0 Vpe | 0. | 44 | 0. | 62 | Cep OB2 |
| 207198 | BD61 2193 | O9 II | 0. | 62 | 0. | 62 | Cep OB2 |
| 208440 | BD61 2217 | B1 V | 0. | 34 | 0. | 62 | Cep OB2 |
| 210809 | BD51 3281 | O9 Iab | 0. | 33 | 3. | 47 | Cep OB1 |
| 212791 | BD51 3372 | B3neaaHamdy, Elazm, & Saad (1991); Kohoutek & Wehmeyer (1999). | 0. | 05 | 0. | 37 | Unknown |
| 220057 | BD60 2521 | B3 IV | 0. | 27 | 0. | 44 | NGC 7654 |
| 232522 | BD54 372 | B1 II | 0. | 18 | 4. | 19 | Field |
| 308813 | CPD 62 2158 | O9.5 V | 0. | 30 | 0. | 96 | IC 2944 |
| BD 53 2820 | B0 IVn | 0. | 36 | 3. | 47 | Cep OB1 | |
| CPD 69 1743 | B0.5 IIIn | 0. | 30 | 6. | 56 | Unknown | |