2 MPE Garching, Giessenbachstraße, 85748 Garching, Germany
XMM-Newton observations of three poor clusters: Similarity in dark matter and entropy profiles down to low mass
We present an analysis of the mass and entropy profiles of three poor galaxy clusters (A1991, A2717 and MKW9) observed with XMM-Newton. The clusters have very similar temperatures (, 2.53 and 2.58 keV), and similar redshifts (). We trace the surface brightness, temperature, entropy and integrated mass profiles with excellent precision up to kpc (A1991 and A2717) and kpc (MKW9). This corresponds to , where is the radius corresponding to a density contrast of 200 with respect to the critical density at the cluster redshifts. None of the surface brightness profiles is well fitted with a single -model. Double isothermal -models provide reasonable fits, and in all cases the value of the external parameter is consistent with the value found for richer clusters. The temperature profiles have central dips but are approximately flat at the exterior, up to the detection limit. The integrated mass profiles are very similar in physical units and are reasonably well fitted with the NFW mass model with concentration parameters in the range and . A King model is inconsistent with these mass data. The entropy profiles are very similar at large scale, but there is some scatter in the very central region ( kpc). However, none of the clusters has an isentropic core.
We then discuss the structural and scaling properties of cluster mass and entropy profiles, including similar quality XMM-Newton data on the slightly cooler cluster A1983 ( keV), and on the massive cluster A1413 ( keV). We find that the mass profiles scaled in units of and nearly coincide, with per cent dispersion in the radial range , where we could compare the profiles without excessive extrapolation. We provide a quantitative test of mass profile shapes by combining the concentration parameters of these poor clusters with other values of similar precision from the literature, and comparing with the – relation derived from numerical simulations for a CDM cosmology. The data are fully consistent with the predictions, taking into account the measurement errors and expected intrinsic scatter, in the mass range . This excellent agreement with theoretical predictions - a quasi universal cusped mass profile with concentration parameters as expected - shows that the physics of the dark matter collapse is basically understood. Scaling the entropy profiles using the self-similar relation , we find a typical scatter of per cent in scaled entropy in the radial range . The dispersion is reduced ( per cent) if we use the empirical relation . The scatter is nearly constant with radius, indicating a genuine similarity in entropy profile shape. The averaged scaled profile is well fitted by a power law for , with a slope slightly lower than expected from pure shock heating (), and a normalisation at consistent with previous ROSAT/ASCA studies. These precise XMM observations confirm that the entropy profiles of clusters are self-similar down to low mass (), but that the entropy temperature relation is shallower than in the purely gravitational model. This self-similarity of shape is a strong constraint, allowing us to rule out simple pre-heating models. The gas history thus probably depends not only on gravitational processes, but also on the interplay between cooling and various galaxy feedback mechanisms.
Key Words.:
Cosmology: observations, Cosmology: dark matter, X-rays: galaxies: clusters, galaxies: clusters: individual: A 1991, A 2717, MKW 9, Galaxies: clusters: Intergalactic medium1 Introduction
In galaxy clusters the hot, X-ray emitting gas of the intra-cluster medium (ICM) lies trapped in the potential well of the dominant dark matter component. If clusters were formed solely through gravitational processes, the properties of different haloes (e.g., X-ray luminosity, , the gas mass ) would scale with the mass (or the global X-ray temperature ) and redshift, , of the system, such that (e.g., Bryan & Norman bn (1998); Eke et al. eke (1998)). It has been known for some time that while such relations do exist in observed clusters, their actual scaling is subtly different from expected.
With the advent of XMM-Newton and Chandra, observations and numerical simulations are on an equal footing, and so we can test the modelling of the dark matter collapse and the consequent evolution of the ICM as never before. We are beginning to see some evidence that numerical simulations predict the correct shape for the dark matter distribution from up to not only in massive systems (e.g., Lewis, Buote & Stocke lewis (2003); Pratt & Arnaud pa02 (2002); Pointecouteau et al. pointeco (2004)), but also in low mass clusters (Pratt & Arnaud pa03 (2003)), and that the shape is independent of cluster temperature (e.g., Arnaud, Pratt & Pointecouteau app (2004)). Thus the underlying universality of the dark matter distribution, indicated indirectly by the similarity of gas emission measure and temperature profiles of relatively hot systems (Markevitch et al. mark98 (1998); Neumann & Arnaud na99 (1999); Vikhlinin, Forman & Jones vikh99 (1999); Irwin & Bregman ib00 (2000); De Grandi & Molendi demol02 (2002); Arnaud, Aghanim & Neumann aan02 (2002)) is starting to be confirmed.
At the same time, our knowledge of some aspects of the gas physics seems wanting, as the departures from the expected scaling relations attest. The current consensus is that there is some form of non-gravitational process which affects the gas and thus modifies the similarity. The non-gravitational processes have been historically divided into either pre-heating, where the gas has been heated before being accreted into the potential well, by early supernovae and/or AGN activity (e.g. Kaiser kaiser91 (1991); Evrard & Henry evrard91 (1991); Valageas & Silk valageas (1999)), internal heating after accretion (e.g. Metzler & Evrard me94 (1994)), and cooling (e.g. Pearce et al. pea00 (2000)). A great deal of theoretical effort, including the use of numerical simulations, has been put into determining how these processes affect the scaling properties of the ICM (e.g. see Borgani et al. borg04 (2004) for a review).
The preferred quantity in which to cast both observations and theory is the entropy, (see e.g., Bower bow97 (1997)). The entropy reflects the accretion history of the gas, but at the same time is likely to preserve the imprint of any other physical process. It has become traditional to define the ‘entropy’ as , which is related to the true thermodynamic entropy via a logarithm and an additive constant. Pioneering work on cluster entropy profiles can be found in David, Jones & Forman (djf (1996)).
In the self-similar framework described above, the entropy scales with the temperature simply as . Ponman, Cannon & Navarro (pcn99 (1999)) used ROSAT observations to suggest that the entropy measured at follows the standard self-similar scaling at high temperatures but tends towards a limiting value in the coolest systems. This sparked an avalanche of work on non-gravitational heating (but see also Bryan bry00 (2000); Davé et al. dav02 (2002)), with a particular focus on the pre-heating scenario (e.g. Fujita & Takahara fuj00 (2000); Bialek et al. bia01 (2001); Tozzi & Norman tn01 (2001); Babul et al. bab02 (2002); Borgani et al. borg02 (2002)); but no definitive picture emerged concerning the level, actual timescale, or astrophysical source of the extra energy injection (Wu, Fabian & Nulsen wfn98 (1998); Loewenstein loe00 (2000); Kravtsov & Yepes kra00 (2000); Bower et al. bow01 (2001); Brighenti & Mathews bri01 (2001); Yamada & Fujita yam01 (2001); Nath & Roychowdhury nat02 (2002)). However, more recent work has shown that there is no limiting value to the entropy, and that in fact it scales as (Ponman, Sanderson & Finoguenov psf03 (2003)). At the same time, better spatially resolved XMM-Newton and Chandra observations have shown that the simple prescriptions for gas pre-heating, intended to match the limiting value on the entropy, were predicting large isentropic cores in groups when in fact there are none (Pratt & Arnaud pa03 (2003); Sun et al. sun (2003); Rasmussen & Ponman rp (2004); Khosroshahi, Jones & Ponman khos (2004)).
| Cluster | z | Rev. | Modea | |||
|---|---|---|---|---|---|---|
| MOS1 | MOS2 | pn | ||||
| A1991 | 0.0586 | 584 | FF | 28975 | 28878 | 19348 |
| A2717 | 0.0498 | 558 | FF | 51682 | 51647 | 44284 |
| MKW9 | 0.0382 | 311 | EFF | 29890 | 29716 | 20720 |
Notes: a EPN observation mode: FF = Full Frame, EFF = Extended Full Frame; b Exposure time after flare cleaning
The focus has now started to shift from simple pre-heating to more advanced models which reflect the energy balance between heating and cooling, and the effect of heating on the accretion of the gas (e.g. Menci & Cavaliere men00 (2000); Muawong et al. mua02 (2002); Finoguenov et al. fin03 (2001); Xue & Wu xw03 (2003); Valdarnini vald03 (2003); Kay, Thomas & Theuns kay03 (2003); Voit et al. voit02 (2002), voit03 (2003); Voit & Ponman vp03 (2003); Kay kay04 (2004); Borgani et al. borg04 (2004)). These models have need of stringent constraints from observations, which XMM-Newton and Chandra are starting to provide.
As shown by Voit et al. (voit02 (2002), voit03 (2003)), the two fundamental quantities which define the X-ray properties of a relaxed cluster are the entropy profile of the gas and the shape of the potential well in which it lies. and reflect respectively the physics of the gravitational collapse and thermodynamic history of the gas. Low mass clusters are particularly interesting targets for the study of the entropy because in these systems gravitational and non-gravitational processes affect the ICM in roughly equal proportions. In this paper, we present the results from high quality XMM-Newton observations of three cool clusters, A1991, A2717 and MKW9, focussing on the gas density and temperature profiles (Sect. 3 and Sect. 4)111We will discuss the abundance distributions in a companion paper (Pratt & Arnaud, in prep).. We derive the radial distributions of these quantities with good precision between and of the virial radius (), enabling us to calculate the total mass profiles (Sect. 5) and entropy profiles (Sect. 6) out to the same distance with unprecedented accuracy. To investigate the scaling and structural properties of cluster mass and entropy profiles, we combine these data with previously published results for the cooler group A1983 and the hot cluster A1413. We will see that the dispersion in the scaled mass and entropy profiles is remarkably small. We discuss the implications for our understanding of the dark matter collapse and the gas specific physics in Sect. 7.
Except where otherwise noted, the following cosmology is used throughout: km s-1 Mpc-1, and , which is denoted CDMH70. Where we want to examine the dependence of scaling on cosmology, we will also use the SCDMH50 cosmology: km s-1 Mpc-1, and .
2 Observations and data reduction
We show the observation details in Table 1. For the following analysis we use PATTERNs 1-12 from EMOS event lists, and PATTERN 0 from the EPN event list. Each observation was cleaned for soft proton flares according to the method described in Pratt & Arnaud (pa02 (2002)), using an initial pass in 100s bins in a high-energy band (10.-12. keV for EMOS; 12.-14. keV for EPN), with a second pass in 10s bins in a broad band (0.3-10. keV). To correct for vignetting, the photon-weighting method of Arnaud et al. (arnaudetal01a (2001)), as implemented in the SAS task evigweight, was applied to each event file.
We use the dedicated blank-sky event lists accumulated by Read & Ponman (read (2003)) as background files, applying the same PATTERN selection, flare rejection criteria and vignetting correction as described above. Background subtraction of output products was undertaken as described in Arnaud et al. (aml02 (2002)).
3 Gas density distributions
3.1 Morphologies
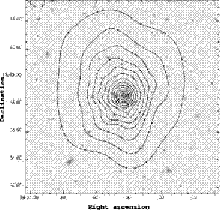
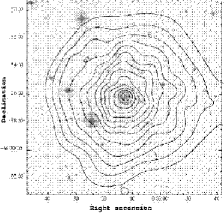
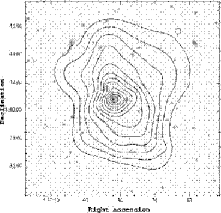
The X-ray morphology can give interesting qualitative (and quantitative, see e.g., Buote & Tsai bt96 (1996)) insights into the dynamical status of a given cluster. The positions of bright serendipitous point sources were obtained from the combined EPIC source list in the pipeline products. We then used the CIAO utility dmfilth to excise these sources from the images and refill the holes with Poisson noise, and then we used csmooth to adaptively smooth the images. In Figure 1, we show an XMM/DSS overlay of each cluster, where the contours come from the adaptively smoothed [0.3-0.9] keV EMOS+EPN image.
A1991 and A2717 exhibit symmetric X-ray isophotes, suggesting that they are relatively relaxed. The X-ray emission of A2717 is centred on its central D galaxy [PL95] ACO 2717 BCG, the Brightest Cluster Galaxy as defined by Postman & Laurer (PL (1995)), which has coordinates , . Note that the SIMBAD coordinates for this cluster are currently offset by . The X-ray emission of A1991 is slightly offset from the optical position of the central D galaxy [WCB96] ACO 1991 A (aka NGC 5778)222In fact, the raw image seems to show a surface brightness edge from the X-ray centroid. These XMM-Newton data do not have sufficient spatial resolution to resolve the feature, but the Chandra observation (Sharma et al. sharma (2004)) does show substructures at that scale., coordinates , .
The X-ray emission is of MKW9 is centred on the central galaxy UGC 9886, coordinates , , but in contrast to the other clusters, the X-ray morphology is not symmetric at all. This is especially evident at large scale, where the isophotes have a pronounced ellipticity in the NE-SW direction. At small scale the isophotes are preferentially orientated in the E-W direction.
3.2 Surface brightness profiles
In poor clusters, the emissivity of the hot gas, , depends sensitively on the abundance and temperature. As will be seen below, radial gradients in these quantities exist in all three clusters, and so in deriving gas density profiles from the surface brightness distribution, such variations should be taken into account.
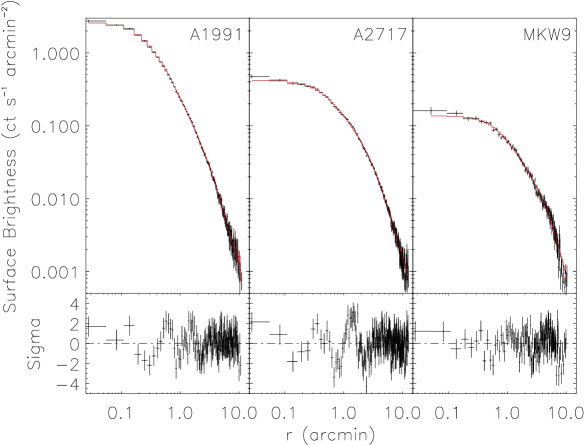
For each cluster, after masking of point sources, the surface brightness profile was extracted from each event list in the [0.3 - 3.0] keV band, with the [0.9-1.2] keV band excluded333This minimises the contribution from the FeL blend, the feature which is the most sensitive to abundance and temperature variations.. Events were binned directly from the event lists in circular annuli centred at the X-ray emission peak. Background subtraction was undertaken separately for each camera; the resulting EMOS and EPN data were coadded and then the total profile binned such that a ratio of at least was reached.
The surface brightness profile was then corrected for emissivity variations as follows. The temperature and abundance values were interpolated to each radius in the surface brightness profile by fitting the temperature and abundance profiles with functional forms (respectively: an empirical function described in Eq. 2, and a lognorm function). The emissivity at each radius, , was then estimated using an absorbed, redshifted MEKAL model convolved with the instrument response. The surface brightness profile was then divided by normalised to its value at large radii.
| Parameter | A1991 | A2717 | MKW9 |
| /d.o.f | 197.0/160 | 339.3/206 | 181.3/133 |
3.3 Gas density profile modelling
The corrected surface brightness profile of each cluster (shown in Fig. 2) is directly proportional to the emission measure profile, , and can thus be fitted with various parametric models for the gas density profile, . These models were convolved with the XMM-Newton PSF (Ghizzardiet al. ghizzardi01 (2001), ghizzardi02 (2002)) and binned into the same bins as the profile under consideration.
In none of these clusters did we find that a standard -model was a good description of the entire profile. In all cases the fit improves and the reduced converges to 1.0 as the central regions are progressively excluded, which indicates that the outer regions are in fact well described with this model. We thus fitted the surface brightness profiles with the double isothermal -model described in Pratt & Arnaud (pa02 (2002), their BB model). The fit results are shown in Table 2. Note that the profile obtained beyond in the BB model is the classic -model, and that in all cases the external value is consistent with the mean value for hotter clusters (Neumann & Arnaud na99 (1999)).
4 Temperature distributions
4.1 Hardness ratio images
The hardness ratio (HR) of a source is an indirect measure of its temperature, and taking advantage of the large bandpass of XMM-Newton, we can use the information contained in images in different energy bands to get a good idea of the projected temperature structure of a given cluster. The method we use follows closely that described in Pratt & Arnaud (pa03 (2003)), except that here we take advantage of the CIAO utility dmfilth to excise and refill with Poisson noise the most obvious point sources, and then we use csmooth to adaptively smooth the images.
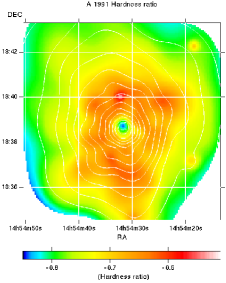
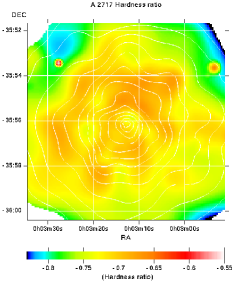
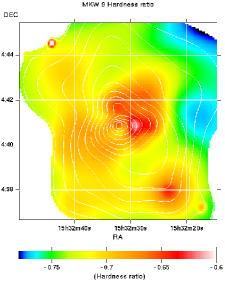
Source and background images were extracted in the [0.3-0.9] keV and [2.5-5.0] keV bands, chosen to avoid complications caused by the coupling of temperature and abundance at low temperatures due to strong line emission. This is especially important in these low temperature clusters. We used the total EMOS+EPN [2.5-5.0] keV image to define a smoothing template, and subsequently applied this template to each source, background and exposure map image in turn. We tried various scales and found that a minimum smoothing scale of and a maximum smoothing scale of was a good compromise between under- and over-smoothing. The backgrounds were normalised based on the effective exposure times and subtracted from each image, then the images were divided by their exposure maps. The hardness ratio image of each cluster was then calculated using HR = (image [2.5-5.0] - image [0.3-0.9])/(image [2.5-5.0] + image [0.3-0.9]).
We have not corrected for the difference between the local cluster backgrounds and the blank-sky background at low energies, because the effect — being energy-dependent — is rather difficult to correct for. This means in particular that i) the absolute HR values shown in Fig. 3 cannot reliably be converted into temperatures, and ii) the decline in HR towards the outer regions is an artifact. The latter point is explicitly confirmed in Sect. 4.2 below. Despite these caveats, the HR images give an excellent idea of the temperature structure, which is the most interesting quantity for investigating the dynamical state of a given cluster. The HR images of A1991 and A2717 appear relatively symmetric, with a clear temperature drop in the centre of A1991. On the other hand, the HR image of MKW9 shows sub-structure, suggesting, as does the raw image, that it may not be fully relaxed. This is further discussed in Sect. 7.1.
4.2 Radial temperature profiles
4.2.1 Annular spectral analysis
Spectra were extracted in circular annuli centred on the X-ray emission peak of each cluster. We optimised the annuli by imposing a detection, after background subtraction, in the [2.0 - 5.0] keV band; this was possible for all but the most external annuli, the temperature determinations of which should be treated with caution. Regardless of the detection significance, we additionally set a lower annulus width of , to minimise PSF effects (i.e.,the annular widths were greater than or equal to the diameter enclosing per cent of the energy for the on-axis PSF).
The EMOS and EPN spectra of each cluster were fitted with an absorbed MEKAL model. The absorption was fixed at the galactic value in the direction of each cluster444If the absorption is left as a free parameter, the absorption values for A2717 and MKW9 compare favourably with those measured in the HI survey by Dickey & Lockman (dl90 (1990)), but that for A1991 is significantly higher. However, since leaving the absorption free has no discernable effect on the measured temperatures and abundances of any of these clusters, we have chosen to fix the to the galactic value., as measured in the HI survey by Dickey & Lockman (dl90 (1990)). The free parameters of each fit are thus the temperatures and abundances (measured relative to Anders & Grevesse agr (1989)); the EMOS and EPN spectra were fitted simultaneously with the temperature and abundance linked. The EPN normalisation was not linked to that of the EMOS cameras (it is typically slightly lower).
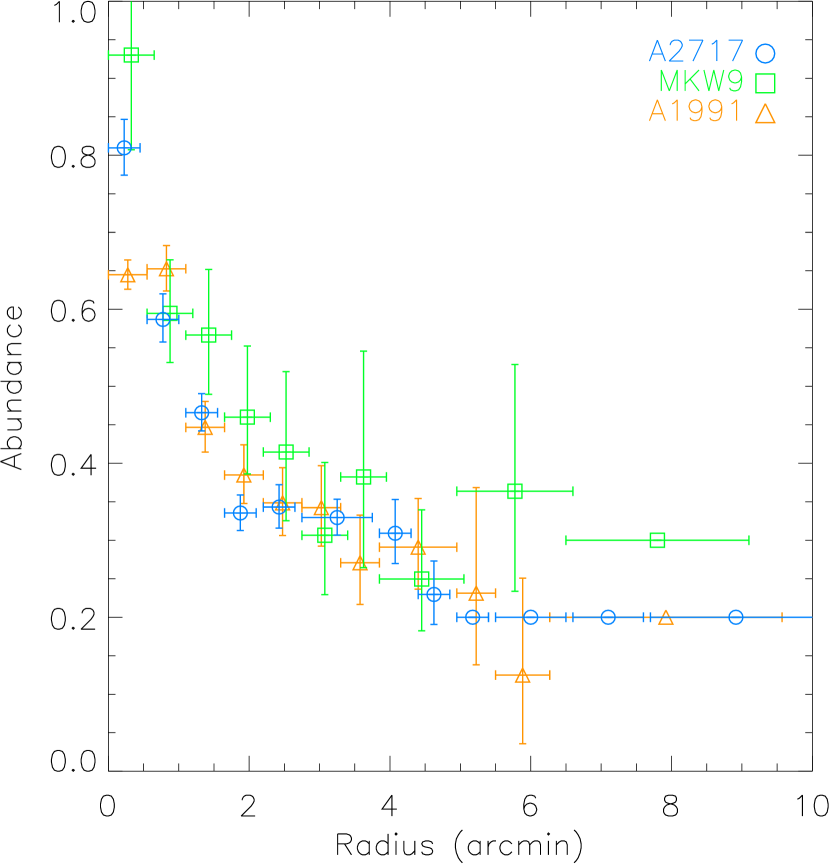
We show the resulting projected abundance profiles in Fig. 4 (the temperature profiles are discussed further below). There is strong line emission from several elements at the average temperature of these clusters, which will be investigated in further detail in a future paper.
4.2.2 Correction for Projection and PSF effects
The projected temperature profiles show evidence for central cool regions of varying strength in all the clusters, the most striking example of which is A1991. It is clear that both PSF and projection effects may play a role, and will need to be taken into account if we want to recover the best estimate of the mass profile. For the following analysis we use the method of Pointecouteau et al. (pointeco (2004)), where the observed annular spectra, , are modelled with a linear combination of absorbed isothermal MEKAL models:
| (1) |
For pure PSF correction, the redistribution coefficient is the emission measure contribution of ring to ring , where the coefficients were calculated using the emission measure profile from the best-fitting gas density profile model, convolved with the XMM-Newton PSF at 1 keV. The redistribution coefficients for pure projection effects are calculated as the emission measure contribution of the shell to the ring . PSF and projection effects are taken into account using the emission measure contribution of the shell to the ring after convolution with the PSF.
For each cluster the annular spectra were fitted simultaneously in XSPEC. We fixed the absorption to the galactic value, and we froze the abundance of each MEKAL model to the best-fit value found for each projected annulus. For annuli, the free parameters are thus the temperatures and normalisations, one per annulus, the other normalisations being linked according to Eq. 1. Further details of the fitting procedure can be found in Pratt & Arnaud (pa02 (2002)) and Pointecouteau et al. (pointeco (2004)).
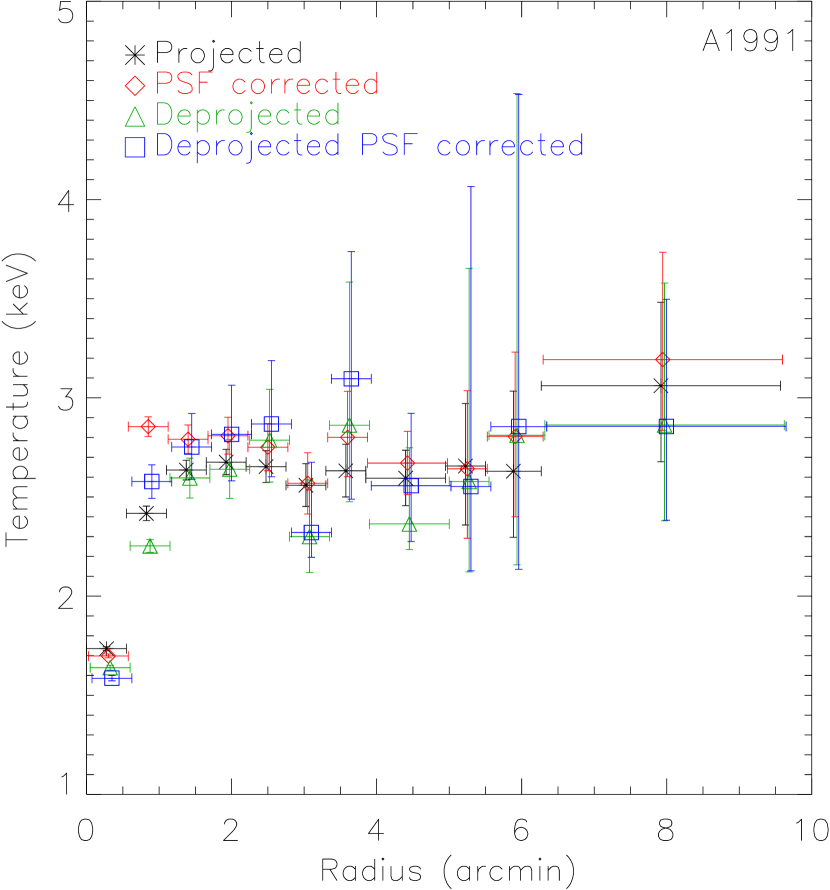
Figure 5 illustrates the separate effects of PSF blurring and projection on the the temperature profile of A1991 (results for A2717 and MKW9 are similar). There is a definite effect in the central regions. While in both cases the temperature of the central bin is decreased, the PSF correction and deprojection have an opposite effect on the second bin. Beyond the third annulus () the corrected profiles are consistent with the projected profile. This is expected, the external profile being very flat. However, we can see that the correction process amplifies considerably the slightest variation in the profile and the corrected profile is noisier.
The noise increase is particularly marked for the deprojected, PSF corrected profile, where the largest deviations correspond to projected annuli which have slightly lower or higher temperatures than the best fit smooth profile. Similar behaviour was also seen in A2717, MKW9 and in the analysis of A478 by Pointecouteau et al. (pointeco (2004)). These deviations are very likely an artifact of the correction process, and as such should not be considered as physically meaningful. In the central regions, the deprojected, PSF corrected temperatures are subtly different from the projected values.
Since for all the clusters the outer regions of the deprojected, PSF corrected temperature profiles are i) subject to unphysical jumps which would lead to mass discontinuities, but ii) consistent with the projected profile, for the following analysis we use a composite temperature profile made up of the inner three annuli of the deprojected, PSF corrected profile, plus the projected temperature values thereafter. These composite profiles are shown in Fig. 6.

4.2.3 Temperature profile modelling
4.3 Virial temperature
| Cluster | ||
|---|---|---|
| (keV) | () | |
| A1991 | ||
| A2717 | ||
| MKW9 |
To compare the properties of these cool clusters with those of hotter systems (e.g. Sect. 6) it is useful to define a global temperature, representative of the ‘virial’ temperature. Faced with the considerations i) that the measurements must be easily reproducible both for observers and simulators alike, ii) that in none of these observations are we able to detect emission much beyond and iii) that all clusters appear to have somewhat cooler gas in the core region, we extracted a spectrum for each cluster from all events between . The in each case comes from the best-fitting NFW mass model to the mass profiles, discussed in more detail in Sect. 5.2.
The EMOS and EPN spectra of each cluster were fitted simultaneously in the [0.3 - 6.0] keV band with an absorbed MEKAL model. Fits were identical to those described in Sect. 4.3. The results of this global analysis are given in Table 4.
The temperature of A1991 is in excellent agreement with the temperature keV, derived with Chandra beyond the cooling core (Sharma et al. sharma (2004)). The XMM temperature of A2717 is higher than the temperature keV derived by Liang et al. (liang (1997)). This value was found from an isothermal fit to the ROSAT data within , actually an emission weighted temperature including the cooling core emission, and is thus likely to be biased low (especially since ROSAT is particularly sensitive to any cool component). The global temperature for MKW9 is in good agreement with previous ASCA studies by e.g., Finoguenov et al. (fad01 (2001); keV) and Sanderson et al. (sand03 (2003); keV). It is also in agreement with the analysis of the same XMM-Newton observation by Kaastra et al. (kaa (2004)).
5 Mass profiles
5.1 Mass profile calculation
Combining the gas density (Sect. 3.3) and temperature (Sect. 4.2.2) profiles, we can derive a total gravitational mass profile under the assumptions of hydrostatic equilibrium and spherical symmetry. The mass was calculated at each radius of the temperature profile using the adapted version of the Monte Carlo method of Neumann & Böhringer (nb95 (1995)) described in Pratt & Arnaud (pa03 (2003)). This takes as input the parametric model for the gas density profile and the measured temperature profile with errors. A random temperature is calculated at each radius of the measured temperature profile, assuming a Gaussian distribution with sigma equal to the error, and a cublic spline interpolation is used to compute the derivative. Only profiles corresponding to a monotonically increasing mass gradient are kept: 1000 such profiles were calculated. The input temperature profile is the composite profile discussed in Sect. 4.2.2.
The uncertainty in the modelling of the gas density profile was taken into account by calculation of the errors on the density gradient at each point. The final uncertainties on each mass profile point are then the quadratic addition of these errors with the Monte Carlo errors.
5.2 Mass profile modelling
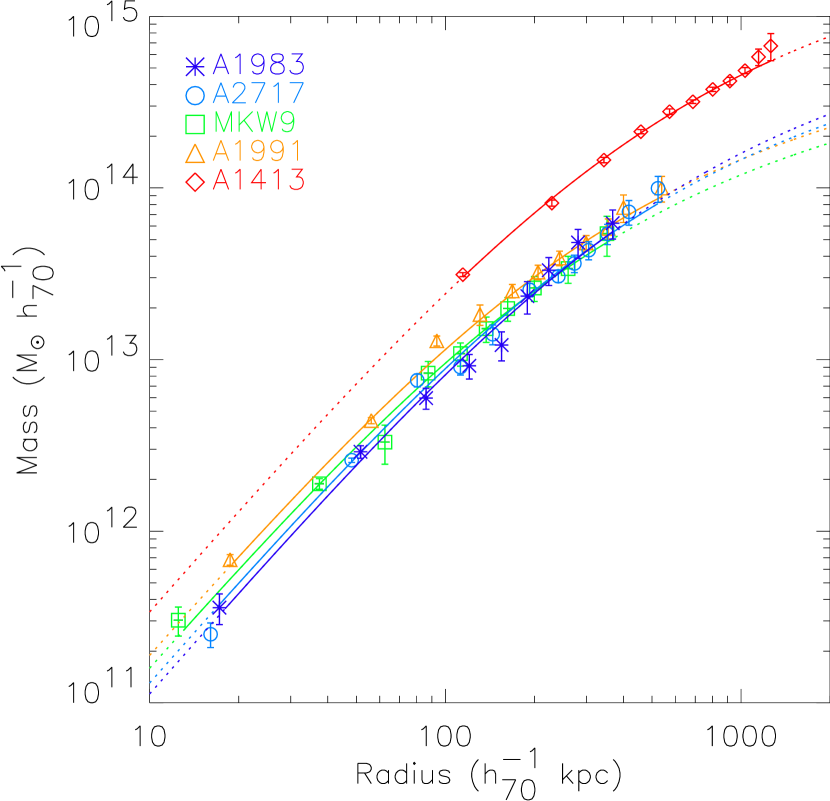
The integrated mass profile of each cluster was then fitted using the Navarro et al. (nfw97 (1997); hereafter NFW) density distribution . This model has two free parameters: a normalisation factor and the scaling radius , or equivalently the total mass and the concentration parameter (see e.g., Suto, Saski & Makino suto (1998) for details). is defined as the mass contained in a sphere of radius , which encompasses a mean density of 200 times the critical density at the cluster redshift , where . In numerical simulations, this sphere is found to correspond roughly to the virialised part of clusters. Results of these fits are shown in Table 5. Fig. 7 shows the cluster mass profiles plotted in physical units, overlaid with the best-fitting NFW models.
We also tried fitting these mass profiles with an isothermal sphere model and a Moore et al. (mqgsl99 (1999)) model: the former was not an acceptable fit to any of these clusters, while the latter was unconstrained.
| Parameter | A1991 | A2717 | MKW9 |
|---|---|---|---|
| CDMH70 | |||
| ( kpc) | |||
| ( kpc) | 1105 | 1096 | 1006 |
| () | 1.63 | 1.57 | 1.20 |
| 9.98/9 | 15.8/10 | 4.0/8 | |
| SCDMH50 | |||
| (kpc) | |||
| (kpc) | 1466 | 1466 | 1358 |
| () | 2.17 | 2.12 | 1.63 |
| 9.98/9 | 15.8/10 | 4.0/8 |
5.3 Cluster dynamical state and NFW fit
The NFW model is not a very good fit to the A2717 mass profile (the ). Jing (jing00 (2000)) has shown that non-equilibrium haloes produce poor fits to the NFW distribution, and also that the concentration parameters are generally lower in these cases. A2717 has the lowest and the worst-fitting NFW profile, and so this may well be due to the halo being unrelaxed. An optical substructure study by Girardi et al. (getal97 (1997)) has suggested that there is a significant structure in the central region, slightly foregrounded by km s-1, and so the core region may indeed be dynamically perturbed. However, we do not see any obvious structure either in the X-ray/optical overlay or in the hardness ratio map. Moreover, A1991 and MKW9 are well fitted with the NFW profile and have similar values, but while A1991 appears relaxed, MKW9 does not. The isophotal twisting from the centre to the outer regions (Fig. 1), and the considerable structure in the hardness ratio image (Fig. 3), together with the evidence for substructure from optical studies (Beers et al. beers (1995)), all suggest that MKW9 may not be fully relaxed.
| Cluster | Reference | ||
|---|---|---|---|
| A1991 | Girardi et al. (getal97 (1997)) | ||
| A2717 | Girardi et al. (getal97 (1997)) | ||
| MKW9 | Beers et al. (beers (1995)) |
We can use the tight correlation between and the velocity dispersion of the dark matter found in the Hubble Volume simulations (Evrard & Gioia eg (2002)), viz.,
| (3) |
to further probe the link, if any, between the NFW fits to these clusters and their dynamical state. The optically-derived galaxy velocity dispersion is a measure of the actual dark matter velocity dispersion, both collisionless components presumably following the same dynamics. In Table 6, we compare the values expected from the best-fitting NFW mass models to these clusters with the galaxy velocity dispersions. For unrelaxed clusters we would not expect good agreement because of i) incorrect estimates of the total cluster mass through the HE equation and/or ii) intrinsic departure from the – relation. We can see that not only are the results in excellent agreement555 In view of the large error bars on the optical velocity, the agreement unfortunately does not give stringent constraints on the dynamical sate of MKW9. , but that the agreement is particularly good for A2717. This gives us confidence in the total mass estimates derived from the NFW fits to these X-ray derived mass profiles, and suggests that none of these clusters can be too far from equilibrium.
That being said, it is highly ulikely that the three clusters are in exactly the same state of relaxation. Judging by the X-ray and optical information, MKW9 is probably the least relaxed. In this sample, though, there is no obvious link between the dynamical state and the goodness of the NFW fit or the value derived for the concentration parameter.
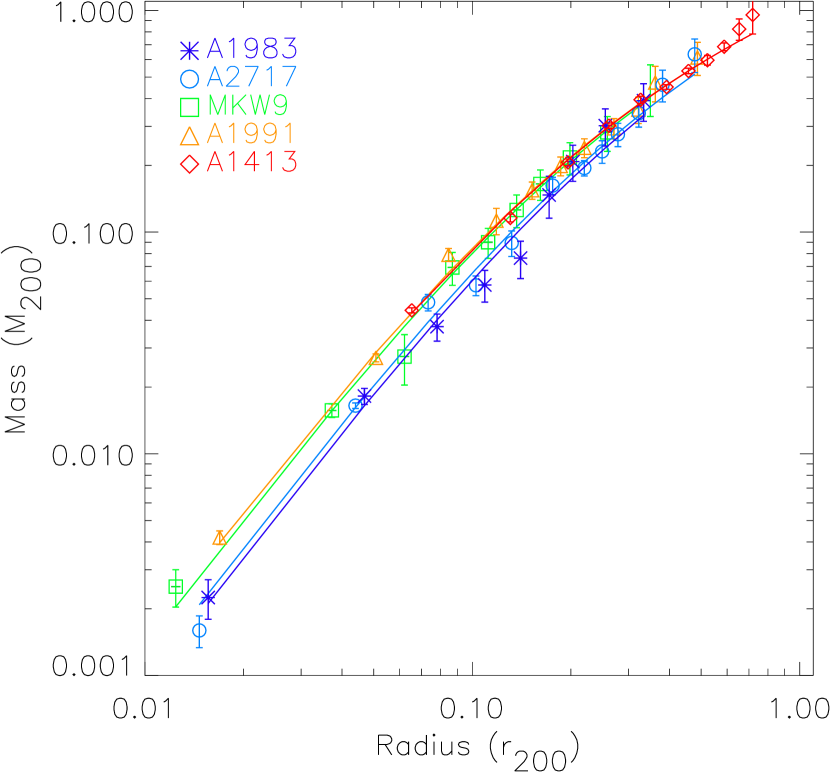
5.4 Scaled mass profiles
We now turn our attention to the scaled mass profiles of these systems, where we scale the radius by and the mass by , these values coming from the best fitting NFW model to each cluster. Comparison of these scaled profiles allows us to assess similarity in the shape of the mass profiles. To increase the sample and allow a first comparison with massive clusters, we also add data from our previously published work on the slightly cooler cluster A1983 (Pratt & Arnaud pa03 (2003)) and the hot, massive cluster A1413 (Pratt & Arnaud pa02 (2002)). The mean temperature in the radial range is keV and keV for A1983 and A1413, respectively. The mass profiles of these two clusters666The published data are scaled to the CDMH70 cosmology. are plotted in physical units in Fig. 7. The scaled mass profiles of all five clusters (CDMH70) are shown overlaid with the best fit scaled NFW models in Figure 8.
| Radius | CDMH70 | SCDMH50 | ||
|---|---|---|---|---|
| Scaled mass: NFW best fit model | ||||
| Scaled mass: interpolated data | ||||
It is clear from Fig. 7 that the mass profiles of A1991, A2717 and MKW9 are genuinely similar even in physical units. When we add the data from A1983 and A1413 and scale the profiles, the resemblance is remarkable. To further quantify this similarity, we have estimated the relative dispersion in the scaled mass profiles at 0.05, 0.1, 0.3 and . The scaled masses at these radii were estimated using either i) the best-fitting NFW mass model or ii) a linear inter/extrapolation of the measured in the – plane. In the case of A1983 and MKW9, there is a small amount of extrapolation needed to reach . We used both the standard deviation and mean and the biweight estimators for location and scale ( and ), described in Beers et al. (beers1 (1990)), to estimate the relative dispersion. The resulting values are shown in Table 7. The scaled mass profiles depend on the cosmological model through the function , used in the definition of and , and via the angular distance used to convert the angular radius to physical units. The cool systems are all at roughly the same redshift but A1413 is at a somewhat higher redshift of . We thus also give the dispersions obtained for the SCDMH50 cosmology in Table 7.
As can been seen from Table 7, for the present sample, the dispersions are neither sensitive to the cosmology nor to the choice of the statistical estimator. The best fitting scaled NFW profile of each cluster depends only on the concentration parameter. By definition of the scaling the dispersion is null at , and naturally increases with decreasing scaled radius. The observed dispersion is small, less than per cent for , reflecting the modest dispersion in the concentration parameter values (further discussed in Sect. 7.1). Turning now to the interpolated data, the dispersion is generally higher (e.g. per cent at ) and its variation with radius is more chaotic. This is expected, since in that case statistical errors on the data contribute to the dispersion. The dispersion obtained using the best fitting NFW models is probably more representative of the intrinsic dispersion in the mass profiles. A more rigorous estimate of this intrinsic dispersion would require a much larger cluster sample and is beyond the scope of this paper.
6 Entropy
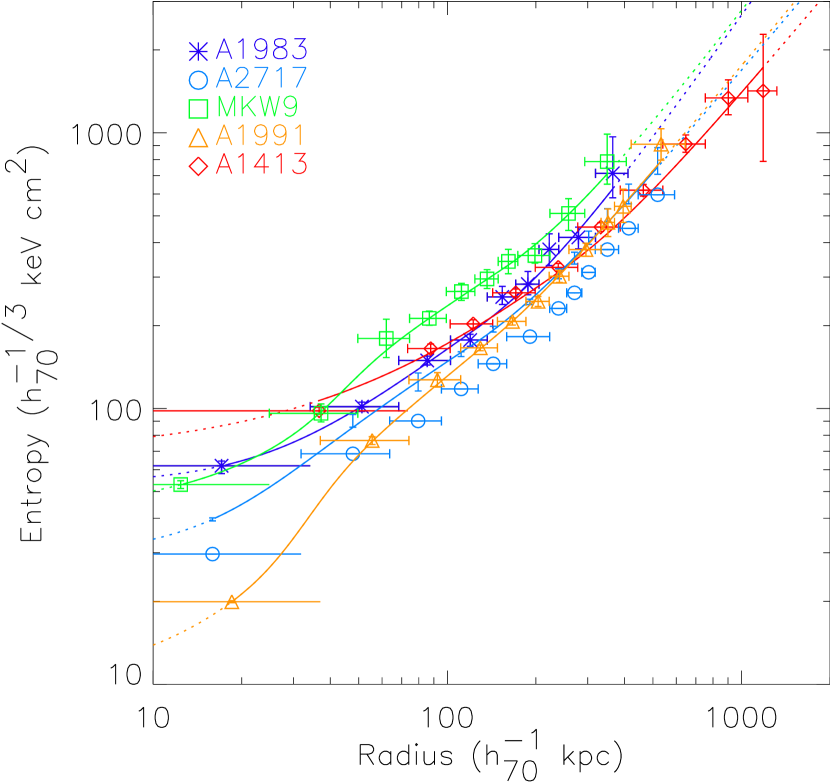
6.1 Entropy profiles
We next determined the gas entropy () profiles for the clusters, using the analytic description for the gas density profile and the observed temperature profile corrected for PSF and projection effects (Sect. 4.2.2). The resulting profiles, together with the profiles of A1983 and A1413 (Pratt & Arnaud pa03 (2003)), are shown plotted in physical units in Fig. 9. The profiles are shown with typical errors corresponding to the error on each temperature bin. We also calculated the entropy using the analytical temperature profile model (Eq. 2). These profiles are also plotted in the Figure.
| Radius | CDMH70 | SCDMH50 | ||
|---|---|---|---|---|
| Scaled Entropy: scaling | ||||
| 0.30 | 0.28 | 0.28 | 0.26 | |
| 0.30 | 0.29 | 0.29 | 0.28 | |
| 0.30 | 0.29 | 0.28 | 0.26 | |
| 0.34 | 0.33 | 0.31 | 0.31 | |
| Scaled Entropy: scaling | ||||
| 0.22 | 0.22 | 0.21 | 0.20 | |
| 0.22 | 0.24 | 0.21 | 0.21 | |
| 0.20 | 0.26 | 0.18 | 0.20 | |
| 0.24 | 0.29 | 0.21 | 0.19 | |
6.2 Scaled entropy profiles
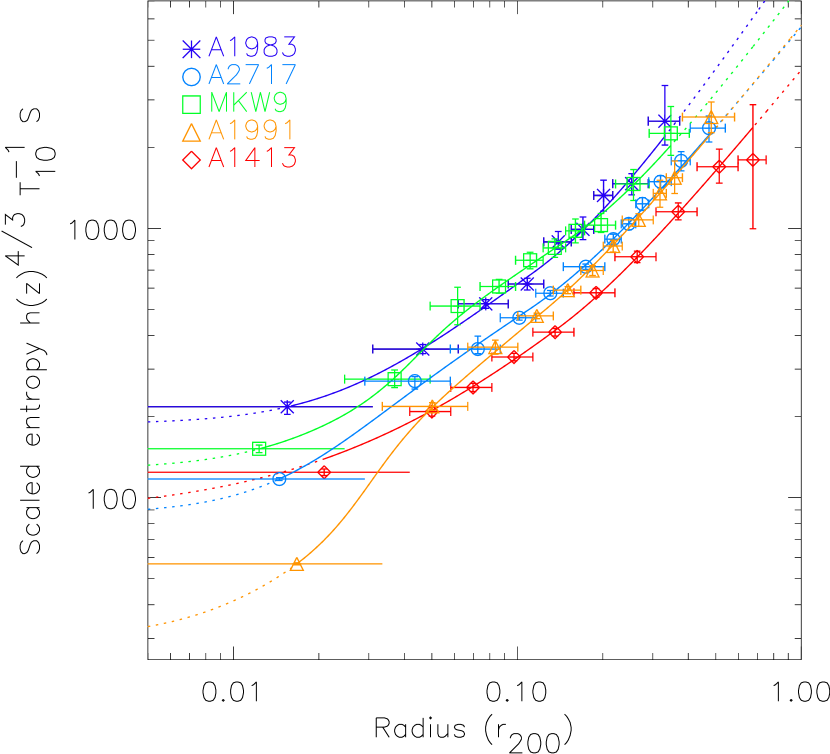
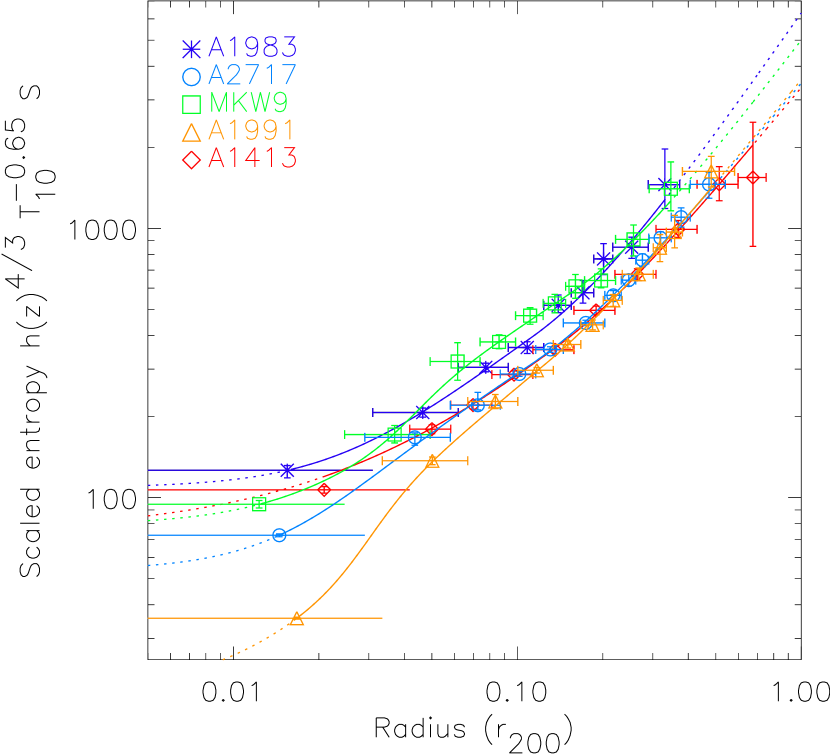
In the standard self-similar scenario, clusters form at constant density contrast and the gas simply follows the dark matter. The mean gas and DM density are proportional to the critical density of the Universe: . The entropy thus scales as , and the scaled entropy profiles ( versus ) of all clusters should coincide. We show the entropy profiles with this scaling in Fig. 10, where is the global temperature estimated as described in Sect. 4.3 in units of (hereafter ). Recent results (Ponman et al. psf03 (2003)) suggest that entropy scales with temperature such that . The entropy profiles with this scaling are shown in Fig. 11.
As with the mass profiles, we have inter/extrapolated the entropy profiles to 0.05, 0.1, 0.3 and using the best-fitting (analytical) gas density and temperature models for each cluster. The dispersion in the scaled profiles was once again calculated for the two cosmologies using both the standard and biweight estimators. The results are shown in Table 8. If the standard scaling is used the dispersion is about per cent, and is insensitive to the choice of the cosmology or statistical estimator. There is less scatter in the scaled entropy profiles if one uses the empirically-determined scaling of Ponman et al. (psf03 (2003)), . This is obvious if one compares Fig. 10 and Fig. 11. The improvement is quantified in Table 8: the typical dispersion is per cent, a drop of per cent from that of the standard scaling (the drop is somewhat smaller for the biweight estimator).
The dispersion is remarkably constant with radius (a variation of less than per cent), indicating strong similarity in the shape of the entropy profile. This is also clear from Fig. 11: while there is some variation of form in the inner regions, beyond about , the profiles all become approximately parallel. This suggests that the form of keV cluster entropy profiles is not temperature dependent. The shape, which is essentially governed by the shape of the density profile, is not exactly a powerlaw: it flattens slightly with decreasing radius following the double –model. However, within the radial range the mean scaled profile is well approximated by a powerlaw:
| (4) |
where the error on the slope is derived taking into account the dispersion around the mean profile. The slope is close to, but slightly shallower than, the behaviour expected from analytical modelling of shock heating in spherical collapse (Tozzi & Norman tn01 (2001)), behaviour which is also seen in cosmological simulations (e.g., Borgani et al. borg02 (2002)). This is further discussed in Sec. 7.2.
The fact that Figures 9 (unscaled profiles) and 11 (profiles scaled with the relation and the virial radius) show similar scatter is the result of a close coincidence in logarithmic slopes. For (corresponding to ; e.g, Finoguenov et al frb (2001)), and , the – curves are translated along a line of slope , which is similar to observed radial variation of . The scaled profile of A1413 (the hottest cluster) is translated a small bit lower than those of the cool clusters (since ). The effect of scaling with redshift then compensates a small amount for this.
7 Discussion
7.1 The gravitational collapse of the dark matter
The observed shape of the mass profile is an important test of our understanding of the dark matter collapse. Although the exact slope of the profile in the very centre of clusters is still a matter of debate, all numerical simulations of structure formation predict a universal form with a central cusp (e.g. Navarro et al. nfw04 (2004), and references therein).
The NFW profile provides the best fit to the three low mass clusters studied here, and a King profile (i.e. a profile with a core) is rejected. These three poor clusters thus display the cusped distribution expected from numerical simulations of CDM collapse, in common with A1983 (Pratt & Arnaud pa03 (2003)) and with hotter clusters observed with XMM-Newton or Chandra (e.g., David et al. david01 (2001); Allen et al. asf01 (2001); Arabadjis et al. abg02 (2002), Pratt & Arnaud pa02 (2002); Lewis et al. lewis (2003); Pointecouteau et al. pointeco (2004); Buote & Lewis bl04 (2004)). The profiles we have derived are not precise enough for us to constain the exact slope in the centre, although we note that the few observations (of massive clusters ) precise enough to constrain this slope favour an NFW type-profile (Lewis et al. lewis (2003); Pointecouteau et al. pointeco (2004); Buote & Lewis bl04 (2004)).
There is a remarkable similarity between the mass profiles of the cool systems and that of the hot cluster A1413. The dispersion in the scaled profiles is less than per cent in the radial range , where the various profiles could be compared without excessive extrapolation. In other words, the shape of the mass profiles from low mass systems up to high mass systems is very close to Universal. We now address the question of whether this shape, which is defined by the concentration parameter, is quantitatively consistent with the predictions.
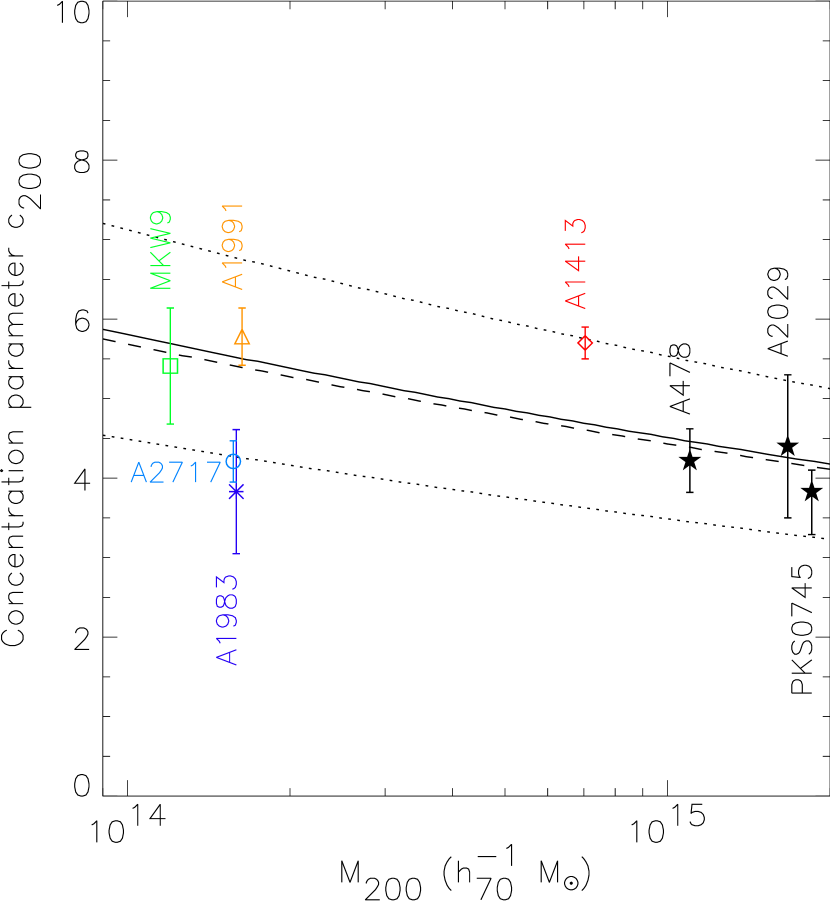
Theoretical modeling does not strictly predict a universal profile. Lower mass systems should have, on average, higher concentration parameters (e.g., Navarro et al. nfw97 (1997); Bullock et al. bull01 (2001)), a consequence of their having formed earlier. There also appears to be a wide dispersion in the value of in simulated haloes of a given mass, probably linked to scatter in their formation epoch (e.g. Wechsler et al. wec02 (2002)). To further test the theory of the gravitational collapse, we now compare the observed concentration parameters with the theoretical relation, , taking into account the typical dispersion around it.
Fig. 12 shows the concentration parameter of the 5 clusters under consideration plotted versus . We have also added values from the literature for local clusters () with measured to a precision of better than per cent. The references used are given in the caption of the figure. This sample, although still of modest size, spans a wide range of cluster mass: from to .
Some care is required in comparing to results from numerical simulations. The concentration parameter is commonly defined as the ratio of the ‘virial’ radius to the scaling radius of the NFW model: , and the mass as the ‘virial’ mass within . However different conventions for are used in the literature: i) where is the radius enclosing 200 times the critical universe density (Navarro et al. nfw97 (1997)); ii) , the radius enclosing times the critical density, where is derived from the spherical collapse model (Eke et al. eke01 (2001); Bullock et al. bull01 (2001) ; Wechsler et al. wec02 (2002); Zhao et al. zha03 (2003)); iii) the radius enclosing 200 times the mean universe density (Dolag et al. dol04 (2004)).
These different conventions lead to different concentrations and masses for a CDM Universe since (see Huffenberger & Seljak hs03 (2003)). When the various results are translated to a common virial radius convention, there is good agreement on the relation (see e.g. Zhao et al. zha03 (2003) and Dolag et al. dol04 (2004)). We thus only consider the recent work of Dolag et al. (dol04 (2004)), who found that the mean concentration is well fitted by a power law function of the mass, with (CDm cosmology, ). Note that these authors used the convention while we use . We thus converted (using the NFW profile) their and values to and values. At we found and in the mass range considered here. The corresponding relation is plotted as a full line in Fig. 12. Dolag et al. (dol04 (2004)) also studied the scatter at a given mass: the concentration follows a log-normal distribution with a dispersion of , in good agreement with previous studies (Eke et al. eke01 (2001); Bullock et al. bull01 (2001)). The curves corresponding to the mean plus/minus the standard deviation are plotted as dotted lines in Fig. 12. The concentration depends on redshift, so we have also plotted the relation at , the highest redshift for our sample (dashed line). The evolution effect is negligible as compared to the dispersion.
It is clear from Fig. 12 that there is an excellent agreement between the observed concentration parameters and the theoretical predictions. Taking into account the measurement errors and expected intrinsic scatter, there is no obvious deviation from the theoretical curve777In our published work on A1983 (Pratt & Arnaud pa03 (2003)) we mentioned that the concentration parameter is lower than expected for a cluster of this mass. This is not strictly true, as we in fact compared our value with the value of Eke et al. (eke01 (2001)) for a CDM cosmology, and did not take into account the expected theoretical dispersion.. However, the present data set does not allow us to check the expected increase of concentration parameter with decreasing mass. The mass dependence is small in the mass range under consideration, being of the order of the typical dispersion (see Fig. 12). We could only test the expected dependence with a much larger sample (preferably with individual values measured to a precision smaller than the scatter).
7.2 The gas specific physics
7.2.1 A universal entropy profile?
The present study confirms the remarkable self-similarity in the shape of the entropy profiles down to low mass (), suggested by the study of Ponman et al. (psf03 (2003)) and our previous XMM-Newton test-case comparison of the cool cluster A1983 and the massive cluster A1413 (Pratt & Arnaud pa03 (2003)). Note that the accuracy of the entropy profiles, which are well resolved from up to , has allowed us to perform a direct check of the self-similarity. In contrast, the ROSAT/ASCA study of Ponman et al. (psf03 (2003)) had to rely both on extrapolations beyond the detection radius (particularly at low mass) and stacking analysis. These XMM-Newton data have also allowed us to quantify the shape of the entropy profile, which is found to be only slightly shallower than expected in the pure shock heating model.
Our study also confirms that the – scaling relation is shallower than predicted by the purely gravitational model. The dispersion in the scaled profiles is decreased when we use the empirical relation , estimated by Ponman et al. (psf03 (2003)) at . We note that the normalisation of this relation is consistent between the ROSAT/ASCA sample and the present XMM-Newton analysis. Ponman et al. (psf03 (2003)) obtained (their Figure 4). The normalisation is only per cent higher than the value, we derive from the mean scaled entropy at that radius (; see Eq. 4). This is well within the typical dispersion. Note that the self-similarity of form found here implies that the slope of the – relation (also studied by Ponman et al. (psf03 (2003)) at ) should not depend on scaled radius, at least up to (the maximum radius considered here). Its normalisation of course does: from Eq. 4, the normalisation at is .
An alternative scaling based on preheating models was proposed by Dos Santos & Doré (dd (2002)), in which the entropy should scale according to , with . Our present sample does not allow us to distinguish between this scaling and that of Ponman et al. (psf03 (2003)). In fact, the difference between scaling by and scaling by is only per cent in the 2 to 10 keV domain, which explains why Ponman et al. (psf03 (2003)) found good agreement when their entropy profiles were scaled by the latter factor (their Fig. 2). We further note that the Dos Santos & Doré scaling is based on a preheating model where the factor was fixed to recover the limiting entropy value proposed by Lloyd-Davies et al. (lpc (2000)). We now know that such models are inconsistent with both the observed power law – behaviour and the lack of constant entropy cores in cool systems.
Our sample is still of modest size, and the dispersion analysis on the scaled entropy profiles should not be overinterpreted. It is a first attempt to quantify the degree of self-similarity, as such better than a simple comparison of the profiles by eye. While the analysis has begun strongly to suggest self-similarity at low mass, our conclusion on the self-similarity between poor and hot clusters still relies on the assumption that A1413 is a fair representative of massive clusters. The dispersion study does show that the scaling is better than the standard scaling, but does not allow us to gain any further constraints on the exact slope of the – relation (our present sample being too small, particularly with only one cluster at high temperature). We recall that Ponman et al. (psf03 (2003)) give a slope of .
We feel it should also be pointed out that the degree of similarity emphasised here does not imply a strict scaling of all the gas properties.
Firstly, there is large dispersion in the central region, , roughly corresponding to the cooling core region. For instance the entropy of A1991 and A1983 at differ by an order of magnitude. These huge differences, also observed in Chandra data by Sun et al. (sun04 (2004)), are likely to reflect the large variety of cooling core histories, such as would be expected from the complex interplay between cooling and central AGN activity.
Secondly, relatively modest differences in entropy translate into much larger differences in other quantities, such as the X–ray luminosity. This is because the luminosity is much more sensitive to the gas density than the entropy: while , so that for clusters of the same temperature and internal structure. This has important consequences for sources of the scatter in the – relation, even after the exclusion of the cooling core region. To further illustrate this point, we can compare in greater detail the 3 poor clusters A1991, A1983 and MKW9, which have practically identical temperatures (see Tab. 4). Above , safely outside the cooling core region, the temperature profiles are isothermal (Fig. 6) and the difference in the entropy profiles reflects differences in the gas density profiles. MKW9 has a higher entropy throughout its ICM, at least up to the detection limit, than either A1991 or A2717, by a factor (Fig.11). Note that this difference corresponds to around the mean. From the simple argument, , we expect the luminosity of MKW9 to be considerably lower (by a factor ) than the luminosity of A1991 or A2717. A direct computation of the luminosity of the three clusters shows that this is indeed the case. The luminosities of A2717 and A1991 within the virial radius, excluding the central region, differ by less than per cent, while the luminosity of MKW9 is 4 times lower.
In spite of the above caveats, the picture that emerges from the present XMM-Newton study, together with previous constraints on the slope of the – relation (Ponman et al. psf03 (2003)), is that:
-
•
There is no break of self-similarity in the entropy profiles down to and in the radial range
-
•
In that radius and temperature domain, the entropy typically behaves as , with a normalisation at and .
-
•
The best guess dispersion in the scaled entropy profiles is per cent.
7.2.2 Comparison with theoretical expectations
The current view is that the departures of the gas properties from the standard self-similar picture are due to non-gravitational processes. However, in principle, these departures could also be due to some flaw in the modeling of the gravitational collapse itself, e.g. the underlying dark matter component does not obey self-similarity. We would like first to emphasize that the present study, which provides the first precise estimates of mass profiles for a significant number of low mass clusters, demonstrates that this is not the case (see Sect. 7.1). However, this does not mean that the gravitational heating of the gas is perfectly understood. For instance, Valegeas et al. (val03 (2003)) suggested that shock heating at very large scales might contribute significantly to the cluster entropy.
It is now fairly clear that pure cooling or simple pre-heating models fail to explain the observed cluster properties. This has already been greatly discussed in the literature (e.g. see Ponman et al. psf03 (2003)), and we will only briefly comment on it.
Spherical pre-heating models predict both a break in the relation and large isentropic cores (e.g Tozzi & Norman tn01 (2001), Figures 5 and 17) that are simply not seen, as the present study confirms. This does not mean that pre-heating does not play a role. As pointed out by Voit et al. (voit03 (2003)) and Ponman et al. (psf03 (2003)), pre-heating may also affect the generation of intracluster entropy by smoothing the accreted matter distribution, an effect not taken into account in simple spherical models. This effect, in combination with cooling, could explain cluster entropy properties (Voit & Ponman vp03 (2003)), although cosmological simulations are required to fully assess this explanation.
Pure cooling models are not actually discrepant with the entropy properties outlined above. They can explain the S-T relation at (Muawong et al. mua02 (2002), Fig. 4; Kay kay04 (2004), Fig. 1; see also Voit et al. voit02 (2002)), and do not predict a strong break of self-similarity of the entropy profiles (except perhaps below , Davé et al. dav02 (2002), Fig.5), although they may slightly overpredict the entropy at very large radii (Kay kay04 (2004)). The main problem with pure cooling models, as shown by the authors, is that they tend to suffer from overcooling (e.g., Muanwong et al. mua02 (2002), Davé et al. dav02 (2002)), which is at odds with the observed mass fraction of the stellar component (Balogh et al. bal01 (2001)). Furthermore, it seems plausible that the feedback be associated with the cooling (Voit and Bryan vb01 (2001)).
Thus the current consensus is that some combination of cooling and feedback acts to modify the entropy in clusters. The present entropy profile results can be compared with the predictions of the recent large scale numerical simulations of Borgani et al. (borg04 (2004)) and Kay (kay04 (2004)). Borgani et al.’s simulations incorporate a physically motivated model of star formation and SNII driven galactic winds. The heating was found to be insufficient, leading to a steeper relation than observed. Moreover, although the simulated entropy profiles were very similar in shape, their slope is shallower than found in our study: behaving roughly as (from Borgani et al. borg04 (2004), Figure 14). This is linked to strongly decreasing temperature profiles, which, as noted by the authors, is at odds with the observations. Targeted feedback models (Kay et al. kay03 (2003); Kay kay04 (2004)) seem to be more successful in reproducing the observed properties of cluster entropy profiles. In this phenomenological model, a fraction of particles which are about to undergo cooling are reheated to a fixed entropy level. When this level is fixed to about , this model reproduces the relation at (and at ). We also note the remarkable agreement between these simulations and our observations when comparing the entropy profile slope: both are slightly shallower than the shock-heating case. For instance the entropy profile of a cluster above is essentially a power law, with an entropy of and at and respectively. This can be compared to and from our results (Eq. 4). It remains of course to find a physical motivation for this type of feedback.
8 Conclusion
We have presented results from new XMM-Newton observations of three poor clusters (A1991, A2717 and MKW9) having similar temperatures (, 2.53 and 2.58 keV), and similar redshifts (). The paper concentrates on the properties of the mass and entropy profiles, which we were able to map up to . We then combined these data with previously published data on A1983 ( keV) and on the massive cluster A1413 ( keV), and examined the scaling properties of the profiles. The emerging picture from these XMM observations is that local clusters do form a self-similar population down to low mass ( or ).
Our study has provided clear evidence that the dark matter profile of local clusters is nearly universal and presents a central cusp, as predicted by numerical simulations. The concentration parameter of the clusters, and of other massive clusters from the literature, were found to be consistent with the – relation derived from numerical simulations for a CDM comology, in the mass range (taking into account the measurement errors and expected intrinsic scatter). This excellent agreement with theoretical predictions shows that the physics of the dark matter collapse is basically understood.
Except in the very centre, the entropy profiles of these clusters are self-similar in shape, with close to power law behaviour in the range. The slope is slightly shallower than predicted by shock heating models, . We have confirmed that the – relation is shallower than in the purely gravitational model, and has a normalisation consistent with that found from previous ROSAT/ASCA studies. The entropy scaling behaviour is summarized in our Eq. 4. We emphasize that the self-similarity of shape is a strong new constraint, and simple pre-heating models can already be ruled out. In addition to the gravitational effect, the gas history probably depends on the interplay between cooling and various galaxy feedback mechanisms.
The shape and scaling properties of the mass and entropy profiles of clusters are the key observational constraints to be considered by theoretical work. These profiles reflect respectively the physics of the gravitational collapse and thermodynamic history of the gas. They can now be measured with XMM-Newton in both massive and low mass clusters over exceptionally wide radial ranges. Larger cluster samples are still required to firmly establish the exact slopes and intrinsic scatter of the scaling laws, the –, – and – relations, and to confirm the self-similarity of form of the profiles over the full mass range.
Acknowledgements.
We thank Doris Neumann for her contribution to the early part of this project, and she, Etienne Pointecouteau and Klaus Dolag for useful discussions. We thank the referee for comments. GWP acknowledges support from the French Space Agency (CNES), and from the European Commission through a Marie Curie Intra-European Fellowship under the FP6 programme (contract no. MEIF-CT-2003-500915). The present work is based on observations obtained with XMM-Newton an ESA science mission with instruments and contributions directly funded by ESA Member States and the USA (NASA). This research has made use of the NASA’s Astrophysics Data System Abstract Service; the SIMBAD database operated at CDS, Strasbourg, France; the High Energy Astrophysics Science Archive Research Center Online Service, provided by the NASA/Goddard Space Flight Center and the Digitized Sky Surveys produced at the Space Telescope Science Institute.References
- (1) Allen, S.W., Schmidt, R.W., & Fabian, A.C. 2001, MNRAS, 328, L37
- (2) Anders, E., & Grevesse, N. 1989, GeCoA, 53, 197
- (3) Arabadjis, J.S., Bautz, M.W., & Garmire, G.P. 2002, ApJ, 572, 66
- (4) Arnaud, M., Neumann, D., Aghanim, N. et al. 2001, A&A, 365, L80
- (5) Arnaud, M., Aghanim, N., & Neumann, D. 2002, A&A, 389, 1
- (6) Arnaud, M., Majerowicz, S., Lumb, D., et al. 2002,A&A, 390, 27
- (7) Arnaud, M., Pratt, G.W., & Pointecouteau, E., 2004, MmSAI, 75, 729 (astro-ph/0312398)
- (8) Babul, A., Balogh, M.L., Lewis, G.F., & Poole, G.B. MNRAS, 330, 329
- (9) Balogh, M., Pearce, F.R., Bower, R.G., & Kay, S.T. 2001,
- (10) Beers, T.C., Flynn, K., & Gebhardt, K., 1990, AJ, 100, 32
- (11) Beers, T.C., Kriessler, J.R., Bird, C.M., & Huchra, J.P., 1995, AJ, 109, 874
- (12) Bialek, J.J., Evrard, A.E., & Mohr, J., 2001, ApJ, 555, 597
- (13) Borgani, S., Governato, F., Wadsley, J.,et al. 2002, MNRAS, 336, 409
- (14) Borgani, S., Murante, G., Springel, V. et al. , 2004, MNRAS, 348, 1078
- (15) Bower, R.G., 1997, MNRAS, 288, 355
- (16) Bower, R.G., Benson, A.J., Lacey, C.G., et al. , 2001, MNRAS, 325, 497
- (17) Brighenti, F., & Mathews, W.G., 2001, ApJ, 553, 103
- (18) Bryan, G.L. 2000, ApJ, 544,L1
- (19) Bryan, G.L., & Norman, M.L., 1998, ApJ, 495, 80
- (20) Bullock, J.S., Kollatt, T.S., Sigad, Y., et al. 2001, MNRAS, 321, 559
- (21) Buote D., & Tsai, J., 1996, ApJ, 458, 27
- (22) Buote D., & Lewis, A.D., 2004, ApJ, 604, 116
- (23) Davé, R., Katz, N., & Weinberg, D.H. 2002, ApJ, 579, 23
- (24) David, L.P., Jones, C., & Forman, W., 1996, ApJ, 473, 692
- (25) David, L.P., Nulsen, P.E.J., McMamara, B.R., et al. 2001, ApJ, 557, 546
- (26) De Grandi, S., & Molendi, S., 2002, ApJ, 567, 163
- (27) Dickey, J.M., & Lockman, F.J. 1990, ARA&A, 28, 215
- (28) Dolag, K., Baertelman, M., Perrotta, F., et al. , 2004, A&A, 416, 853
- (29) Dos Santos, S., & Doré, O., 2002, A&A, 383, 450
- (30) Eke, V.R., Navarro, J.F., & Frenk, C.S., 1998, ApJ, 503, 569
- (31) Eke, V., Navarro, J.F., & Steinmetz, M., 2001,ApJ, 554, 114
- (32) Evrard A.E., & Henry J.P, 1991, ApJ, 383, 95
- (33) Evrard, A.E., & Gioia, I. 2002, Merging Processes in Galaxy Clusters, ed. L. Feretti, I.M. Gioia, G. Giovannini, Astrophysics and Space Science Library, Vol. 272, 253
- (34) Finoguenov, A., Reiprich, T., Böhringer, H., 2001, A&A, 368, 749
- (35) Finoguenov, A., Arnaud, M., & David, L.P 2001, ApJ, 555, 191
- (36) Finoguenov, A., Borgani, S.,Tornatore, L., & Böhringer, H., 2003, A&A, 398, L35
- (37) Fujita, Y., & Takahara, F., 2000, ApJ, 536, 523
- (38) Ghizzardi, S. 2001, EPIC-MCT-TN-011 (XMM-SOC-CAL-TN-0022)
- (39) Ghizzardi, S. 2002, EPIC-MCT-TN-012
- (40) Girardi, M., Escalera, E., Fadda, D. et al. , 1997, ApJ, 482, 41
- (41) Huffenberger, K.M., & Seljak, U., 2003, MNRAS, 340, 1199
- (42) Irwin, J.A., & Bregman, J., 2000, ApJ, 538, 543
- (43) Jing, Y.P. 2000, ApJ, 535, 30
- (44) Kaastra, J.S., et al., 2004, A&A, 413, 415
- (45) Kaiser, N. 1991, ApJ, 383, 104
- (46) Kay, S.T., Thomas, P.A., Theuns, T., 2003, MNRAS, 343, 608
- (47) Kay, S.T., 2004, MNRAS, 347, L13
- (48) Khosroshahi, H.G., Jones, L.R., Ponman, T.J., 2004, MNRAS, 349, 1240
- (49) Kravtsov, A.V., Ypes, G., 2000, MNRAS, 318, 227
- (50) Loewenstein, M. 2000, ApJ, 532, 17
- (51) Lewis, A.D., Buote, D.A., & Stocke, J.T., 2003, ApJ, 586, 135
- (52) Liang H., Pierre M., Unewisse A., & Hunstead R.W. , 1997, A&A, 321, 64
- (53) Lloyd-Davies, E., Ponman, T., & Cannon, D.B., 2000, MNRAS, 315, 689
- (54) Markevitch, M., Forman, W., Sazazin, C., & Vikhlinin, A., 1998, ApJ, 503, 77
- (55) Menci, N., & Cavaliere, A., 2000, MNRAS, 2000, 311, 50
- (56) Metzler, C.A., & Evrard, A.E., 1994, ApJ, 437, 564
- (57) Moore, B., Quinn, T., Governato, F., Stadel, J., & Lake, G., 1999, MNRAS, 310, 1147
- (58) Muanwong, O., Thomas, P.A., Kay, S.T., & Pearce, F.R. 2002, MNRAS, 336, 527
- (59) Nath, B., & Roychowdhury, S., 2002, MNRAS, 333, 145
- (60) Navarro, J.F., Frenk, C.S., & White, S.D.M. 1997, ApJ, 490, 493 (NFW)
- (61) Navarro, J.F., Hayashi, E., Power, C. et al. , 2004, MNRAS, 349, 1039
- (62) Neumann, D., & Böhringer, H. 1995, A&A, 301, 865
- (63) Neuman, D., & Arnaud, M. 1999, ApJ, 542, 35
- (64) Pearce, F.R., Thomas, P.A., Couchman, H.M.P., Edge, A.C., 2000, MNRAS, 317, 1029
- (65) Pointecouteau, E., Arnaud, M., Kaastra, J., & De Plaa, J., 2004, A&A, in press, astro-ph/0403596
- (66) Ponman, T.J., Cannon, D.B., & Navarro, J.F. 1999, Nature, 397, 135
- (67) Ponman, T.J., Sanderson, A.J.R., & Finoguenov, A. 2003, MNRAS, 343, 331
- (68) Postman, M., & Lauer, T.R. 1995, ApJ, 440, 28
- (69) Pratt, G.W., & Arnaud, M. 2002, A&A, 394, 375
- (70) Pratt, G.W., & Arnaud, M. 2003, A&A, 408, 1
- (71) Rasmussen, J., Ponman, T.J., 2004, MNRAS, 349, 722
- (72) Read, A.M., & Ponman, T.J., 2003, A&A, 409, 395
- (73) Sanderson, A.J.R., Ponman, T.J., Finoguenov, A., Lloyd-Davies, E.J., & Markevitch, M., 2003, MNRAS, 340, 949
- (74) Sharma, M., McNamara, B.R., Nulsen, P.E.J., et al. , 2004, ApJ, in press, astro-ph/0405336
- (75) Sun, M., Forman, W., Vikhlinin, A., et al. , 2003, ApJ, 598, 250
- (76) Sun, M., Forman, W., Vikhlinin, A., et al. , 2004, ApJ, in press, astro-ph/0405511
- (77) Suto, Y., Saski, S., & Makino, N., 1998, ApJ, 509, 544
- (78) Tozzi, P., & Norman, C., 2001, ApJ, 546, 63
- (79) Valageas, P., & Silk, J. 1999, A&A 347,1
- (80) Valageas, P., Schaeffer, R. & Silk, J. 2003, MNRAS, 344, 53
- (81) Valdarnini, R., 2003, MNRAS, 339, 1117
- (82) Vikhlinin, A., Forman, W., & Jones, C., 1999, ApJ, 525, 47
- (83) Voit, G.M., Bryan, G.L., 2001, Nature, 414, 425
- (84) Voit, G.M., Bryan, G.L., Balogh, M.L., & Bower, R.G. 2002, ApJ, 576, 601
- (85) Voit, G.M., Balogh, M.L., Bower, R.G., Lacey, C.G., Bryan, G.L., 2003, ApJ, 593, 272
- (86) Voit, G.M., Ponman, T.J., 2003, ApJ, 594, L75
- (87) Wechsler, R.H., Bullock, J.S., Primack, J.R., Kravtsov, A.V., & Dekel, A., 2002, ApJ, 568, 52
- (88) Wu, K.K.S., Fabian, A.C., & Nulsen, P.E.J., 1998, MNRAS, 20, L301
- (89) Xue, Y.J., & Wu, X.P., 2003, ApJ, 584, 34
- (90) Yamada, M. & Fujita, Y., 2001, 553, L145
- (91) Zhao, D.H., Jing, Y.P., Mo, H.J., & Börner, G., 2003, ApJ, 597, L9