000
A. Biviano
Clusters of galaxies in the mid-infrared ††thanks: Based on observations with ISO, an ESA project with instruments funded by ESA Member Ststes (especially the PI countries: France, Germany, the Netherlands and the United Kingdom) and with participation of ISAS and NASA
Abstract
We describe the results of observations of galaxy clusters conducted with ISOCAM on-board the Infrared Space Observatory. Our research is aimed at understanding the processes driving galaxy evolution in dense environments, free from the bias of dust extinction. The results reveal quite a complex picture: the star-formation activity of cluster galaxies does not show a simple evolution with redshift, but also depends on the dynamical status and evolutionary history of the clusters.
keywords:
Galaxies: clusters: general – Infrared: galaxies1 Introduction


Many lines of evidence (e.g. van Dokkum & Franx, 1996; Lewis et al., 2002) indicate that the stellar populations of galaxies in cluster cores are old, with most of their stars formed at high redshifts. There is nonetheless observational evidence suggesting that at least a fraction of the cluster galaxies were more active in the past, namely: (a) the fraction of blue cluster galaxies increases with redshift – the so-called ’Butcher-Oemler’ (BO, hereafter) effect (Butcher & Oemler, 1978, 1984), and (b) the fraction of early-type clusters decreases with redshift (Dressler et al., 1997; Fasano et al., 2000). Presumably, both the colour and the morphological evolution of the cluster galaxy population derive from the transformation of blue spirals into S0’s, as they fall into clusters from the field (Katgert et al., 2003). Several physical mechanisms could operate this transformation (e.g. Okamoto & Nagashima, 2003), all resulting in the galaxy gas depletion, and a decrease of the star formation (SF) activity. Some of these processes induce a starburst phase before the gas depletion, and some do not.
In order to obtain an unbiased picture of the evolutionary history of cluster galaxies, it is important to observe them in the infrared (IR). In fact, dust can mask ongoing SF in a galaxy, and the amount of extinction increases with the amount of SF (e.g. Silva et al., 1998). In this paper we present the results of the mid-IR (MIR) observations of three galaxy clusters.
2 The data-set

The MIR data used in this paper come partly from a survey – described in detail in Metcalfe et al. (2003) – conducted with ISOCAM onboard the Infrared Space Observatory (ISO) (Cesarsky et al., 1996), and partly from the ISO archive. A detailed description of the data reduction, source detection and photometry, is given in Metcalfe et al. (2003). The three clusters considered here are A2218, A2219, and Cl0024+1654. A2218 and Cl0024+1654 have been imaged in two (wide) ISOCAM filters, LW2 and LW3, centered at 6.7 and 14.3 m, respectively; only the LW3 filter has been used for the A2219 field.
These three clusters span a redshift range 0.175–0.395, and the physical areas covered by observations vary from Mpc2 (A2218 and A2219) to Mpc2 (Cl0024+1654)111In this paper we use km s-1 Mpc-1, and .. The final data-set contains MIR detections of 43 cluster members. The limiting sensitivities reached were 34 and 95 Jy at, respectively, 6.7 and 14.3 m, in the A2218 field, and 468 and 160 Jy at 14.3 m in, respectively, the A2219, and Cl0024+1654 field.
The cluster membership is established by cross-correlation of the MIR sources with catalogues of optical and near-IR sources from the literature. The optical and near-IR data were also used to define the spectral energy distributions (SEDs, hereafter) of the ISOCAM sources, which were then fit with a battery of GRASIL models (Silva et al., 1998). The best-fit models were then used to compute the galaxy total IR luminosities, from which the SF rates (SFRs hereafter) were derived using the relation of Kennicutt (1998).
3 Results
A2218 is a massive cluster of galaxies (l.o.s. velocity dispersion km s-1) at a mean redshift . We detected 27 MIR cluster members, most of them at 6.7 m only. The left-hand panel of Figure 1 shows the distribution of SFRs for the 27 A2218 cluster sources; most of them have negligible SFRs. As a matter of fact, the SEDs of most MIR-selected cluster members decline from the near-IR to the MIR, and are best fit by GRASIL models of aged, passively evolving ellipticals. This is best seen in the average SED for the 27 cluster sources, shown in the right-hand panel of Figure 1, built by normalizing each source SED with its -band flux density. The solid line is the best-fit GRASIL model, an aged, passively-evolving elliptical. The MIR emission of most A2218 cluster sources is the Rayleigh-Jeans tail of the photospheric emission from cold stars (see also Boselli et al., 1997, for galaxies in the nearby Virgo and Coma clusters).
Among the 27 mid-IR cluster sources, 7, however, do show evidence of some SF activity. These are among the faintest ISOCAM-detected cluster members in the optical and near-IR. Hence, even if their SFRs are small ( yr-1), their IR luminosities are comparable or even higher than their near-IR and optical luminosities. SF activity therefore seems to be still ongoing in the less massive cluster members (reminiscent of the ’downsizing’ effect described in, e.g., Poggianti et al., 2004).
A2219 is a massive cluster of galaxies with a velocity dispersion very similar to that of A2218, and a slightly higher mean redshift (). Three cluster members were detected; they all display significant SF activity, with SFRs between 10 and 24 yr-1. Their SEDs are best fit by models of massive spiral galaxies, or of aged starbursts. At variance with what we saw in A2218, here the strong MIR emission of the A2219 cluster galaxies implies they contain a significant amount of dust that re-emits an intense stellar radiation field in the IR.
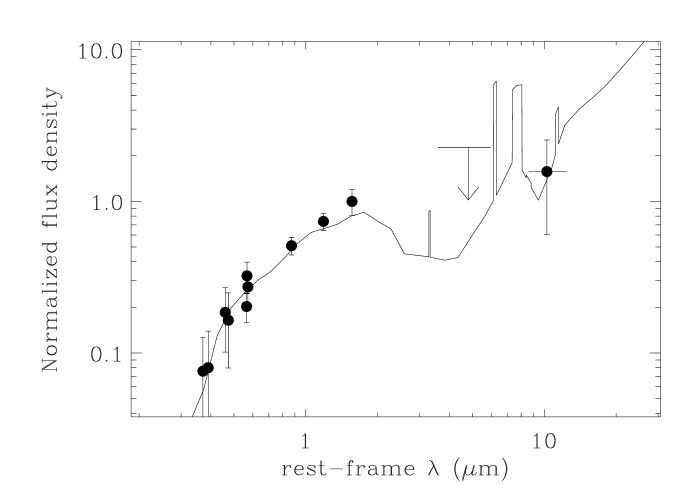
Cl0024+1654 is a cluster at , with a velocity dispersion of km s-1. In total, 13 cluster sources were detected at 14.3 m. They all show a substantial amount of SF activity, as can be seen from their SFR distribution shown in the left-hand panel of Figure 2. Their SEDs are best fit by models of massive (young) spirals, or aged starbursts. This is best seen from the right-hand panel of Figure 2, where we show the average SED of the 13 MIR cluster sources, with the best-fitting model (an aged starburst galaxy) overlaid. Note the very different shape of this SED and of the average SED of A2218 cluster members (Figure 1). As in A2219, also in Cl0024+1654 the IR emission of MIR-selected cluster galaxies probably arises from an intense stellar radiation field absorbed and re-emitted by dust.
Interestingly, the spatial distribution of the MIR cluster members in Cl0024+1654 is significantly different from that of the optically-selected cluster members, the former being less centrally concentrated. This suggests that the MIR cluster galaxies are a distinct population from the other members of this cluster.
4 Conclusions
We detected 43 MIR emitting galaxies, members of three clusters. In one of them, A2218, just as in several nearby clusters (see also Boselli et al., 1997), most mid-IR-selected galaxies have negligible or small SFRs, and the IR emission is the Rayleigh-Jeans tail of cold stellar photospheres. However, in both A2219 and Cl0024+1654, the detected MIR sources have high SFRs, several tens yr-1, and their emission is likely to come mostly from dust re-processed stellar radiation (although we cannot exclude an AGN contribution in some of them). Comparing their SFRs with those derived from optical lines, it is found that up to 90% of their SF activity is hidden by dust.
At first, it might seem that we are seeing an IR analogue of the BO effect, since the average SFR of MIR cluster galaxies seems to increase with the mean redshift of the cluster. However, not all MIR star-forming cluster galaxies are part of the BO population, and a fraction of them are actually found along the main colour-magnitude sequence of passive early-type galaxies. Their red colour is however not an indication of an aged stellar population, but of significant dust extinction.
It is important to understand why there is such a spread of the average SFR of cluster galaxies among different clusters. Part of the difference likely arises because of the different surveyed areas. Since the MIR cluster galaxies with high SFRs seem to avoid the inner cluster regions, we could have missed this population in, e.g., A2218. However, the surveyed area of A2219 is comparable to that of A2218, and yet the MIR populations of the two clusters have different SFR-distributions. Probably, cluster properties other than their redshifts play an important rôle in determining the average SFR of cluster galaxies. In fact, A2218 and Cl0024+1654 are located at the same redshifts as, respectively, A1689 and A370, yet their member galaxies have very different SFR distributions (Duc et al., 2002; Coia et al., 2004). Bekki (2001) suggested that the disturbed gravitational tidal field induced by an infalling sub-cluster might trigger SF in cluster galaxies. However, all three clusters considered here show evidence of substructures. It seems likely that the SF properties of cluster galaxies are determined not only by the dynamical status, but also by the dynamical history of their cluster (see Biviano et al., 2004, for a thorough discussion).
References
- Bekki (2001) Bekki, K. 2001, ApJ, 546, 189
- Biviano et al. (2004) Biviano, A., et al. 2004, A&A, accepted
- Boselli et al. (1997) Boselli, A., et al. 1997, A&A, 324, L13
- Butcher & Oemler (1978) Butcher, H., & Oemler, A. 1978, ApJ, 219, 18
- Butcher & Oemler (1984) Butcher, H., & Oemler, A. 1984, ApJ, 285, 426
- Cesarsky et al. (1996) Cesarsky, C., et al. 1996, A&A, 315, L309
- Coia et al. (2004) Coia, D., et al. 2004, A&A, submitted
- Dressler et al. (1997) Dressler, A., et al. 1997, ApJ, 490, 577
- Duc et al. (2002) Duc, P.-A., et al., 2002, A&A, 382, 60
- Fasano et al. (2000) Fasano, G., et al. 2000, ApJ, 542, 673
- Katgert et al. (2003) Katgert, P., Thomas, T., & Biviano, A. 2003, Ap&SS, 285, 19
- Kennicutt (1998) Kennicutt, R.C. 1998, ARA&A, 36, 189
- Lewis et al. (2002) Lewis, I.J., et al. 2002, MNRAS, 334, 673
- Metcalfe et al. (2003) Metcalfe, L., et al. 2003, A&A, 409, 791
- Okamoto & Nagashima (2003) Okamoto, T., & Nagashima, M. 2003, ApJ, 587, 500
- Poggianti et al. (2004) Poggianti, B.M. et al. 2004, ApJ, 601, 197
- Silva et al. (1998) Silva, L. et al. 1998, ApJ, 509, 103.
- van Dokkum & Franx (1996) van Dokkum, P.G., & Franx, M. 1996, MNRAS, 281, 985