11email: Luca.Cortese@mib.infn.it; Giuseppe.Gavazzi@mib.infn.it 22institutetext: Laboratoire d’Astrophysique de Marseille, BP8, Traverse du Siphon, F-13376 Marseille, France.
22email: alessandro.boselli@oamp.fr; jorge.iglesias@oamp.fr 33institutetext: Instituto Nactional de Astrofisica, Optica y Electronica, Apartado Postal 51 C.P. 72000 Puebla, Pue., Mexico. 33email: carrasco@transum.inaoep.mx 44institutetext: Observatorio Astronomico Nacional/UNAM, Ensenada B.C., Mexico.
Multiple merging in the Abell cluster 1367.††thanks: Based on observations obtained with the William Herschel Telescope operated on the island of La Palma (Spain) by the Isaac Newton Group, with the Loiano telescope belonging to the University of Bologna (Italy) and with the G.Haro telescope of the INAOE (Mexico).
We present a dynamical analysis of the central 1.3 square degrees of the
cluster of galaxies Abell 1367, based on 273 redshift measurements (of which 119 are news).
From the analysis of the 146
confirmed cluster members we derive a significantly non-Gaussian velocity distribution, with
a mean location and a scale .
The cluster appears elongated
from the North-West to the South-East with two main density peaks associated
with two substructures.
The North-West subcluster is probably in the early
phase of merging into the South-East substructure ( 0.2 Gyr before core crossing).
A dynamical study of the two subclouds points out the existence
of a group of star-forming galaxies infalling into the core of the South-East subcloud
and suggests that two other groups are infalling into the NW and SE
subclusters respectively.
These three subgroups contain a higher fraction of star-forming galaxies
than the cluster core, as expected during merging events.
Abell 1367 appears as a young cluster currently forming at the
intersection of two filaments.
Key Words.:
Galaxies: clusters: individual: A1367 - Galaxies: evolution - Galaxies: distances and redshift1 Introduction
Clusters of galaxies represent the most massive gravitationally
bound systems in the Universe.
They provide us with valuable insights into the formation
of large-scale structures, as well as into
the formation and evolution of galaxies.
The hierarchical model predicts
that galaxy clusters are formed by accretion of units
of smaller mass at the nodes of large-scale filaments (West et al. 1991; Katz & White 1993).
Statistical analyses of clusters have shown
that even at low redshift a high fraction of clusters presents substructures,
implying that clusters are still dynamically
young units, undergoing the process of formation (Dressler & Shectman 1988).
The Abell cluster 1367 ()
lies at the intersection of two filaments, the first extending
roughly 100 Mpc from Abell 1367 toward Virgo (West & Blakeslee 2000), the second connecting
Abell 1367 to Coma (as a part of the Great Wall, Zabludoff et al. 1993).
With its irregular X-ray distribution (Jones et al. 1979; Bechtold et al. 1983; Grebenev et al. 1995),
high fraction of spiral galaxies and low central galaxy density, Abell 1367 can be
considered as the prototype of a nearby dynamically young cluster.
ASCA X-ray observations pointed out the existence of a strong localized shock
in the intra-cluster medium (ICM) suggesting that Abell 1367 is experiencing a merging between
two substructures (Donnelly et al. 1998).
Moreover recent Chandra observations (Sun & Murray 2002), and a preliminary
analysis of the XMM data (Forman et al. 2003), indicate the presence of
cool gas streaming into the cluster core, supporting a multiple merger scenario.
Optical and radio observations also suggest that this cluster is currently
experiencing galaxy infall into its center.
Gavazzi et al. (1995, 2001) discovered two head-tail radio sources associated with disk galaxies with an excess
of giant HII regions on their leading edges, in the direction of the cluster center.
The observational scenario is consistent with the idea that ram-pressure
(Gunn & Gott 1972) is, for a limited amount of time,
enhancing the star formation of galaxies that are entering the
cluster medium.
In addition Gavazzi et al. (2003b) pointed out the existence of a group of star bursting galaxies
infalling into the cluster core.
Although X-ray, radio and optical observations suggest that Abell 1367 is
dynamically young and it is still undergoing the process of formation,
detailed spatial and dynamical analysis of this cluster has not been attempted so far.
Girardi et al. (1998) detected a secondary peak in the cluster velocity
distribution, suggesting that Abell 1367 is a binary cluster, but their analysis
was based on 90 redshifts, insufficient for drawing a detailed model of the cluster kinematics.
Cortese et al. (2003) carried out a deep ()
spectroscopic survey of the central 1.3 square degrees of Abell 1367
adding 60 new spectra (33 members).
Here we present new measurements for 119 galaxies (adding another 33 cluster members).
In total 273 redshifts were measured in the region, out of which 146 are cluster members,
allowing the first detailed dynamical analysis of Abell 1367.
This paper is arranged as follows: Sec.2 briefly describes the studied sample and
it contains a description of the observations
and data reduction. The analysis of the 1D velocity distribution is given in Sec.3.
Tests of 3D substructure are presented in Sec.4.
The various spatial and/or velocity substructures detected in our
sample are studied in Sec.5. The star formation of galaxies in the infalling groups
is discussed in Sec.6.
The mass of the whole cluster and of the two main substructures are computed in Sec.7.
Sec.8 studies the current dynamical state of the system.
Our conclusions are briefly summarized in Sec.9.
We assume a cluster distance of 91.3 Mpc (Gavazzi et al. 1999) corresponding to a Hubble
constant of 71 .
2 Observations and data reduction
The cluster region analyzed in this work covers an area of 1.3 square degrees
centered at .
imaging material was used to extract a catalogue of galaxy candidates
in Abell 1367 complete to mag, and to select the targets of the present spectroscopic survey.
The majority of the photometric catalogue, covering the northern and western part of Abell 1367,
was published by Iglesias-Páramo et al. (2003); conversely
the south-east catalogue extension will be given in a forthcoming paper.
Spectroscopy of Abell 1367 was obtained with the
AF2-WYFFOS multi fiber spectrograph at the 4.2m William
Herschel Telescope (WHT) on La Palma (Spain) during 2003, March 27-29.
WYFFOS has 150 science fibers of 1.6 arcsec diameter
coupled to a bench-mounted spectrograph which relies on a TEK CCD.
The 316R grating was used, giving a dispersion of
240 , a resolution of FWHM, and a total spectral coverage
of 5600 . The spectra were
centered at , thus covering from .
We allocated typically 70 objects to fibers
in a given configuration and, on average, 15 sky fibers.
A total of 4 configurations were executed, with an
exposure time of 4x1800 sec for each configuration.
Argon lamps for wavelength calibration were obtained for each exposure.
The reduction of the multi fiber spectra was performed in the IRAF111IRAF is
distributed by the National Optical Astronomy Observatories, which is operated
by the Association of Universities for Research in Astronomy, Inc., under
the cooperative agreement with the National Science Foundation environment,
using the IMRED package.
After bias subtraction, the apertures were defined on dome flat-field frames and used to
trace the spectra on the CCD.
The arc spectra were extracted and matched with arc lines to determine the dispersion solution.
The rms uncertainty of the wavelength calibration ranged between 0.1 and 0.3 .
The lamps’ wavelength calibration was checked
against known sky lines. These were found within of their nominal
position, providing an estimate of the systematic
uncertainty on the derived velocity of .
The object spectra were extracted, wavelength calibrated and normalized
to their intensity in the interval 5400-5600 .
A master sky spectrum, that was constructed by combining various
sky spectra was normalized to each individual science spectrum and then
subtracted from it. Unfortunately strong sky residuals were left after this procedure, limiting the
number of useful spectra to 98 (as listed in Tab. 7).
Nine additional long-slit, low dispersion spectra were obtained in March 2003 and in February 2004 using the
imaging spectrograph BFOSC attached to the Cassini 1.5m telescope at Loiano (Italy).
Another twelve spectra were taken with LFOSC at the 2.1m telescope of the Guillermo
Haro Observatory at Cananea (Mexico).
These observations were performed using a 2.0 arcsec slit and
the wavelength calibration was secured with exposures of HeAr and XeNe lamps at Loiano
and Cananea respectively.
The on-target exposure time ranged between 15 and 30 min according to the brightness
of the targets.
After bias subtraction,
when 3 or more frames of the same target
were obtained, these were combined (after spatial alignment) using a median filter
to help cosmic rays removal.
Otherwise the cosmic rays were removed using the task COSMICRAYS and/or under
visual inspection.
The lamps wavelength calibration was checked
against known sky lines. These were found within from their nominal
position, providing an estimate of the systematic
uncertainty on the derived velocity of .
After subtraction of sky background, one-dimensional spectra were
extracted from the frames.
The redshift were obtained using the IRAF FXCOR Fourier
cross-correlation (Tonry & Davis 1979)
task, excluding the regions of the spectra affected
by night-sky lines.
Moreover all the spectra and their best correlation function were visually examined
to check the redshift determination.
Table 1 lists the characteristics of the instrumentation
in the adopted set-up.
The 119 new velocity measurements presented in this work are listed in Table 7
as follows:
Column 1: Galaxy designation.
Column 2, 3: (J2000) celestial coordinates, measured with few arcsec uncertainty.
Column 4: band magnitude.
Column 5: observed recessional velocity.
Column 6: telescope (WHT=William Herschel Telescope; LOI=Loiano; CAN=Cananea)
Combining the new set of 119 redshifts (given in Tab. 7) with
the ones available from the literature (NED; Cortese et al. 2003; Rines et al. 2003), we have the redshift for 273 galaxies
of which 146 are cluster members
().
The cumulative redshift distribution, in the observed
area, as a function of the magnitude is shown in Fig.1.
The completeness is 70% at , and it drops
to 45% at .
|

3 The global velocity distribution

The line of sight (LOS) velocity distribution for the 146 cluster members
is shown in Fig. 2.
The mean and standard deviation are known to be efficient
estimators of the central location and scale when the underlying
population is gaussian. Unfortunately
they are not minimum variance estimators when the nature
of the observed population is significantly non-Gaussian.
The best location and scale estimators must be resistant
to the presence of outliers and robust to a broad range
of non-Gaussian underlying populations.
Thus, following Beers et al. (1990), we consider the biweight estimator as
the best estimator of location () and scale () of the cluster velocity distribution.
We find a location and a scale ,
in agreement with previous studies (e.g. Girardi et al. 1998; Struble & Rood 1999).
Visual inspection of Fig. 2 suggests that
the velocity distribution differs from a Gaussian, a deviation that should be quantified
using appropriate statistical tests.
We analyze the higher moments of the distributions using the kurtosis and
the skewness shape estimators.
Kurtosis indicates a difference in the tails length compared to a Gaussian
(positive kurtosis is indicative of long tails).
Skewness indicates asymmetry
(positive skewness implies that the distribution is depleted from values lower than the mean location,
conversely negative skewness denotes a depletion of values higher than the mean).
In addition we calculate the asymmetry index (AI) and tail index (TI)
introduced by Bird & Beers (1993) as alternatives to the distribution higher moments.
These indicators measure the shape of a distribution but, contrary to
skewness and kurtosis, which depend on the estimate of the location and the scale
of the underlying distribution, they are based on the order statistics of the dataset.
The AI measures the symmetry in a population by comparing gaps in the data on the left
and right sides of the sample median. The TI compares the spread of the dataset
at 90% level to the spread at the 75% level.
The kurtosis, skewness and the TI reject a Gaussian distribution
with a confidence level of 99%, suggesting that the cluster velocity distribution has longer tails
than a Gaussian of the same dispersion.
Moreover, in order to assess the normality of the velocity distribution, we
use the Wilk - Shapiro (W) test (Yahil & Vidal 1977).
Contrary to the and Kolmogorov Smirnov, this
test does not require any hypothesis on the mean and variance of the normal distribution.
The W test rejects normality with a confidence level of 98.7%, in agreement
with kurtosis, skewness and TI (see Table 2).
The departure from a normal distribution could result
from a mixture of several velocity distributions with different location
and smaller velocity dispersion than the whole sample;
thus, using
the program ROSTAT (Beers et al. 1990), we investigate the presence of significant
gaps (Beers et al. 1991) in the velocity
distribution, indicating subclustering.
A weighted gap is defined by:
where is the number of values in the dataset. A weighted gap is significant if its value, relative to the midmean (the mean of the central 50% of the dataset) of the other weighted gaps, is greater than 2.25. This value corresponds to a probability of occurrence in a normal distribution of less than 3%. We detected six significant weighted gaps in the Abell 1367 velocity distribution. The stripe density plot of radial velocities and the position of each gap (indicated with an arrow) are shown in Fig. 2. The velocity of the object preceding each gap, the normalized size of the gap and the probability of finding a normalized gap of the same size and position in a normal distribution are listed in Table 3.
|
|
4 Localized velocity structures
Given the non-Gaussian nature of the velocity distribution,
we looked for spatially localized variations
in the LOS velocity and velocity dispersion distributions.
First of all we applied the three 3D tests
commonly used to quantify the amount of substructures in galaxy clusters:
the test (Dressler & Shectman 1988), the test (West & Bothun 1990) and the test
(Bird 1994).
The test is based on the comparison of the local mean velocity, ,
and the velocity dispersion, , associated to each cluster member
(computed using its 10 nearest neighbors) with
the mean velocity , and dispersion , of the whole galaxy sample.
For each galaxy, the deviation is defined by:
The observed cumulative deviation , defined as the sum of the ’s for
the cluster members, is used to quantify the presence of substructures.
As shown by Pinkney et al. (1996) for samples with no substructures, the value of is
approximately equal to the total number of galaxies, while it is larger in the presence of substructures.
The test measures how much the centroid of the galaxy distribution
shifts as a result of correlations between the local kinematics and the projected
galaxy distribution.
The centroid of the whole galaxy distribution is defined as:
For each galaxy and its 10 nearest neighbors in the velocity space, the spatial centroid is defined as:
where is the velocity dispersion for galaxy and its 10 nearest neighbors in projection. Finally the presence of substructures in the cluster sample is quantified using the statistic defined as:
which represents the mean centroid shift for the galaxy cluster.
The higher the value of , the higher the probability of
substructures.
The test quantifies the correlations between the position and the projected mass
estimator (Heisler et al. 1985), defined as:
where is the radial peculiar velocity with respect to the nearest neighbors group (composed by a galaxy and its 10 nearest neighbors) and is the projected distance from the center of the nearest neighbor group. The substructure statistic is then defined as:
which represents the average mass of the nearest neighbors groups in the cluster.
Since galaxies in the nearest neighbors
groups have small projected separations, is generally
smaller than the global mass estimate.
is lower for a cluster with substructures
than for a relaxed system.
The value and the significance
of the above tests are listed in Table 4.
|
These statistical tests are calibrated using 1000 Monte Carlo simulations that randomly shuffle the velocity of galaxies, keeping fixed their observed position, thereby destroying any existing correlation between velocity and position. The probability of subclustering is then given as the fraction of simulated clusters for which the test value is lower (larger for the test) than the observed one.

Assuming that these tests reject the null hypothesis if the confidence level
is greater than 90%, only the test finds evidence of substructures (see Table
4). The local deviations from
the global kinematics as measured by the test are shown in Fig 3.
The positions of galaxies are marked with
open circles whose radius scales with their
local deviation from the global kinematics.
The presence of a substructure with a high deviation from
the global cluster kinematic is evident projected near the cluster core.
More insights on the cluster dynamical state can be achieved by comparing the results
of the one and three dimensional statistical tests with the
N-body simulations performed by Pinkney et al. (1996).
These authors analyzed how the significance level
of statistical tests of substructure varies in different cluster merging scenarios.
The deviation of the velocity distribution from a Gaussian and the detection of substructure
provided by the test suggest that Abell 1367 is in the early merging stage,
Gyr before core crossing.
5 The cluster dynamics
The analysis of the galaxy distribution, of the local mean LOS velocity and of the velocity dispersion
give further insight onto the cluster structure.
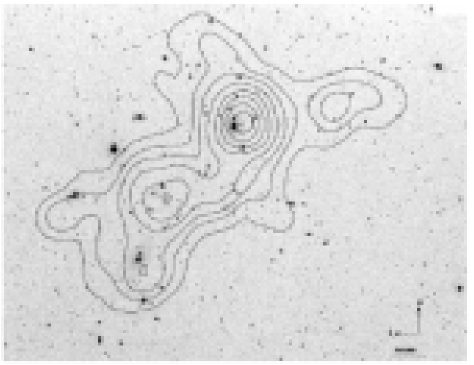
The iso-density map of the cluster members (computed using the 10 nearest neighbors to each point)
is shown in Fig.4 (left).
The galaxy distribution appears elongated from north-west to south-east
with two major density peaks.
The highest density region corresponds approximately to
the center of the NW X-ray substructure detected by
ROSAT (Donnelly et al. 1998), while the
secondary density peak is slightly offset from the X-ray cluster center
(, Donnelly et al. 1998).
Moreover the south galaxy density peak roughly coincides with the substructure
detected by the test (see Fig.3) and with the infalling group of
star-forming galaxies studied by Gavazzi et al. (2003b).
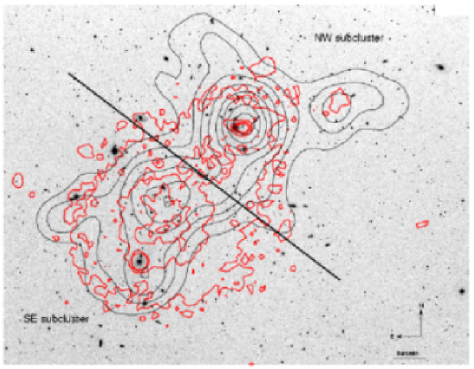
The iso-density contours superposed on
the ROSAT X-ray contours are shown in Fig.4 (right).
The region between the two major density peaks coincides with
the strong gradient in the gas temperature (see the straight line in Fig.4, right)
observed for the first time by
ASCA (Donnelly et al. 1998) and recently confirmed by Chandra (Sun & Murray 2002).
This abrupt temperature change is strongly suggestive
of a shock which has generated during a collision
between two substructures, probably associated with the SE and the NW galaxy density peaks.
In fact N-body simulations show that temperature structures and X-ray morphology
similar to the one observed in Abell 1367 are typical of clusters at
an early merging phase ( Gyr before core crossing)
(Schindler & Mueller 1993; Gomez et al. 2002).
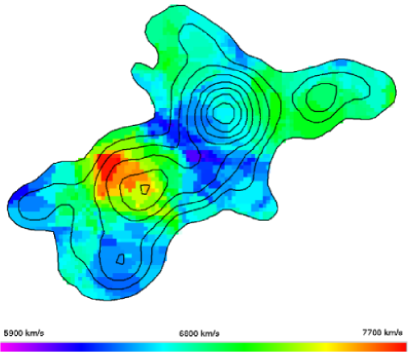
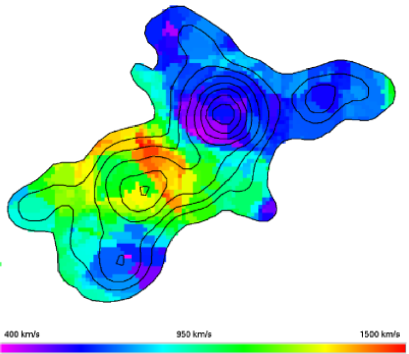
The merging scenario is further supported by the LOS velocity
and velocity dispersion fields (computed using the 10 nearest neighbors to
each point) shown in Fig. 5.
The SE subcluster has higher LOS velocity and velocity dispersion
than the NW substructure.
The region with the highest LOS velocity and velocity dispersion lies
6 arcmin N from the X-ray cluster center and it coincides with
the substructure detected by the test.
This result points out the presence of a group of galaxies infalling
in the SE cluster core (see Sec.5.2).
Thus the NW subcluster appears as a relaxed system with the lowest velocity dispersion
among the whole sample; on the other hand the SE subcluster appears far from
relaxation, and it is probably experiencing a multiple merging event.
We use the position of the gas temperature gradient, shown by
the straight line in Fig.4 (right), to divide our sample into two regions
and to study separately the dynamical properties of the two subclusters.
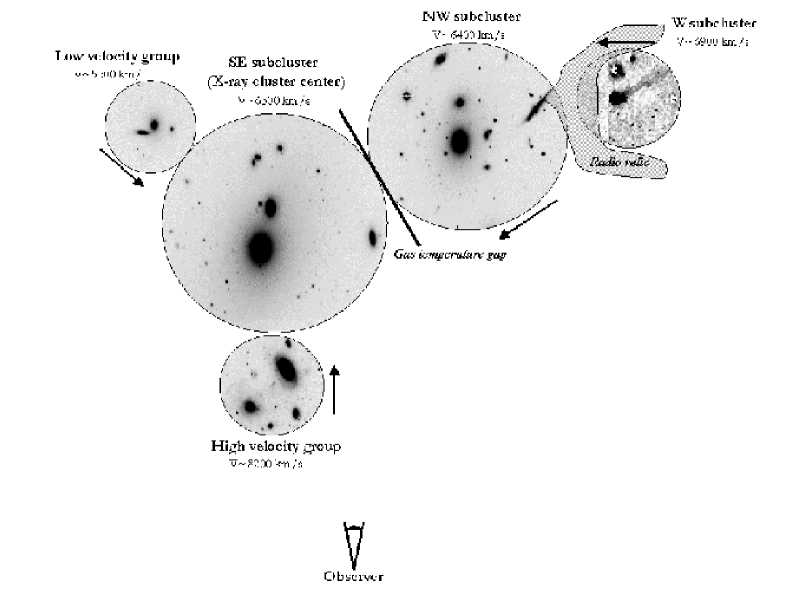
A sketch of the cluster dynamical model discussed in the next section
is given in Fig.6.
5.1 The North-West subcluster
The NW subcluster is composed of 86 galaxies and includes two density peaks:
the highest and a
secondary one located at the western periphery of the subcluster (labeled as W subcluster
in Fig.6), with a weak X-ray counterpart.
It has a similar mean location () and a lower
scale () than the whole cluster.
Fig.8 shows the LOS velocity distribution of this subcluster.
The W test rejects the Gaussian hypothesis at a confidence level of 39%.
Thus the LOS velocity distribution is consistent with a
Gaussian distribution, suggesting that this subcluster is a virialized system.
Moreover its increasing velocity dispersion profile (see Fig. 9) is consistent
with a relaxed cluster undergoing two body relaxation in the dense central region,
with circular velocities in the center and more isotropic velocities in the external
regions (Girardi et al. 1998).
However this subcluster also shows some evidences of merging (see Fig.7).
The brightest galaxy of this cloud CGCG97-095 (NGC3842), located 2 arcmin SE from
the NW density peak, is a radio galaxy classified as a narrow-angle
tail (NAT) (Bliton et al. 1998).
The tail orientation (indicated with an arrow in Fig. 7) suggests that this galaxy (and
the associated substructure) is moving
from north-west to south-east, toward the main cluster core.
Moreover two CGCG (Zwicky et al. 1961-1968) galaxies, 97-073 and 97-079,
show features consistent with the infall scenario.
Gavazzi et al. (1995, 2001) found that both galaxies
have their present star formation enhanced along peripheral
HII regions which developed at the side facing the direction of motion
through the cluster IGM.
Their neutral hydrogen is significantly displaced in the opposite side
(Dickey & Gavazzi 1991),
where 50 kpc long tails are detected both in the light of the synchrotron radiation
(Gavazzi & Jaffe 1987)
and in H (Gavazzi et al. 2001).

The observational scenario is consistent with the idea that ram-pressure
(Gunn & Gott 1972) is enhancing for a limited amount of time
the star formation of galaxies that are entering the
cluster medium for the first time.
However these two galaxies appear not directly
associated with the center of the NW subcluster since they lie at a projected
distance of 0.34 Mpc from the main density peak (see Fig.7).
Moreover their large distance (0.48 Mpc) from
the shock front observed in X-ray between the
NW and the SE substructure indicates that these objects do not belong to
the main galaxy density peak infalling into the cluster center.
Conversely they are at a projected distance of only 0.08 Mpc from the center
of the W subcluster, suggesting
that they are associated with this subcloud.
For these reasons we consider
an alternative scenario in which these two galaxies belong to a secondary
substructure infalling into the NW substructure from the western side (see Fig. 6).
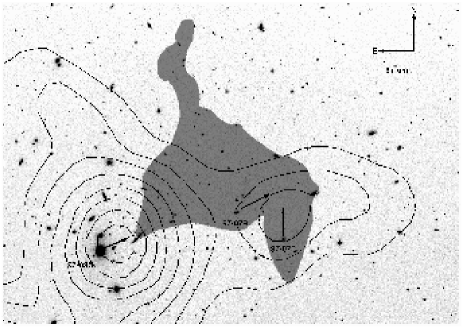
This picture is supported by the presence of the extended radio relic detected both in
X-ray and radio continuum in this region (Gavazzi 1978; Gavazzi & Trinchieri 1983).
Cluster radio halos contain fossil radio plasma, the former outflow of a radio galaxy, that has been revived
by shock compression during cluster merging (Enßlin et al. 1998; Enßlin & Brüggen 2002).

The radio relic observed in Abell 1367 extends, south-west to north-east, from 97-073 to 127-040 with a projected extent of 0.8 Mpc (see Fig.7). The age of its electrons is estimated to be (Enßlin et al. 1998). The only plausible source of high energy electrons available in this region is the NAT galaxy 97-095, presently at 0.25 Mpc from the relic and whose tails point exactly in the relic direction. Assuming that the fossil radio halo originated from 97-095, we find that the infall velocity of this galaxy into the SE subcluster is , consistent with the typical infall velocity of cluster galaxies. Thus the presence of the radio relic results consistent with a merging scenario in which the W subcluster, containing 97-079 and 97-073, is infalling into the NW substructure, compressing the plasma ejected from 97-095 and re-accelerating the electrons to relativistic energies.
5.2 The South-East subcluster
The SE cloud is composed of 60 galaxies associated with the X-ray cluster center.
It has the highest LOS velocity and dispersion of the whole sample
(see Fig.5) with a location and a
scale .
Its velocity distribution, shown in Fig. 8, appears significantly non-Gaussian.
The W test rejects the Gaussian hypothesis at a confidence level of 96.8%,
supporting the idea that the cluster center is far
from relaxation.
This is in agreement with the decreasing velocity dispersion profile of this
region (see Fig.9),
consistent with isotropic velocities in the center and radial velocities
in the external regions, as expected in the case
of galaxy infall onto the cluster (Girardi et al. 1998).
The velocity distribution of Fig. 8 has three
peaks at , and respectively,
probably associated with three separate groups.
Moreover we remark that the galaxy gaps between the three peaks
are fairly consistent with two of the most significant weighted gaps detected in the global
velocity distribution ( and ).
In order to check for any position-velocity segregation,
we divide the SE subcluster in three groups according to their LOS velocity:
galaxies with belong to the low velocity
group, galaxies with belong to the high velocity group and
galaxies with intermediate velocity belong to the SE subcluster.

The projected distribution of the three groups is shown in Fig.10.
The high-velocity group (, triangles) appears segregated
in the northern part of the SE cloud, extending 20 arcmin in right ascension but
only 7 arcmin in declination.
It is associated with the substructure detected by the test
(see Fig. 3)
and with the infalling group of star-forming galaxies recently discovered
by Sakai et al. (2002) and by Gavazzi et al. (2003b).
Its spatial segregation and high star formation activity suggest that this group is a
separate unit infalling into the cluster, probably from the near side (see Fig. 6).
It is remarkable that Sun & Murray (2002), using Chandra observations of the cluster center, discovered
a ridge-like structure around the cluster center, 6 arcmin south from the center of the
high velocity group, probably associated with a compact merging subcluster
(perhaps this group) penetrating the SE cluster core.
The low-velocity group (, circles in Fig.10)
seems segregated in the eastern part of the cloud, perhaps infalling
from the eastern side into the cluster core (Fig. 6).
This scenario is also supported by the detection of
cool gas streaming into the cluster core from the eastern side (Forman et al. 2003),
probably associated with this low velocity group of galaxies.
Galaxies with (squares in Fig.10)
are homogeneously distributed over the SE subcluster, representing
its virialized galaxy population.
However the brightest galaxy in this group 97-127 (NGC3862) is a NAT radio galaxy with very
extended radio tails pointing in the direction of the low velocity group (Gavazzi et al. 1981),
suggesting motion relative to the IGM.
The velocity-space segregation observed in the SE subcluster
suggests that the cluster center is experiencing multiple merging of at least
two separate groups, supporting the idea that it is far
from relaxation. This picture is consistent with the high gas entropy in this region,
since in absence of a cool dense core the substructures infalling into
the major cluster can penetrate deep inside, disturbing the cluster
core dynamics (Churazov et al. 2003).
A sketch of the various substructures identified in Abell 1367 by the present study, is given in Fig. 6.
Five substructures are detected. Two clouds, the NW and SE subclusters, are
in the early merging phase, meanwhile three smaller groups are infalling into Abell 1367.
The W subcloud, associated with
the head-tail systems 97-073/79, is probably infalling into the NW subcluster, exciting
the radio relic observed in between the two structures.
The other two groups are infalling into the SE subcluster: the low velocity group from the eastern side,
while the high velocity group from the near side.

6 Star formation activity in the infalling groups
The dynamical study presented in the previous sections indicates that
Abell 1367 is a dynamically young cluster in the early stage of a multiple merging event
involving at least five substructures.
Since merging is expected to trigger star formation in cluster galaxies
(Bekki 1999), we study separately the spatial and velocity distribution of the star forming galaxies.
Only 49 out of the 146 cluster members show recent star formation activity (e.g. H line in
emission, Iglesias-Páramo et al. 2002; Gavazzi et al. 2003a; Cortese et al., in preparation).
Fig.11 shows the LOS velocity distribution of galaxies divided into emission line
(upper panel) and non emission line (lower panel) galaxies.
The star forming sample has higher location and scale (,
) than the quiescent sample
(, ).
According to a two-sample Kolmogorov-Smirnov test the two velocity distributions
have only 5% probability of being consistent, suggesting a different origin and/or evolution.
We remark that, if the star forming galaxies are infalling onto the cluster along
radial orbits, their velocity dispersion should be times the velocity dispersion
of the relaxed sample, as observed in this case.
This result suggests that star forming systems are an infalling population
while the non-star forming galaxies represent the virialized cluster population.
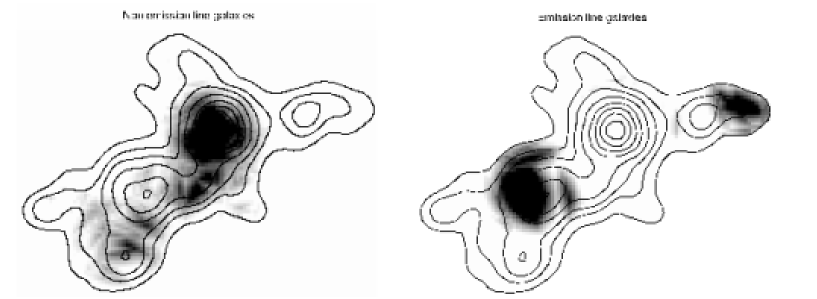
The projected density distribution of star forming and non star forming
is shown in Fig.12. The highest density of non emission line systems is
observed near the center of the NW substructure.
This morphological segregation further supports the idea that the NW cloud is a relaxed system
merging for the first time into the SE subcluster.
The emission line galaxies have a different distribution.
The highest density of star forming systems is in the infalling groups, i.e. in the high velocity
group infalling into the SE subcluster and in the W cloud infalling into the NW
substructure, suggesting that their interaction with the cluster environment
is triggering some star formation activity.
Indeed in these systems the fraction of star forming galaxies lies
between 64% and 36%, decreasing to 31% in the NW substructure and to 20% in the SE subcluster.
7 Cluster mass
|
The virial theorem is the standard tool used to estimate the dynamical mass of galaxy clusters. Under the assumptions of spherical symmetry and hydrostatic equilibrium and if the mass distribution follows the distribution of the observed galaxies independent of their luminosity, the total gravitational mass of a cluster is given by
where is the galaxy velocity dispersion and is the cluster mean harmonic radius:
where is the total number of galaxies.
An alternative approach is to use the projected mass estimator (Heisler et al. 1985),
defined as
where is the observed radial component of the velocity of the galaxy
with respect to the systemic cluster velocity, and is its projected separation
from the cluster center.
The numerical factor 32 assumes that galaxy orbits are isotropic.
In case of purely radial or purely
circular orbits this factor becomes 64 or 16 respectively.
Mass estimates obtained using the two above methods and their uncertainties are
listed in Table 5.
We remark that these mass estimates are probably biased
by the dynamical state of Abell 1367, which appears far from virialization.
In particular the presence of substructures leads to an overestimate of the
cluster mean harmonic radius and velocity dispersion, and thus of the
virial mass (Pinkney et al. 1996).
For this reason the mass derived for the whole cluster and
for the SE and NW subclusters separately is probably overestimated.
Assuming that the early type sample represents the virialized cluster population
(see previous section), we also derive mass estimates for the three dynamical units using
the non star forming systems only.
For all the studied samples the viral mass estimates are affected
by smaller uncertainties and yield smaller values than the projected
mass estimates.
This can be due to the contamination by interlopers
(Heisler et al. 1985) or, more probably, to the assumption of isotropic orbits.
Indeed assuming purely radial or circular orbits the mass estimate varies by a factor of 2, becoming consistent
with the virial mass.
The mass inferred from the non-star forming population are, as expected, systematically
lower than the ones obtained from all types.
The value obtained for the whole sample is consistent with the mass estimates
available in the literature ( Girardi et al. 1998;
,
Rines et al. 2003).
8 Two-Body Analysis
In this section we investigate whether the two clouds A1367NW, A1367SE and the three groups infalling into the SE and NW subclusters form gravitationally bound systems. For each system we apply the two-body analysis described by Beers et al. (1991). The two subclumps are treated as point masses moving on radial orbits. They are assumed to start their evolution at time t=0 with zero separation, and are moving apart or coming together for the first time in their history. For bound radial orbits, the parametric solutions to the equations of motion are:
where is the components separation at time , and is their relative velocity. is the separation of the subclusters at maximum expansion and is the total mass of the system. Similarly, the parametric solutions for the unbound case are:
where is the asymptotic expansion velocity.
The system parameters and are related to the observables
(the LOS relative velocity) and (the projected separation)
by:
where
is the angle between the plane of the sky and the line joining the centers of the two
components.
The two systems are thus closed
by setting the present time
to Gyr (the age of the Universe in a =0.3 and =0.7 cosmology)
and solved iteratively to determine the projection angle
as a function of .
We determine two solutions for each two-body model, assuming two extreme values
for the total mass of each system ranging from the virial mass
of the non-star forming population to the virial mass of the whole cluster.
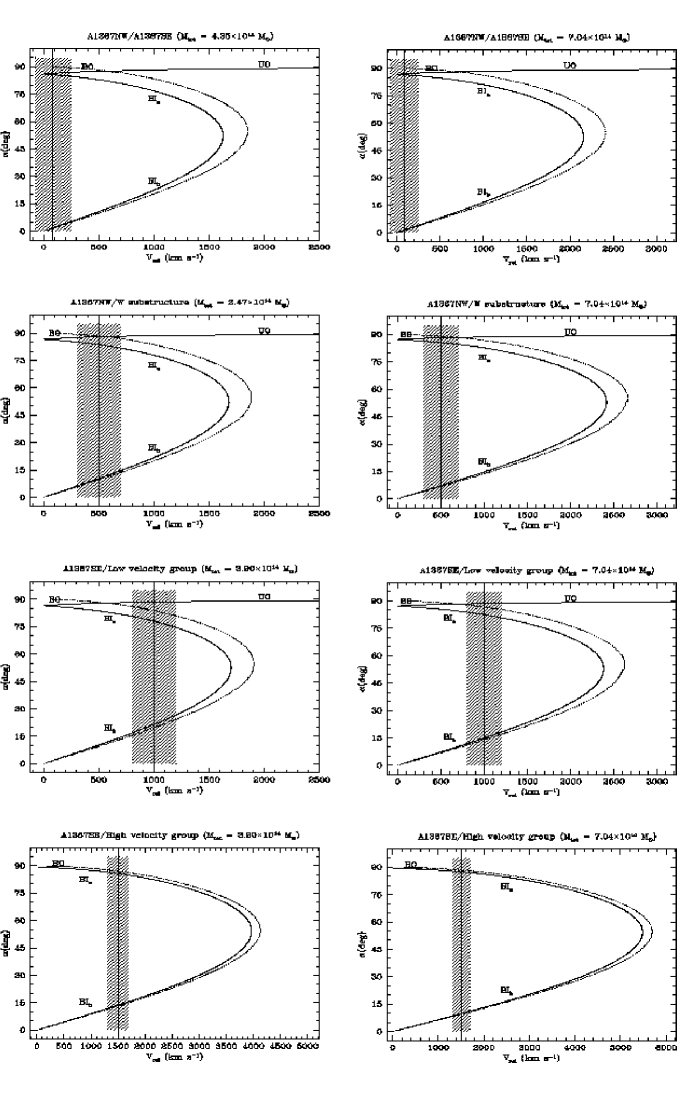
Table 6 summarizes the adopted parameters of the two-body analysis, and
Fig. 13 shows the computed solutions in the () plane.
The vertical lines represent the observed values of and
the dashed regions their associated uncertainties.
The solutions have three different regimes:
an unbound-outgoing regime (UO), a bound-outgoing regime (BO) and a bound-ingoing regime (BI).
It is easy to show
that the unbound solutions will lie in the region of the () plane where:
The dotted lines in Fig. 13 show the dividing line between bound and unbound
regions.
In the BO regime, the two subclumps are still separating and have not yet reached
the maximum expansion.
The BI regime describes the system after maximum
expansion.
For each , there are two corresponding values of , a large
and a small one. The large value assumes that the substructures are far apart,
with low relative velocity, while the small value implies that the subclusters are close together
near the plane of the sky (see Fig. 7 in Beers et al. 1991).
Thus we split the BI regime into two branches, called and .
The probability of each solution, computed following the procedure described by
Beers et al. (1991), is given in Table 6.
Our result is that the A1367NW/SE and the A1367SE/High Velocity group
systems are bound with 100% probability and presently infalling
with 96% and 100% probability respectively.
The A1367NW/W and the A1367SE/Low Velocity group systems are bound at 99%
and 96% probability respectively.
We conclude that all systems constituting Abell 1367 are gravitationally bound at 96% probability.
|
||||||||||||||||||||||||||||||||||||||||||||||||||||||||||||||||||||||||||||||||||||||||||
9 Conclusions
We present a dynamical analysis of the central 1.3 square degrees of the
galaxy cluster Abell 1367, based on 273 redshift of which 119 are new measurements.
The LOS velocity distribution of the 146 cluster members
is significantly non Gaussian, suggesting
that the cluster is dynamically young.
The member galaxies show an elongated distribution along
the NW-SE direction with two major density peaks,
consistent with the X-ray morphology.
The strong difference in the LOS velocity and velocity dispersion
of the two density peaks, the abrupt gas temperature
gradient detected in X-rays and the 3D statistical tests
support a merging scenario involving at least two subclusters.
Moreover the dynamical properties of the NW and SE clouds suggest
an even more complex picture, summarized in Fig. 6.
At least another group of star forming galaxies (the high velocity group) infalling into the cluster core is
detected, suggesting a multiple merging event.
Furthermore our analysis suggests the presence of two
other groups infalling into the cluster center.
In the North-West part of Abell 1367 a group of galaxies (W subcluster),
associated with the infalling galaxies 97-073/79
and with the radio relic observed in this region,
is probably merging with the relaxed core of the NW subcluster.
In the South part another group (the low velocity group) is infalling from the eastern side
into the disturbed core of the SE subcluster.
These three subgroups have a higher fraction of star forming galaxies
than the cluster core, as expected during the
early phase of merging events.
The multiple merging scenario is consistent with the location of Abell 1367
being at the intersection of two filaments, the first extending
roughly 100 Mpc from Abell 1367 toward Virgo (West & Blakeslee 2000) and the second extending between
Abell 1367 and Coma (as a part of the Great Wall, Zabludoff et al. 1993).
As predicted by Katz & White (1993) this is the natural place for Abell 1367
to evolve into a rich relaxed cluster.
Acknowledgements.
We thank the referee, R. Hank Donnelly, for his useful comments which helped us to improve and strengthen the paper. We thank Paolo Franzetti for his help during the preparation of the AF2-WYFFOS configurations and Timothy Beers for kindly providing the program ROSTAT. The TACS of the William Herschel, Loiano and Cananea telescopes are acknowledged for the generous time allocation to this project. This work could not be completed without the NASA/IPAC Extragalactic Database (NED) which is operated by the Jet Propulsion Laboratory, Caltech under contract with NASA. This research has made use of the GOLD Mine Database, operated by the Universitá degli Studi di Milano-Bicocca.References
- Bechtold et al. (1983) Bechtold, J., Forman, W., Jones, C., et al. 1983, ApJ, 265, 26
- Beers et al. (1990) Beers, T. C., Flynn, K., & Gebhardt, K. 1990, AJ, 100, 32
- Beers et al. (1991) Beers, T. C., Gebhardt, K., Forman, W., Huchra, J. P., & Jones, C. 1991, AJ, 102, 1581
- Bekki (1999) Bekki, K. 1999, ApJ, 510, L15
- Bird (1994) Bird, C. M. 1994, AJ, 107, 1637
- Bird & Beers (1993) Bird, C. M. & Beers, T. C. 1993, AJ, 105, 1596
- Bliton et al. (1998) Bliton, M., Rizza, E., Burns, J. O., Owen, F. N., & Ledlow, M. J. 1998, MNRAS, 301, 609
- Churazov et al. (2003) Churazov, E., Forman, W., Jones, C., & Böhringer, H. 2003, ApJ, 590, 225
- Cortese et al. (2003) Cortese, L., Gavazzi, G., Iglesias-Paramo, J., Boselli, A., & Carrasco, L. 2003, A&A, 401, 471
- Dickey & Gavazzi (1991) Dickey, J. M. & Gavazzi, G. 1991, ApJ, 373, 347
- Donnelly et al. (1998) Donnelly, R. H., Markevitch, M., Forman, W., et al. 1998, ApJ, 500, 138
- Dressler & Shectman (1988) Dressler, A. & Shectman, S. A. 1988, AJ, 95, 985
- Enßlin et al. (1998) Enßlin, T. A., Biermann, P. L., Klein, U., & Kohle, S. 1998, A&A, 332, 395
- Enßlin & Brüggen (2002) Enßlin, T. A. & Brüggen, M. 2002, MNRAS, 331, 1011
- Forman et al. (2003) Forman, W., Churazov, E., David, L., et al. 2003, astro-ph/0301476
- Gavazzi (1978) Gavazzi, G. 1978, A&A, 69, 355
- Gavazzi et al. (2003a) Gavazzi, G., Boselli, A., Donati, A., Franzetti, P., & Scodeggio, M. 2003a, A&A, 400, 451
- Gavazzi et al. (2001) Gavazzi, G., Boselli, A., Mayer, L., et al. 2001, ApJ, 563, L23
- Gavazzi et al. (1999) Gavazzi, G., Carrasco, L., & Galli, R. 1999, A&AS, 136, 227
- Gavazzi et al. (1995) Gavazzi, G., Contursi, A., Carrasco, L., et al. 1995, A&A, 304, 325
- Gavazzi et al. (2003b) Gavazzi, G., Cortese, L., Boselli, A., et al. 2003b, ApJ, 597, 210
- Gavazzi & Jaffe (1987) Gavazzi, G. & Jaffe, W. 1987, A&A, 186, L1
- Gavazzi et al. (1981) Gavazzi, G., Perola, G. C., & Jaffe, W. 1981, A&A, 103, 35
- Gavazzi & Trinchieri (1983) Gavazzi, G. & Trinchieri, G. 1983, ApJ, 270, 410
- Girardi et al. (1998) Girardi, M., Giuricin, G., Mardirossian, F., Mezzetti, M., & Boschin, W. 1998, ApJ, 505, 74
- Gomez et al. (2002) Gomez, P. L., Loken, C., Roettiger, K., & Burns, J. O. 2002, ApJ, 569, 122
- Grebenev et al. (1995) Grebenev, S. A., Forman, W., Jones, C., & Murray, S. 1995, ApJ, 445, 607
- Gunn & Gott (1972) Gunn, J. E. & Gott, J. R. I. 1972, ApJ, 176, 1
- Heisler et al. (1985) Heisler, J., Tremaine, S., & Bahcall, J. N. 1985, ApJ, 298, 8
- Iglesias-Páramo et al. (2002) Iglesias-Páramo, J., Boselli, A., Cortese, L., Vílchez, J. M., & Gavazzi, G. 2002, A&A, 384, 383
- Iglesias-Páramo et al. (2003) Iglesias-Páramo, J., Boselli, A., Gavazzi, G., Cortese, L., & Vílchez, J. M. 2003, A&A, 397, 421
- Jones et al. (1979) Jones, C., Mandel, E., Schwarz, J., et al. 1979, ApJ, 234, L21
- Katz & White (1993) Katz, N. & White, S. D. M. 1993, ApJ, 412, 455
- Pinkney et al. (1996) Pinkney, J., Roettiger, K., Burns, J. O., & Bird, C. M. 1996, ApJS, 104, 1
- Rines et al. (2003) Rines, K., Geller, M. J., Kurtz, M. J., & Diaferio, A. 2003, AJ, 126, 2152
- Sakai et al. (2002) Sakai, S., Kennicutt, R. C., van der Hulst, J. M., & Moss, C. 2002, ApJ, 578, 842
- Schindler & Mueller (1993) Schindler, S. & Mueller, E. 1993, A&A, 272, 137
- Struble & Rood (1999) Struble, M. F. & Rood, H. J. 1999, ApJS, 125, 35
- Sun & Murray (2002) Sun, M. & Murray, S. S. 2002, ApJ, 576, 708
- Tonry & Davis (1979) Tonry, J. & Davis, M. 1979, AJ, 84, 1511
- West & Blakeslee (2000) West, M. J. & Blakeslee, J. P. 2000, ApJ, 543, L27
- West & Bothun (1990) West, M. J. & Bothun, G. D. 1990, ApJ, 350, 36
- West et al. (1991) West, M. J., Villumsen, J. V., & Dekel, A. 1991, ApJ, 369, 287
- Yahil & Vidal (1977) Yahil, A. & Vidal, N. V. 1977, ApJ, 214, 347
- Zabludoff et al. (1993) Zabludoff, A. I., Geller, M. J., Huchra, J. P., & Ramella, M. 1993, AJ, 106, 1301
- Zwicky et al. (1961-1968) Zwicky, F., Herzog, E., & Wild, P. 1961-1968, in Catalogue of Galaxies and of Clusters of Galaxies”, California Institute of Technology
|