Spitzer Space Telescope Spectroscopy of Ices toward Low Mass Embedded Protostars111Some of the data presented herein were obtained at the W.M. Keck Observatory, which is operated as a scientific partnership among the California Institute of Technology, the University of California and the National Aeronautics and Space Administration. The Observatory was made possible by the generous financial support of the W.M. Keck Foundation.222The VLT/ISAAC spectra were obtained at the European Southern Observatory, Paranal, Chile, within the observing program 272.C-5008
Abstract
Sensitive 5-38 Spitzer Space Telescope (SST) and ground based 3-5 spectra of the embedded low mass protostars B5 IRS1 and HH46 IRS show deep ice absorption bands superposed on steeply rising mid-infrared continua. The ices likely originate in the circumstellar envelopes. The CO2 bending mode at 15 is a particularly powerful tracer of the ice composition and processing history. Toward these protostars, this band shows little evidence for thermal processing at temperatures above 50 K. Signatures of lower temperature processing are present in the CO and OCN- bands, however. The observed CO2 profile indicates an intimate mixture with H2O, but not necessarily with CH3OH, in contrast to some high mass protostars. This is consistent with the low CH3OH abundance derived from the ground based L band spectra. The CO2/H2O column density ratios are high in both B5 IRS1 and HH46 IRS (%). Clearly, the SST spectra are essential to study ice evolution in low mass protostellar environments, and to eventually determine the relation between interstellar and solar system ices.
Subject headings:
Infrared: ISM—ISM: molecules—ISM: abundances—stars: formation—stars: individual (B5 IRS1)—astrochemistry1. Introduction
A recurring question in disk, planet and comet formation studies is how the composition of molecular material evolves as it flows from the molecular cloud to the protostellar envelope and protoplanetary disk. Much of the material in these environments is frozen on grains. A plethora of processes, including heating by stellar photons, shocks related to accretion or outflow, cosmic ray hits, and ultraviolet irradiation can change the ice structure and composition. The spectroscopic effects of these processes can be observed in the vibrational bands of the ices through infrared spectroscopy. Ices around high mass protostars have been extensively studied this way. Infrared Space Observatory (ISO) spectra have shown that in particular the ice structure is affected by heating from the central star. The simplicity of the ice composition does indicate that the formation of new species through ultraviolet irradiation or cosmic ray hits occurs at a low level at best. Observations of ices around low mass protostars have been limited due to the unavailability of much of the 5-20 spectral region, where many of the molecular bending mode transitions occur. In particular the CO2 bending mode at 15 is a valuable tracer of ice structure and composition (Ehrenfreund et al. 1998; Gerakines et al. 1999). With the sensitive Infrared Spectrometer (IRS; Houck et al. 2004) on board of the Spitzer Space Telescope (SST; Werner et al. 2004) this band can now be observed for the first time at high quality in low mass systems.

Observation of two protostars are presented in this paper. B5 IRS1 (IRAS 03445+3242; Beichman et al. 1984; 10 L⊙) is well studied at infrared and millimeter wavelengths (e.g. Charnley et al. 1990; Langer et al. 1996). The millimeter continuum emission is resolved on a few arcsec scale, and may originate in an inclined disk. The outflow has received most of the attention, and has a large opening angle leading to significant outflow/infall interaction. HH46 IRS (IRAS 08242-5050; L⊙) is also deeply embedded, and is also the driving source of a powerful outflow. SST imaging and spectroscopic observations of this source, focused on the outflow, are presented in Noriega-Crespo et al. (2004).
2. Observations
B5 IRS1 and HH46 IRS were observed with SST/IRS as part of the ‘c2d’ Spitzer Legacy program (Evans et al. 2003) in the modules Short Low (SL; ; R=64-128), Short High (SH; ; R=600) and Long High (LH; ; R=600). The archival AOR keys are 0005638912 (HH46 IRS) and 0005635328 (B5 IRS1) for PROGID 172. Both sources are well centered in all slits. The integration time was 28 seconds per module per source at 14 second ramps, except for SH which has 24 seconds in total and 6 second ramps. The spectra were reduced with the IRS pipeline version 9.5 on 10 March 2004 at the SSC. Bad pixels were interpolated in the spectral domain in the 2D images before extracting 1D spectra. Accurate wavelength calibration was assured using calibration tables available in May 2004. For overlapping SH spectral orders, the poorly calibrated long wavelength part of each order was removed. This is particularly important to obtain a reliable profile of the CO2 ice band at 15.2 , where two orders overlap. HH46 IRS was observed independently as an Early Release Observation (AOR key 0007130112 and PROGID 1063; Noriega-Crespo et al. 2004). The datasets are in good agreement, and were averaged. Finally, complementary ground based observations were obtained. B5 IRS1 was observed with Keck/NIRSPEC (McLean et al., 1998) at R=25000 in the M band and at R=2000 in the L band. VLT/ISAAC (Moorwood et al., 1999) L and M band spectra of HH46 IRS were obtained at R=600 and 5000 respectively. The SST and ground based spectra were combined by scaling the ground based data.
3. Results
The combined SST and ground based 3–38 spectra of B5 IRS1 and HH46 IRS show steeply rising continua (Fig. 1). The continuum of HH46 IRS is the steepest, with a 35 /4 flux ratio of 100, compared to 10 for B5 IRS1. Numerous silicate and ice absorption features are superposed. The main ice constituents are H2O, CO2, and CO. The well known, yet unidentified, 3.47 and 6.85 bands are present in both sources as well. Rarely seen before is a shallow absorption feature at 11.2 in both sources. It may be related to refractory dust components, such as crystalline forsterite (Kessler et al., 2004). In addition, HH46 IRS, but not B5 IRS1, shows absorption by CH4 and ‘XCN’ (likely OCN-; van Broekhuizen et al. 2004). Finally, other ice features may be present in the 5-10 region (NH3, HCOOH), but a dedicated analysis is required to verify their reality. We focus on the band profiles and abundances of the main ice components and their relation to the 15 CO2 bands, newly discovered with the SST.
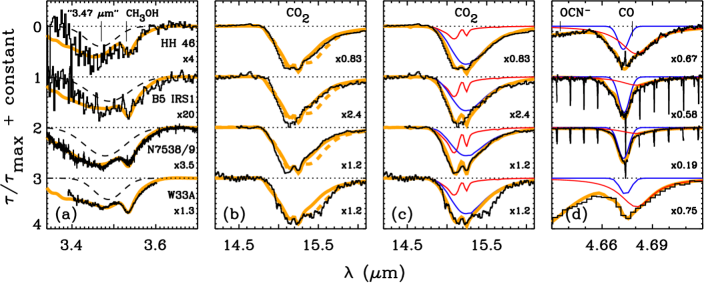
The CO2 bending mode has rarely been observed toward low mass protostars, and never at such high quality. It is blended with the short wavelength wing of the silicate bending mode. The CO2 band is put on an optical depth scale, assuming the ‘intrinsic’ profile of the silicate band is represented by the Galactic Center source GC3 (Chiar et al. 2000). For this a third order polynomial is fitted to the wavelength regions 13.0–14.7 and 26.3-33.3 . The resulting CO2 bands look similar to those observed in other lines of sight; note in particular the presence of a long wavelength wing extending to at least 16 (Gerakines et al. 1999). Similar to the massive protostar NGC 7538 IRS9 (Fig. 2b), weak double ice crystallization peaks are observed at the bottom of the band in HH46 IRS, but not in B5 IRS1. Neither B5 IRS1 nor HH46 IRS show evidence for a third peak at 15.38 , expected in CH3OH:CO2 complex formation.
To place the interpretation of the CO2 band within a larger perspective, ground based observations of the 3.53 CH3OH band and the 4.67 band of solid CO are analyzed. The 3.53 band is superposed on the wing of the strong 3.07 H2O band and is locally blended with the unidentified 3.47 band. Following Brooke et al. (1999), we derive the continuum and separate the CH3OH contribution. For comparison, spectra of the massive protostars W33A (Brooke et al. 1999) and NGC 7538 IRS9 (Boogert et al. 2004) are analyzed as well. Hints of CH3OH are seen in both HH46 IRS and B5 IRS1, resulting in column densities of 7% with respect to H2O, comparable to NGC 7538 IRS9, but much less compared to W33A. For HH46 IRS the detection of CH3OH is strengthened by the presence of a feature at 9.7 in the bottom of the silicate band (Fig. 1). Both HH46 IRS and B5 IRS1 show prominent bands of solid CO at 4.67 (Fig. 2d). The ratio between the central narrow CO component and the broad long wavelength wing, representing the column density ratio of volatile pure CO and CO mixed with less volatile H2O, is a factor of five smaller in HH46 IRS. In fact, the profile of HH46 IRS is comparable to that of the massive protostar W33A. The latter two sources also show a band at 4.62 , most likely attributed to the OCN- ion. Relative to H2O, the OCN- column density is comparable to (upper limits to) those of B5 IRS1 and NGC7538 IRS9. Furthermore, the 4.67 spectrum of B5 IRS1 shows deep ro-vibrational gas phase CO lines. The presence of gas phase CO in HH46 IRS is hard to assess because of telluric contamination. The intriguing differences and similarities between HH46 IRS and B5 IRS1, as well as compared to massive protostars, provide insight into the formation and evolution of interstellar and circum-protostellar ices.
Finally, column densities of the main ices, summarized in Table 1, are derived by dividing the integrated optical depth over the laboratory integrated band strength (e.g. Hudgins et al. 1993). Note that the CO2/H2O ratios toward B5 IRS1 and HH46 IRS are significantly larger compared to the average over many, mostly massive protostellar sightlines (0.170.03; Gerakines et al. 1999).
4. Discussion
4.1. Evolution of Ices in Low Mass Environments
The formation and evolution of interstellar ices is, in principle, strongly dependent on local conditions such as the atomic hydrogen and carbon density, the temperature, the cosmic ray flux, the ultraviolet photon flux, and the presence of shocks. Thus, key issues are the location of the ices along the absorption line of sight and the relative contributions from foreground clouds, envelopes, and inclined disks. The continuous rise of both the B5 IRS1 and HH46 IRS SEDs between 3 and 40 , as well as the detection of extended submillimeter emission in JCMT archive images, are in favor of envelope-dominated models. We established the properties of these envelopes using the approach of Jørgensen et al. (2002). Adopting optical constants for bare and ice coated silicate grains (Ossenkopf & Henning 1994) the 2-2000 SED and the depth of the observed superposed ice and silicate bands were self-consistently modeled. The SED and silicate band depth of B5 IRS1 are well fitted by the envelope models, and a significant fraction of the ices has evaporated. In contrast to B5 IRS1, the submillimeter/far-infrared and mid-infrared SST SED of HH46 IRS cannot be simultaneously fitted. Possibly, this envelope is embedded in a larger scale, cold cloud not modeled within the framework of the simple spherical envelope.
| Quantity | B5 IRS1 | HH46 | N7538/9e | W33Af |
|---|---|---|---|---|
| (CO2)/(H2O) | 0.37 | 0.32 | 0.24 | 0.16 |
| (CO-p)/(H2O)a | 0.16 | 0.15 | 0.02 | 0.08 |
| (CO-np)/(H2O)b | 0.27 | 0.05 | 0.14 | 0.03 |
| (CH3OH)/(H2O) | 0.06 | 0.07 | 0.07 | 0.22 |
| (OCN-)/(H2O)c | 0.007 | 0.006 | 0.02 | |
| (H2O) [1018 ] | 2.2 (0.3) | 8.0 | 6.8 | 9.0 |
| (H2O)/ [10-5] | 5.2 | 5.7 | 5.0 | 3.2 |
| [1022] | 4d | 14d | 16 | 28 |
| a broad ‘polar’ CO component, likely H2O mixture | ||||
| b broad ‘apolar’ CO component, likely pure CO | ||||
| c using OCN- band strength of van Broekhuizen et al. 2004 | ||||
| d from the envelope models described in the text | ||||
| e Whittet et al. 1996 and references therein | ||||
| f Gibb et al. 2000 and references therein | ||||
Next we address the extent to which the ices in these envelopes have been processed. Several indicators are available. Laboratory experiments have shown that heating of ice mixtures with concentrations CO2/H2O results in crystallization and an effective segregation of the CO2 and H2O species. Spectroscopically this is recognized as double peaked profiles, characteristic of the pure CO2 matrix (Ehrenfreund et al. 1998). Depending on the ice composition, the amorphous to crystalline phase transition occurs at 50-90 K in space, lower than the corresponding laboratory temperatures due to the longer interstellar time scales (Boogert et al. 2000). Substructures are seen in the HH46 IRS CO2 band (Fig. 2b), but are much weaker compared to some highly heated massive protostellar envelopes (Gerakines et al. 1999), and are absent in B5 IRS1. In fact, the CO2 band profile of HH46 IRS is comparable to that observed toward one of the least processed envelopes, surrounding the massive protostar NGC 7538 IRS9. In the simplest scenario of a single ice at one temperature, the mixture CH3OH:H2O:CO2=0.3:1:1 (§4.2) must still have a laboratory temperature as high as 115 K, or 75 K in space (Fig. 2b). In the more likely scenario of a temperature gradient along the line of sight, the bulk of the HH46 IRS and B5 IRS1 envelopes have temperatures well below 50 K. A fraction of the inner envelope of HH46 IRS must be warmer, causing the observed weak substructures. Such two component fits explain the observed profiles well (Fig. 2c).
More extensive processing at lower temperatures most likely has occurred within the envelopes, however. Unlike the massive protostar NGC 7538 IRS9, the ground based 4.67 spectra of solid CO toward HH46 IRS and B5 IRS1 show a weak central narrow component (Fig. 2d; Table 1). The most volatile CO–rich ‘apolar’ ices may thus have evaporated (Tielens et al. 1991). HH46 IRS shows a particularly broad profile, resembling the massive protostar W33A. Like W33A, HH46 IRS shows an absorption feature at 4.62 , likely attributed to the OCN- species. This molecule may be produced from HNCO in the solid state at relatively low ice temperatures 50 K (van Broekhuizen et al. 2004).
Concluding, while high temperature ice processing, traced by the CO2 band, is not observed in the low mass envelopes, low temperature ( K) processing may play a significant role. Qualitatively this is similar to some high mass protostars (W33 A, NGC7538 IRS9). The proposed evolutionary sequence of ice processing in massive envelopes (Boogert et al. 2000; van der Tak et al. 2000) is indeed largely based on high temperature indicators, such as ice crystallization, hot core gas temperatures and gas/solid state ratios. These relations need to be investigated in a larger sample of low mass protostars, in which the CO2 band profile is a crucial tracer.
4.2. CH3OH:CO2 Complexes
The long wavelength wing of the CO2 bending mode may be a tracer of the presence of CH3OH in the ices. CO2 and CH3OH form complexes, leading to an enhanced wing in some sources well fitted by laboratory ices with a CH3OH:H2O:CO2 mixing ratio of 1:1:1 (e.g. W33A in Fig. 2b). Recently, large abundances of CH3OH of 25% with respect to H2O were found in the envelopes of some low mass protostars (Pontoppidan et al. 2003). Clearly, B5 IRS1 and HH46 IRS both have lower CH3OH abundances (Table 1). This is consistent with the weakness of the long wavelength CO2 wing. Indeed, laboratory mixtures with a CH3OH:H2O:CO2 ratio of 0.3:1:1 fit the observed band well. The high CO2/CH3OH column density ratio of 6 toward these sources is however barely consistent with this laboratory mixture. Alternatively, the band profile can be explained by the combination of an abundant H2O–rich ice responsible for the long wavelength wing, and an at least partly heated CO2-rich ice responsible for the crystallization substructures seen in HH46 IRS (Fig. 2c).
5. Conclusions and Future Work
High quality SST observations of the CO2 bending mode at 15 toward low mass protostars offer a new tracer of ice mantle composition and evolution. The embedded low mass systems B5 IRS1 and HH46 IRS show CH3OH-poor ices with little evidence for 50-90 K thermal processing in their envelopes. Lower temperature processing appears evident in the solid CO band. These results form the basis for future studies on the physical and chemical state of ices entering protoplanetary disks, and how these and solar system ices are related. CO2 bending mode observations of more evolved systems and edge-on disks are required.
References
- Beichman et al. (1984) Beichman, C. A., et al. 1984, ApJ, 278, L45
- Boogert et al. (2000) Boogert, A. C. A., et al. 2000, A&A, 353, 349
- Boogert et al. (2004) Boogert, A. C. A., Blake, G. A., & Öberg, K. 2004, ApJ, subm.
- Brooke et al. (1999) Brooke, T. Y., Sellgren, K., & Geballe, T. R. 1999, ApJ, 517, 883
- Charnley et al. (1990) Charnley, S. B., Whittet, D. C. B., & Williams, D. A. 1990, MNRAS, 245, 161
- Chiar et al. (2000) Chiar, J. E., et al. 2000, ApJ, 537, 749
- Ehrenfreund et al. (1998) Ehrenfreund, P., Dartois, E., Demyk, K., & D’Hendecourt, L. 1998, A&A, 339, L17
- Evans et al. (2003) Evans, N. J., et al. 2003, PASP, 115, 965
- Gerakines et al. (1999) Gerakines, P. A., et al. 1999, ApJ, 522, 357
- Gibb et al. (2000) Gibb, E. L., et al. 2000, ApJ, 536, 347
- Houck et al. (2004) Houck, J. R., et al. 2004, ApJS, this volume
- Hudgins et al. (1993) Hudgins, D. M., Sandford, S. A., Allamandola, L. J., & Tielens, A. G. G. M. 1993, ApJS, 86, 713
- Jørgensen et al. (2002) Jørgensen, J. K., Schöier, F. L., & van Dishoeck, E. F. 2002, A&A, 389, 908
- Kessler et al. (2004) Kessler, J. E., Hillenbrand, L. A., Blake, G. A., & Meyer, M. R. 2004, ApJ, in press
- Langer et al. (1996) Langer, W. D., Velusamy, T., & Xie, T. 1996, ApJ, 468, L41
- McLean et al. (1998) McLean, I.S., Becklin, E.E., Bendiksen, O., Brims, G., & Canfield, J. 1998, Proc. SPIE, 3354, 566
- Moorwood et al. (1999) Moorwood, A., et al. 1999, The Messenger, 95, 1
- Noriega-Crespo et al. (2004) Noriega-Crespo, A., et al. 2004, ApJS, this volume
- Ossenkopf & Henning (1994) Ossenkopf, V. & Henning, T., 1994, A&A, 291, 943
- Pontoppidan et al. (2003) Pontoppidan, K. M., Dartois, E., van Dishoeck, E. F., Thi, W.-F., & d’Hendecourt, L. 2003, A&A, 404, L17
- Tielens et al. (1991) Tielens, A. G. G. M., Tokunaga, A. T., Geballe, T. R., & Baas, F. 1991, ApJ, 381, 181
- van Broekhuizen et al. (2004) van Broekhuizen, F. A., Keane, J. V., & Schutte, W. A. 2004, A&A, 415, 425
- van der Tak et al. (2000) van der Tak, F. F. S., van Dishoeck, E. F., Evans, N. J., & Blake, G. A. 2000, ApJ, 537, 283
- Werner et al. (2004) Werner, M. W., et al. 2004, ApJS, this volume
- Whittet et al. (1996) Whittet, D. C. B., et al. 1996, A&A, 315, L357