The Mass Function of the Stellar Component of Galaxies in the Sloan Digital Sky Survey
Abstract
Using the MOPED algorithm we determine non-parametrically the Stellar Mass Function of 96,545 galaxies from the Sloan Digital Sky Survey data release one. By using the reconstructed spectrum due to starlight we can eliminate contamination from either emission lines or AGN components. Our results give excellent agreement with previous works, but extend their range by more than two decades in mass to . We present both a standard Schechter fit and a fit modified to include an extra, high-mass contribution, possibly from cluster cD galaxies. The Schechter fit parameters are , and . Our sample also yields an estimate for the contribution from baryons in stars to the critical density of , in good agreement with other indicators. Error bars are statistical and a Salpeter IMF is assumed throughout. We find no evolution of the mass function in the redshift range indicating that almost all stars were already formed at with little or no star formation activity since then and that the evolution seen in the luminosity function must be largely due to stellar fading.
keywords:
galaxies: luminosity function, mass function – galaxies: evolution – galaxies: formation parameters – galaxies: statistics – galaxies: stellar content – cosmology: cosmological parameters1 Introduction
Recent advances in galaxy modelling codes mean that we are on the verge of being able to predict reliably the mass function of stellar component of galaxies in the Universe. To match this modelling we require a good observational determination from a large sample of galaxies. This has been attempted in the past by combining the Two Micron All Sky Survey (2MASS) with the 2dF Galaxy Redshift Survey (2dF GRS) by Cole et al. (2001) and the Sloan Digital Sky Survey (SDSS) Early Data Release (EDR) by Bell et al. (2003). Both these methods used the K-band magnitudes of galaxies in the 2MASS survey to estimate the mass of their respective redshift survey galaxies.
Unfortunately neither of the redshift surveys can be used to their full depth when combined with the 2MASS survey - it does not go deep enough. The Sloan Digital Sky Survey (SDSS) Data Release One (DR1, Abazajian et al. (2002), Strauss et al. (2002)) gives a larger sample of galaxies (of the order 100,000 spectra) and it would be advantageous to be able to form a mass function from all of these galaxies. Obviously, just using the optical magnitudes from these surveys is insufficient to yield stellar mass, as some account must be taken of AGN component, dust component, hot gas and the evolution of stellar population. It would be highly unsatisfactory to estimate a blanket correction for these components, and hence an independent determination of the stellar mass is required for each individual galaxy in the survey.
With the advent of efficient spectral fitting algorithms it is possible to extract and model the stellar populations of galaxies, and reliably exclude the contribution to the spectrum of emission lines, dust and AGN. The stellar component of the mass of the galaxy can then be calculated, and when applied to a large enough survey of galaxies be used to calculate the mass function of the stellar component.
2 Deriving Stellar Masses with MOPED
2.1 MOPED
The MOPED technique (Heavens et al. (2000), Reichardt et al. (2001), Panter et al. (2003), Heavens et al. (2004)) was used to extract the Star Formation History (SFH) of the galaxies contained in the SDSS Main Galaxy catalogue (Shen et al. (2003)). The technique is examined in detail in previous papers, and is equivalent to fitting synthetic stellar population spectra to each galaxy spectrum using a novel data compression and analysis algorithm. The main emission-line regions are excluded. Masses were calculated for a complete sample inside a redshift range of with R band apparent magnitudes . Following the suggestion of Shen et al. (2003) we have also set a surface brightness limit of . Throughout we assume the concordant WMAP cosmology, , , , (Spergel et al. (2003)).
2.2 Mass extraction
MOPED extracts the star formation and metalicity history of a galaxy along with its dust content. The star formation history of each galaxy is modelled by 23 numbers: the star formation fraction in each of 11 time periods, largely spaced equally in log(lookback time); 11 associated metallicities of the star-forming gas; a simple dust screen characterised by an LMC extinction curve (Gordon et al. (2003)) and a single dust parameter. By combining this information with the input stellar model spectra we can create a synthetic spectrum of the stellar component of the galaxy spectrum. MOPED adjusts the 23 parameters until the best match with 23 numbers derived from the galaxy spectrum is found. These parameters, combined with an overall normalisation of the galaxy spectrum, allow the integrated mass created in stars to be estimated.
Following Cole et al. (2001) to account for the mass of stars lost through winds and supernovae we use the recycling fraction derived from stellar evolution theory. The final stellar mass of the galaxy is then times the integrated mass of the different fitted populations totalled over the bins.
The masses recovered by this method are dependent on choice of IMF. We have chosen a Salpeter IMF to allow direct comparison with theory and other predictions. Since we are using a Salpeter IMF with a low mass cut off at M⊙ we are insensitive to any mass included in brown dwarfs.
To turn the measurements of mass to a mass density we weight each galaxy by , where is the maximum volume in which a given galaxy would still be included within the limits of the survey. In the past these have been calculated by assuming some luminosity evolution and calculating a K-correction from reference spectra. Since we have knowledge of the star formation history of every galaxy in the SDSS we can evolve the luminosity and surface brightness history of each galaxy rather than assume a fixed evolution. To evolve the surface brightness of the galaxy we assume that over the redshift range studied there has been no size change of the galaxy. The mass estimator should be unbiased; in principle it is sensitive to clustering, but the effective volumes probed are large enough that this should be a small effect.
To account for the three-arcsec fibre diameter we scale our masses up by the ratio of the flux from the photometric band petrosian magnitudes to that from the spectroscopically determined fibre magnitudes. This is unlikely to succeed for individual galaxies, but there is evidence from the Petrosian and fibre colours that there is no systematic offset caused overall (Glazebrook et al. (2003)). We also find that, for galaxies of about the same mass, the intermediate results such as star formation fraction show no signs of a trend with galaxy redshift, which one would expect if there were a significant systematic error arising from aperture effects (Jimenez et al. (2004)).
To calculate the statistical errors on our mass function we applied a bootstrap error algorithm. The binning operation was performed with 1000 randomly-selected resamples of the original data set, and the standard deviations of the heights of each peak recovered.
3 Results
3.1 Galaxy Stellar Mass Function
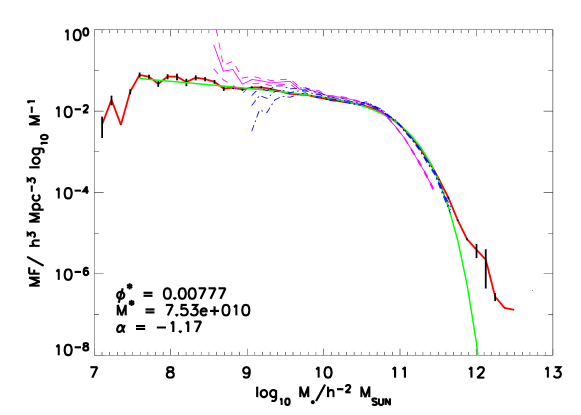
The stellar mass function is shown in Fig. 1. Between about and we find excellent agreement with results obtained by previous studies of SDSS and 2dFGRS galaxies (Bell et al. (2003) and Cole et al. (2001)), where the stellar mass is estimated more simply from infrared data. We are able to extend the mass range considerably, by around a decade in mass at the upper mass end, and about two decades at the lower-mass end. The stellar mass function of SDSS galaxies is now accurately determined between and , where is the Hubble parameter in units of .
We fit the galaxy stellar mass function with a Schechter function (Schechter (1976))
| (1) |
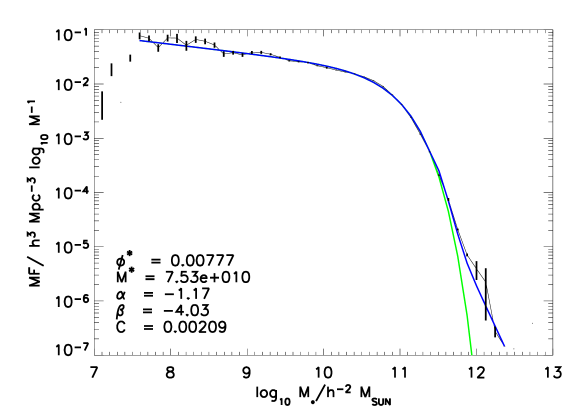
with best-fitting parameters , and . This fit is shown overplotted in Fig.2, and is a good fit up to .
There is evidence for an excess over the Schechter fit at the high-mass end (which seems to be confirmed from dynamical measurements of the mass of SDDS galaxies, Bernardi et al. private communication), which can be well modelled by the addition of a power law over the range of the form
| (2) |
with and as shown in Figure 2. This excess could be due to cD galaxies or a failure of the modelled correction to total magnitudes for these extremely large galaxies.
3.2 Evolution with Redshift
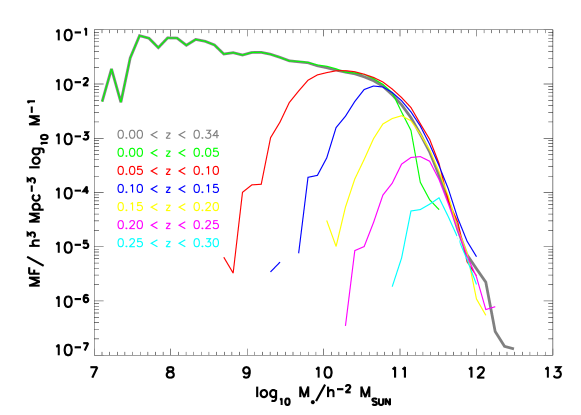
By splitting the DR1 sample by redshift we can probe the evolution of the stellar mass function in recent times. Fig. 3 shows the stellar mass function for galaxies within narrow redshift ranges. Because of the flux limit, there is essentially a minimum mass which can be probed at each redshift, but this is not a sharp cutoff because the galaxies have a range of star formation histories so the mapping from stellar mass to luminosity is not one-to-one. It is apparent from the figure that within the limits of the survey there is very little, if any, evolution in the redshift range . The only notable deviation from this is an apparent deficiency of high-mass galaxies () at very low . The high mass results from the lowest redshift sample should be treated with caution. The galaxies at the high mass end of the mass function are generally large in their angular size. This leads to a problem with “shredding” by the SDSS photometric pipeline, where large galaxies are treated as many smaller sources. It is thought that this is only really a problem for , but for as many as 10% of the detections could be affected (SDSS Collaboration, private communication).
The lack of evolution of the mass function with redshift is in contrast to the significant evolution found in the luminosity function, where the characteristic luminosity has become fainter by around 0.3 magnitudes since , and the number density of bright galaxies has declined by a factor of two or more (Loveday (2003); Blanton et al. (2003b)). The most natural explanation is that the stellar mass content has hardly changed, but that the galaxies have just become significantly fainter; this is expected given the drop-off in star formation activity, and can be illustrated by Fig. 4, which shows the evolution of the average stellar mass with redshift, for galaxy populations of different luminosities. We see clearly an increase in the average mass with decreasing redshift.

3.3 Cosmological Baryon density in stars
Our results can be used to give a further constraint on the contribution to the density parameter from baryons in stars, . By integrating the mass over the range of the mass function we deduce a value of . This value is in broad agreement with results obtained previously (Cole et al. (2001); Bell et al. (2003); Fukugita et al. (1998); Kochanek et al. (2001); Glazebrook et al. (2003)). Our error is a bootstrap estimate, and is purely statistical; systematic errors such as the choice of IMF have not been included.
4 Discussion and Conclusions
We have calculated the stellar mass function of 96,545 galaxies in the Data Release of the Sloan Digital Sky Survey over about 5 decades of mass. The results are in good agreement with previous studies, where the stellar masses were estimated more simply from infrared data. The range probed is considerably extended, and differences in derived parameters are most likely due to different assumed initial mass functions.
Also of importance is the difference in numerical size and redshift range of the sample used to generate the stellar mass function, since we are not restricted to galaxies which appear in the range of galaxies in 2MASS.
In contrast to the luminosity function, the mass function shows no evidence for evolution with redshift. The luminosity function shows a fading of the characteristic luminosity, by a factor of about 1.35 since (Loveday (2003); Blanton et al. (2003b)). The simplest interpretation is that the galaxy stellar masses do not evolve significantly (and this is supported by the star formation rates reported by Heavens et al. (2004)), but that individual galaxies fade. Fig. 4 shows the average mass of massive galaxies in small luminosity redshift ranges, as a function of the observed redshift. We see the expected trend: massive galaxies are typically brighter at higher redshift, scaling roughly as . This represents a typical fading of around 20% over the redshift range to the present.
acknowledgments
The authors wish to thank Jim Dunlop and John Peacock for useful discussions contributing to the development of this work.
Funding for the creation and distribution of the SDSS Archive has been provided by the Alfred P. Sloan Foundation, the Participating Institutions, the National Aeronautics and Space Administration, the National Science Foundation, the U.S. Department of Energy, the Japanese Monbukagakusho, and the Max Planck Society. The SDSS Web site is http://www.sdss.org/.
The SDSS is managed by the Astrophysical Research Consortium (ARC) for the Participating Institutions. The Participating Institutions are The University of Chicago, Fermilab, the Institute for Advanced Study, the Japan Participation Group, The Johns Hopkins University, Los Alamos National Laboratory, the Max-Planck-Institute for Astronomy (MPIA), the Max-Planck-Institute for Astrophysics (MPA), New Mexico State University, University of Pittsburgh, Princeton University, the United States Naval Observatory and the University of Washington.
References
- Abazajian et al. (2002) Abazajian, K., Adelman, J., Agueros, M., et al. 2003, ApJ
- Bell et al. (2003) Bell, E.F., McIntosh, D.H., Katz, N., Weinberg, M.D., ApJ, 2003, 585, 117-120
- Blanton et al. (2003a) Blanton, M.R. 2003a, AJ, 125, 2348
- Blanton et al. (2003b) Blanton, M. et al. 2003b, ApJ, 592, 819
- Cole et al. (2001) Cole, S., et al. 2001, MNRAS, 326, 255
- Fukugita et al. (1998) Fukugita, M., Hogan, C.J., Peebles, P.J.E., 1998, ApJ, 503, 518
- Glazebrook et al. (2003) Glazebrook, K. et al. 2003, ApJ, 587, 55
- Gordon et al. (2003) Gordon, K. D., Clayton, G. C., Misselt, K. A., Landolt, A. U., Wolff, M. J., 2003, ApJ, 594, 279
- Heavens et al. (2000) Heavens, A.F., Jimenez, R., Lahav, O. , 2000, MNRAS, 317, 965-972
- Heavens et al. (2004) Heavens, A.F., Panter, B.D., Jimenez, R., Dunlop, J.S., 2004, Nature, 428, 625
- Jimenez et al. (2003) Jimenez R., MacDonald, J., Dunlop, J. S., Padoan, P., Peacock, J. A., 2004, MNRAS
- Jimenez et al. (2004) Jimenez, R., Panter, B., Heavens, A.F., Verde, L., 2004, astro-ph/0403294
- Kochanek et al. (2001) Kochanek, C.S., et al. 2001, ApJ, 560, 566
- Loveday (2003) Loveday, J., 2004, MNRAS, 347, 601
- Panter et al. (2003) Panter, B., Heavens, A. F., Jimenez, R., 2003, MNRAS, 343, 1145.
- Reichardt et al. (2001) Reichardt, C., Jimenez, R., Heavens, A. F., 2001, MNRAS, 327, 849
- Schechter (1976) Schechter, P., 1976, ApJ, 203, 297-306
- Shen et al. (2003) Shen, S., Mo, H.J., White, S.D.M., Blanton, M.R., Kauffmann, G., Voges, W., Brinkmann J., Csabai, I. , 2003, MNRAS, 343, 978-994
- Spergel et al. (2003) Spergel D. N., et al, 2003, ApJ, 148, 175
- Strauss et al. (2002) Strauss, M.A., Weinberg, D.H., Lupton, R.H. et al. 2002, ApJ, 124, 1810