On the Origin of Dark Matter Cores in Dwarf Galaxies
Abstract
In this paper, we study the dynamical stability and time evolution of the central dark matter cores of low-mass (about M⊙) galactic haloes found in recent cold dark matter simulations at high redshift. From those simulations we extract three haloes, assembled by hierarchical merging, that at redshift display a core and we evolve them without further merging to low redshift using direct -body integration. The central core in the dark matter profile is found to be dynamically stable: it survives for many crossing times without evolution into a cusp. This result supports the claim that the mass dependence of the central dark matter profiles of simulated haloes is a direct consequence of the power spectrum of primordial density fluctuations. In addition, we show that the simulated dark matter profiles, if they evolved in isolation, are consistent with the observed velocity dispersion profile of stars in the inner parts of the Draco dwarf spheroidal galaxy. Simple scaling arguments are reviewed which explain the evolution of the concentration parameter with redshift. We also review some arguments used to derive the logarithmic slope of the inner and outer density profile.
keywords:
cosmology: theory, dark matter – galaxies: dwarf, clusters, haloes – methods: -body simulations1 Introduction
Most of the mass in our universe is thought to be in the form of an unknown dark and collisionless matter that interacts with itself and with normal matter (baryons) only gravitationally. The formation of galaxies and the large scale structures in our universe is driven by the gravitational forces exerted by this dark matter (DM). On large scales the agreement of observations with models where the dark matter can cluster on all mass scales (cold dark matter: CDM) is very good. In this cosmological model, small-mass structures collapse first while larger galaxies and clusters form later by accretion and merging of smaller subclumps. In recent years, it has become possible to investigate the nature of DM in more detail both because of improvements in numerical simulations and because it has been realised that the Local Group of galaxies is a perfect observational laboratory in which to test the predictions of DM simulations.
Observations of rotation curves in nearby dwarf galaxies and low surface brightness (LSB) galaxies generally show that their DM density profile has a flat inner core (van den Bosch et al., 2000; de Blok et al., 2001; de Blok & Bosma, 2002; Borriello & Salucci, 2001; Salucci & Burkert, 2000). This appears to be in disagreement with the results of numerical simulations of CDM haloes. Using -body simulations, several groups find that halo density profiles generally have an inner cusp with slope and, most remarkably, that the mean shape of the profile is universal: it is the same from dwarf galaxies to clusters at any redshift (e.g., Navarro et al., 1997; Moore et al., 1999 but see Syer & White, 1998; Kravtsov et al., 1998; Subramanian et al., 2000; Jing & Suto, 2000). A large number of solutions to resolve the disagreement between observations and theory have been proposed. They can be divided into two main categories: (i) feedback effects of the baryons and stars on the DM density profile and (ii) modifications of the physical properties (e.g., scattering cross section, temperature) of the DM particles (e.g., Bode et al., 2001; Spergel & Steinhardt, 2000). The first class of solutions does not seem to be very effective in removing cusps and while the second has achieved moderate success in explaining the absence of a large population of dwarf haloes around the Milky Way, this comes at the expense of introducing additional inconsistencies with the standard cosmological model.
The disagreement between observations and CDM simulations mainly concerns low-mass haloes and small length scales. In hierarchical scenarios, small mass haloes are mostly assembled at high-redshift. On the other hand -body simulations have focused on studying the formation of Milky-Way type haloes or clusters ( M⊙) at low-redshift (). Recently, (Ricotti, 2003a, hereinafter RO3) have used -body simulations to study the DM profiles of haloes with masses between M⊙ and M⊙, comparing them at their characteristic redshift of formation (). This is done using simulations with different box sizes and comparing the DM profiles of the haloes at different redshifts, when the most massive haloes in the simulations are composed of about the same number of DM particles. The results show that the density profile of DM haloes is not universal, presenting cores in dwarf galaxies and steeper cusps in clusters. This result could be a resolution of the conflict between the results of CDM simulations and the observed dwarf galaxy rotation curves, if we assume that the profile is stable and remains flat from (when the simulation is halted because of the small volume of the box) to low redshift.
It should be mentioned that in a recent work, Colin et al. (2003) have analysed simulations with similar resolution and box sizes as those in R03 and find no evidence for a trend of the inner slope with the mass of the dark halo. This disagreement may be due to differences in their analysis of the simulations, as they have analysed the slopes of the haloes only at redshift for all their simulations, irrespective of box size. It is well known that the smaller the box size the earlier a simulation ceases to be a representative volume of the universe. In a simulation with 1h-1 Mpc (32 h-1 Mpc) box size at (), modes with wavelength comparable to the size of the box become nonlinear and, for instance, the halo mass function becomes unreliable. Colin et al. (2003) conclude that the results of their simulations are in disagreement with R03 because the simulations are identical; however, we note that they have analysed their haloes at redshift while the haloes in R03 were analysed at redshift . As a consequence of the additional evolution from to , their haloes are about ten times more massive. It is therefore likely that the disagreement is related to their attempt to analyse haloes at low redshift in a small cosmological volume. Indeed, R03 also finds that the cores observed in the ten most massive haloes at eventually evolve to cusps. Any possible trend of the dark halo inner slopes with halo mass can easily be confused with a mass dependence of the concentration parameter. In order to demonstrate that a trend exists, particular care must be taken to minimise any possible systematic errors, for example, by comparing haloes in simulations with different box sizes only when the most massive haloes have comparable number of particles (R03). More recently, Cen et al. (2004) have confirmed the results found by R03; in addition, they identify a redshift dependence of the typical halo profile.
In addition to the disagreement on the value of the inner slope (Power et al. (2003) find while is advocated by Moore et al. (1999)) other groups have also found deviations of the DM profile from a “universal shape”. These deviations manifest themselves as dependences of the profile shape on the mass, environment, cosmology or merging history (Syer & White, 1998; Kravtsov et al., 1998; Subramanian et al., 2000; Jing & Suto, 2000; Jing, 2000). In recent years, it has become possible to observe the DM profile of haloes at the two extremes of the halo mass function: in dwarf spheroidal galaxies with M⊙ and in clusters with M⊙. In § 2 we summarise observational evidence that appears to confirm the results found by R03, albeit with significant uncertainty.
The simulation results in R03 strongly suggest that the mass function of the accreting satellites determines the inner slope of the DM profile. However, the results might also be interpreted as a trend with dynamical state in the assembly process of haloes of different mass. In this paper we study the dynamical stability of the flat profiles of dwarf-size haloes at by evolving them from their redshift of formation to lower redshift without further merging. We extract a few haloes at and we evolve them in isolation using a direct -body integration code (see § 3 for details on the method). In § 4 we show that the profiles are dynamically stable and retain an almost flat core. As shown in § 5 the DM profile is consistent with the observed velocity dispersion of stars in the inner regions of the Draco dSph. Simple scaling arguments are given in § 6 to understand how the concentration parameter evolves with redshift and what determines the slope of the outer profile. We summarise the results in § 7.
2 Non-universal DM profile: Observations
There is growing observational evidence that the DM density profile in the central regions of low-mass galaxy haloes is not universal and that cored profiles are favoured over cuspy halo models. Despite the on-going debate about the correct interpretation of the gas rotation curves of low-mass disk galaxies, it is clear that these galaxies display a wide range of inner halo profiles. What is also apparent is that the data generally favour logarithmic density slopes close to (e.g., de Blok et al., 2003). The gas-free Local Group dwarf spheroidal galaxies provide a cleaner test-bed for DM models as they are often completely DM dominated at all radii and it is therefore possible to measure their DM content by treating their baryonic content as a massless tracer population. The recent identification of a kinematically cold stellar substructure in the Ursa Minor dSph (Kleyna et al., 2003) strongly suggests that the dark halo of that galaxy has a central core. Using -body simulations Kleyna et al. (2003) showed that this cold structure would survive for less than Gyr if the DM core were cusped. Only if the DM core has a uniform density core can the cold substructure survive for a Hubble time. Additionally, Magorrian (2003) found for the Draco dSph.
Gravitational lensing observations show that the inner slope of the DM profile in clusters is . Dahle et al. (2003) studied six massive clusters with masses M⊙ at . They find and at the 68 % confidence level. Smith et al. (2001) finds for the lensing cluster A383 that has a mass M⊙ (). The lensing cluster MS 2137-2353 has been studied independently by two groups. Their conclusions are quite different. Gavazzi et al. (2003) find , but they note that if the identification of a fifth lensed image is confirmed by HST observations, an isothermal profile with a flat core fits the data better. Sand et al. (2002) find a best-fit and at 99 % confidence level for the same cluster. These results are extended and strengthened by the analysis of six clusters presented in Sand et al. (2004). X-ray studies based on Chandra observations find that the inner slope of the DM profile is consistent with (Arabadjis et al., 2002). Lewis et al. (2003) use a generalised profile to fit their observations and find for the central slope of A2029.
Thus there is some observational evidence for a dependence on halo mass of the inner slope of dark matter haloes, and hence for the non-universality of the dark matter profile, in agreement with the findings of R03.
3 Numerical Method
We extract three haloes (HALO 1, 3 and 7) from the simulation with h-1 Mpc in R03 at and we evolve each of them as an isolated -body system using a direct -body code as explained in the next subsection. We can neglect the Hubble expansion since for kpc, where is the halo circular velocity, the effect on the inner profile is negligible. The location of the dark matter core radius, pc, is not affected by the Hubble expansion.
3.1 -body simulations
We follow the evolution of the low mass haloes using the direct -body integration code NBODY4 (Aarseth, 1999). In order to avoid spurious two-body interactions (that are non-physical for dark matter particles) we have adopted a standard force smoothing at small particle separation with the same Plummer softening parameter, pc (physical) as that used in R03. We have also run the same simulations without force smoothing to investigate the possible importance of spurious two-body effects, finding that the profiles at early times are very similar. Even at later times there are only negligible differences between the evolved profiles in the two sets of runs (softened and un-softened). Initially, the three simulations performed contain, respectively, , and particles of mass M⊙ and their evolution is followed for about Gyr ( Gyr for the un-softened runs). The simulations were performed on GRAPE-6 special-purpose computer boards (Makino et al., 1997) at the American Museum of Natural History, New York and at the Institute of Astronomy, Cambridge. At regular intervals during the integration the positions and velocities of all particles in the simulation were recorded and the density profiles calculated. The density profiles are calculated as in R03. The centre of the halo is calculated iteratively for particles within a given radius. The radius is reduced until the centres calculated using the centre of mass, density maximum and the minimum of the gravitational potential, converge. The results converge within , where pc is the Plummer softening parameter.
4 Results
The main aim of this paper is to investigate whether the profiles found by R03 are in equilibrium. In order to check the stability of the haloes, however, we do not need to evolve the halo for 12 Gyr (the time from to ) but for a much shorter time scale: namely the crossing time Gyr. On this time scale two-body relaxation can be safely ignored since , where is the two-body relaxation time scale.
Fig. 1 shows the the circular velocity of the three haloes with M⊙ virialised at and evolved in isolation for about Gyr. The profiles are shown at the times after indicated by the labels. The vertical dashed lines show the location of the virial radius when the haloes formed at . Note that at the halo virial radius (defined as the radius where the halo mean density is about times the IGM mean density) will be about ten times larger (see § 6.1) but a fraction % of the halo mass will reside in the inner 1 kpc. If instead the halo is accreted by a larger galaxy the outer envelope of the halo will be lost and the mass and radius might be reduced to the values at the epoch of formation (). The profiles shown here are reliable in the range of radii pc, where is the force smoothing length and kpc. At larger radii, the Hubble expansion and the mean density of the intergalactic medium (IGM) should be included to determine the evolution of the outer density profile. We will return to this issue in § 6.1.
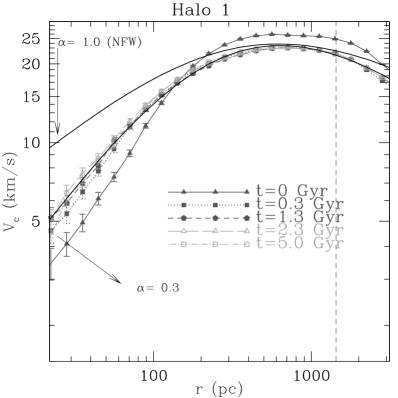
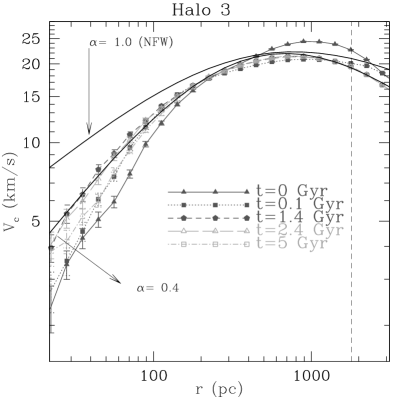
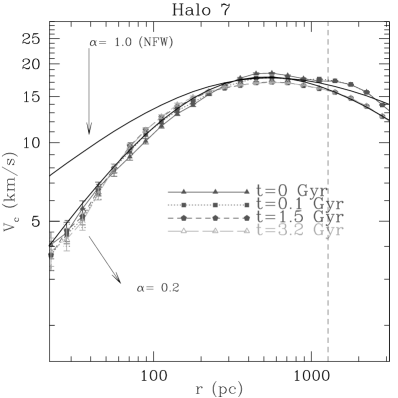
As the figures show, after about Gyr, the profiles settle into a stable configuration and the central regions of the haloes (within about kpc) do not evolve significantly during the next 5 Gyrs. The final density profiles of the three haloes are very similar to each other and have almost flat cores with inner slopes in the range . After Gyrs two-body relaxation may start to be important in driving the evolution of a mildly cusped core into a halo with a flatter core (see e.g., Hayashi et al., 2003; Jin et al., 2003). This can be observed in HALO 3 that at Gyrs has settled to an equilibrium slope with and at Gyrs has evolved to an almost flat core ().
The two-body relaxation time is , where is the velocity dispersion of the particles, is their mass and is their density. Taking and the core density for we have,
Since both the density profile at and the velocity dispersion are approximately constant with radius, does not depend strongly on the radius. For the haloes in our simulations the estimated two-body relaxation time is Gyr, consistent with the observed evolution of HALO 3. The equilibrium profiles of HALO 1 and HALO 7 (after Gyrs) are almost flat and therefore the cores in these haloes do not arise from any two-body effects in the present work. Moreover, since the Hubble time at is ten times shorter than Gyr, two-body relaxation effects are not important even in the R03 simulations from which the initial conditions where taken (see R03 for extensive discussion of this issue).
Even the later evolution (at Gyrs) is not strongly affected by two-body relaxation, in the sense that the profile does not evolve significantly towards a post core-collapse cusp. Indeed one would expect that relaxation would turn our initially cored profiles into cusped profiles (via core collapse) on time scales Gyr for our haloes (Takahashi, 1995). We do not see the effects of core collapse in our systems during the first 12 Gyr even in the simulations that do not include force softening.
5 Comparison with observations
In recent years, the volume of kinematic data available for Local Group dSph galaxies has increased significantly (e.g., Mateo, 1997; Kleyna et al., 2002, 2003). These data make it possible for the first time to map the velocity dispersion profiles of these galaxies and have confirmed that in at least one case, the Draco dSph, the high central velocity dispersion persists to large radii (Kleyna et al., 2001). It is instructive to compare the observable dispersion profile expected for a dwarf galaxy whose halo mass distribution is matched by one of those simulated in the previous section. We assume that the projected light distribution in the dwarf follows a Sérsic profile
| (1) |
where pc and which is a good fit to the inner surface brightness profile of Draco (Klessen et al., 2003). If we further assume that the stellar velocity distribution is everywhere isotropic then integration of the Jeans equations yields the expected (projected) velocity dispersion as a function of radius
| (2) |
where is the density of the light. Fig. 2 compares the dispersion profile for HALO 1 at (solid line) with the observed dispersion profile for Draco (Kleyna et al., 2002). The other lines show the dispersion profiles using synthetic scaled versions of HALO 1 (that has a final mass of M⊙). In the top panel we show two haloes with the same core density as HALO 1 but with twice its mass (dashed line) and four times its mass (dotted line). The dotted line in the bottom panel shows a halo eight times more massive than HALO 1 but with half its core density. This profile provides a better fit to the overall shape of the dispersion profile. Haloes with total mass M⊙ provide reasonable fits to the observed profile. We note that Stoehr et al. (2002) also found haloes in their simulations which were able to match Draco’s dispersion profile. However, given that the resolution limit (in physical units) of those simulations was comparable to the edge of the light distribution in Draco it is not clear that their agreement with the observed dispersion profile is physically significant.

6 Scaling arguments
In this section we present a short review of previous semi-analytic arguments in order to illustrate the physical mechanisms that determine the shapes of dark matter haloes. Using very simple arguments, we attempt to clarify the links between our numerical results and theory. Using -body simulations R03 have shown that the density profile
| (3) |
with , and constant concentration parameter provides a good fit to all recently-virialised DM haloes from dwarf galaxies to clusters. Here, is the effective spectral index of the initial power spectrum of density perturbations, is the virial radius and M⊙), where is the halo mass.
The relationship between the inner slope and can be understood using simple scaling arguments (see § 6.1). In the present paper, the haloes are evolved from to low redshift in a zero-density universe, neglecting the Hubble expansion. This simplification prevents us from knowing the evolution with redshift of the concentration parameter and the outer profile of the dark halo. In § 6.2 we review some simple arguments whose aim is to clarify the physical processes that determine the evolution of the concentration parameter and the outer slope of the density profile from the time of halo virialisation to .
6.1 Inner slope
In this section, following Peebles (1974) and Hoffman & Shaham (1985), we review the arguments used to derive the inner profile of DM haloes under the simplistic assumption that each sub-halo (here represented as a step function in density) survives undisrupted when incorporated in a larger halo. The result that we obtain agrees remarkably well with the simulations in R03.
Assuming an Einstein de-Sitter universe, linear perturbations grow as , where is the scale factor of the universe and is the age of the Universe. The variance in the amplitude of the density perturbations varies with perturbation mass and time as . Here is the effective spectral index of the initial power spectrum of density perturbations . When reaches approximately unity, the associated perturbations become non-linear: this occurs at time . Hence, : small masses become non-linear at earlier times if . The halo sizes as a function of mass are given by , where the comoving radius is , and the mean densities of the haloes are . The profile of a halo formed by the merger of many such haloes is then given by the envelope that contains all the merged haloes piled on each other like “Russian dolls”. Smaller, higher-density haloes will reside in the centre while the more extended, lower-density haloes dominate the profile at large radii. Combining the expressions for and we find , where . The effective in the 1 h-1 Mpc simulations of R03 is corresponding to .
6.2 Halo concentration and outer slope
The post-virialisation evolution of isolated dark haloes can be understood (to a first approximation) using simple arguments partially based on the theory of secondary infall developed by Gunn & Gott (1972) and Gott (1975).
Particles that decouple from the Hubble flow and become gravitationally bound are found, by definition, at radii where the escape velocity is smaller than the Hubble expansion (i.e., , where is the Hubble parameter). Therefore, since , where is the circular velocity, we have
| (4) |
where is the outer radius of the dark halo. Since the Hubble expansion decreases monotonically with time and the mass of the halo after formation is either constant or increases with time, it follows that a halo that evolves in isolation (i.e., without major mergers) increases its size and mass. Assuming, for simplicity, that the halo mass increases with time as , from equation (4) we have or, neglecting the cosmological constant, , where is the virial radius at the time of formation. According to the numerical results presented in § 4 the dark halo core radius, , remains constant with time. Therefore, the concentration parameter, , evolves as
| (5) |
Here, we note the result found by R03 that the concentration parameter of recently virialised haloes is roughly constant and independent of the halo mass. Finally, based on simple scaling arguments (see Gott, 1975), the outer envelope should have a density profile .
Gunn & Gott (1972) find that during secondary infall (infalling shells do not cross during the infall). But if, after the collapse, crossing shells start leading to violent relaxation then one expects the equilibrium halo to be more centrally condensed and the outer envelope should have a logarithmic slope between (violent relaxation) and (infall upper limit). We also note that the assumption that the infall rate is a power law in time is an oversimplification since isolated haloes will evolve differently depending on whether they are located in an overdense or underdense region of the IGM or as a consequence of extended density correlations. In other words, the density power spectrum introduces preferred length scales, and local departures from introduce preferred time scales. This more complicated and realistic accretion history is reflected in a large scatter of the concentration parameters of haloes of a given mass, as shown by N-body simulations (e.g., Bullock et al., 2001; Wechsler et al., 2002). For the purpose of this section we simply note that assuming (i.e., neglecting the mass accreted after virialisation) we obtain good agreement with -body simulations for the dependence of the concentration parameter on the redshift and formation redshift, (e.g., Wechsler et al., 2002) and outer profile (e.g., Navarro et al., 1997). Our simple arguments are also in good agreement with the numerical results of Wechsler et al. (2002); Zhao et al. (2003b); Zhao et al. (2003a) that find that the concentration of haloes is about constant () at the end of an initial phase of rapid accretion (i.e., virialisation) and increases later to larger values as a consequence of a slower secondary phase of accretion (i.e., secondary infall). In agreement with those numerical studies, equation (5) implies that at high redshift most haloes have small concentrations , since they did only recently virialise.
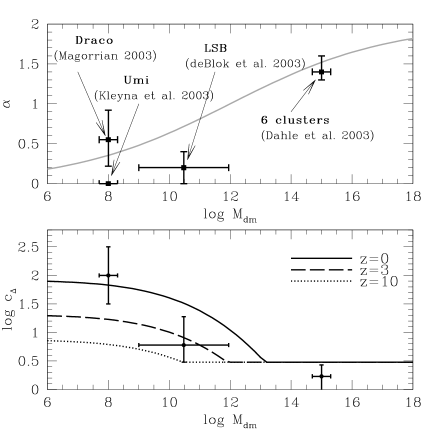
In CDM cosmologies small mass haloes form earlier. We can use the results of § 6.1 to relate the mass of the halo to its typical redshift of virialisation: . Using the relation and we have . In Fig. 3 we compare and as a function of mass with observations (Kleyna et al., 2003; Magorrian, 2003; de Blok et al., 2003; Dahle et al., 2003). The DM profile slope and concentration based on the generalised DM profile are consistent with the observational data if the concentration parameter at virialisation is 111Note that the haloes in R03 have , but they have been analysed some time after virialisation. A 40 % increase of their concentration since virialisation is plausible.. Note that the concentrations shown in the bottom panel are a rough approximation because they have been derived using scaling arguments and are valid only qualitatively. At high redshifts the halo concentrations are about constant and almost independent on the halo masses, as illustrated by the dashed (at ) and dotted (at ) lines in the bottom panel of Fig. 3.
Finally we note that the mass-dependent profile shape coupled with a mass-independent concentration parameter at virialisation gives first-order results in good agreement with a universal profile shape coupled with the mass-dependent concentration parameter, , found by (Bullock et al., 2001) and others. This renders the results presented here more consistent with other results than one might first have guessed (for a discussion see R03).
7 Summary and Conclusions
Cosmological simulations of the formation of the first galaxies at show a good agreement with the observed properties of dSphs in the Local Group (Ricotti et al., 2002a, b; Ricotti, 2003b; Tassis et al., 2003; Susa & Umemura, 2004). Those simulations, because of the inclusion of radiative feedback effects, can reproduce the observed number of luminous galactic satellites and the observed internal properties of dSphs (e.g., mass-luminosity relation, metallicity-luminosity relation, mass-to-light ratio, half-light radius). According to those simulations and similar pure -body simulations (Ricotti, 2003a), the DM profiles of dwarf galaxies at have a central core instead of a steep cusp.
In this paper we have used -body simulations to show that the central DM core found in dwarf galaxy haloes at is dynamically stable. At low redshift the halo still has a flat core in agreement with the observed rotation curves of low-mass disk galaxies and evidence from the Ursa Minor dSph galaxy. We find that the projected velocity dispersion profile for a dwarf galaxy with a light distribution similar to that of the Draco dSph residing in any of the dark haloes in our simulations resembles the observed profile in the inner regions of Draco dSph, making these haloes plausible hosts for the observed dSph galaxies.
In this paper we have evolved the simulated haloes as isolated systems. While some of the satellites of the Milky Way (e.g., the Sagittarius dSph) are clearly in the process of being destroyed by the tidal field of the Milky Way(e.g., Mateo, 1998), others (e.g., the Draco dSph) show little evidence for significant tidal effects in their inner regions (e.g., Kleyna et al., 2002; Klessen et al., 2003). It is therefore reasonable to assume that their inner haloes have evolved in near-isolation since the formation of their stellar populations. The persistence of the central DM core in our simulations confirms the conclusion of R03 that the mass dependence of the inner slope of dark matter haloes could arise solely from the power spectrum of primordial density fluctuations.
The concentrations and slopes of the inner profiles of simulated haloes are found to be in good agreement with available observations of dwarf galaxies and clusters at . The concentrations as a function of mass and redshift agree with those found in published -body simulations in the mass range M⊙ covered by those simulations. We have also summarised scaling arguments which demonstrate why the inner slope depends on the halo mass and why the concentration parameter depends on the time elapsed since virialisation.
ACKNOWLEDGEMENTS
MR and MIW are supported by PPARC rolling grants at the Institute of Astronomy, Cambridge. We would like to thank Jarrod Hurley for running the -body code on a GRAPE-6 board at the American Museum of Natural History, New York and Jerry Ostriker for useful discussions. We thank the referee David Weinberg for comments that improved the quality and clarity of the paper.
References
- Aarseth (1999) Aarseth, S. J. 1999, Celestial Mechanics and Dynamical Astronomy, 73, 127
- Arabadjis et al. (2002) Arabadjis, J. S., Bautz, M. W., & Garmire, G. P. 2002, ApJ, 572, 66
- Bode et al. (2001) Bode, P., Ostriker, J. P., & Turok, N. 2001, ApJ, 556, 93
- Borriello & Salucci (2001) Borriello, A., & Salucci, P. 2001, MNRAS, 323, 285
- Bullock et al. (2001) Bullock, J. S., Kolatt, T. S., Sigad, Y., Somerville, R. S., Kravtsov, A. V., Klypin, A. A., Primack, J. R., & Dekel, A. 2001, MNRAS, 321, 559
- Cen et al. (2004) Cen, R., Dong, F., Bode, P., & Ostriker, J. P. 2004, ArXiv Astrophysics e-prints (astro-ph/0403352)
- Colin et al. (2003) Colin, P., Klypin, A., Valenzuela, O., & Gottlober, S. 2003, ArXiv Astrophysics e-prints
- Dahle et al. (2003) Dahle, H., Hannestad, S., & Sommer-Larsen, J. 2003, ApJ, 588, L73
- de Blok & Bosma (2002) de Blok, W. J. G., & Bosma, A. 2002, A&A, 385, 816
- de Blok et al. (2003) de Blok, W. J. G., Bosma, A., & McGaugh, S. 2003, MNRAS, 340, 657
- de Blok et al. (2001) de Blok, W. J. G., McGaugh, S. S., Bosma, A., & Rubin, V. C. 2001, ApJ, 552, L23
- Gavazzi et al. (2003) Gavazzi, R., Fort, B., Mellier, Y., Pelló, R., & Dantel-Fort, M. 2003, A&A, 403, 11
- Gott (1975) Gott, J. R. I. 1975, ApJ, 201, 296
- Gunn & Gott (1972) Gunn, J. E., & Gott, J. R. I. 1972, ApJ, 176, 1
- Hayashi et al. (2003) Hayashi, E., Navarro, J. F., Taylor, J. E., Stadel, J., & Quinn, T. 2003, ApJ, 584, 541
- Hoffman & Shaham (1985) Hoffman, Y., & Shaham, J. 1985, ApJ, 297, 16
- Jin et al. (2003) Jin, S., Ostriker, J. P., & Wilkinson, M. I. 2003, ArXiv Astrophysics e-prints (astro-ph/0311457)
- Jing (2000) Jing, Y. P. 2000, ApJ, 535, 30
- Jing & Suto (2000) Jing, Y. P., & Suto, Y. 2000, ApJ, 529, L69
- Klessen et al. (2003) Klessen, R. S., Grebel, E. K., & Harbeck, D. 2003, ApJ, 589, 798
- Kleyna et al. (2002) Kleyna, J., Wilkinson, M. I., Evans, N. W., Gilmore, G., & Frayn, C. 2002, MNRAS, 330, 792
- Kleyna et al. (2001) Kleyna, J. T., Wilkinson, M. I., Evans, N. W., & Gilmore, G. 2001, ApJ, 563, L115
- Kleyna et al. (2003) Kleyna, J. T., Wilkinson, M. I., Gilmore, G., & Evans, N. W. 2003, ApJ, 588, L21
- Kravtsov et al. (1998) Kravtsov, A. V., Klypin, A. A., Bullock, J. S., & Primack, J. R. 1998, ApJ, 502, 48
- Lewis et al. (2003) Lewis, A. D., Buote, D. A., & Stocke, J. T. 2003, ApJ, 586, 135
- Magorrian (2003) Magorrian, J. 2003, in The Mass of Galaxies at Low and High Redshift. Proceedings of the ESO Workshop held in Venice, Italy, 24-26 October 2001, p. 18.
- Makino et al. (1997) Makino, J., Taiji, M., Ebisuzaki, T., & Sugimoto, D. 1997, ApJ, 480, 432
- Mateo (1997) Mateo, M. 1997, in ASP Conf. Ser. 116: The Nature of Elliptical Galaxies; 2nd Stromlo Symposium, 259
- Mateo (1998) Mateo, M. L. 1998, ARA&A, 36, 435
- Moore et al. (1999) Moore, B., Quinn, T., Governato, F., Stadel, J., & Lake, G. 1999, MNRAS, 310, 1147
- Navarro et al. (1997) Navarro, J. F., Frenk, C. S., & White, S. D. M. 1997, ApJ, 490, 493
- Odenkirchen et al. (2001) Odenkirchen, M., et al. 2001, AJ, 122, 2538
- Peebles (1974) Peebles, P. J. E. 1974, ApJ, 189, L51
- Power et al. (2003) Power, C., Navarro, J. F., Jenkins, A., Frenk, C. S., White, S. D. M., Springel, V., Stadel, J., & Quinn, T. 2003, MNRAS, 338, 14
- Ricotti (2003a) Ricotti, M. 2003a, MNRAS, 344, 1237
- Ricotti (2003b) Ricotti, M. 2003b, in The IGM/Galaxy Connection: The Distribution of Baryons at z=0, ASSL Conference Proceedings Vol. 281. Edited by Jessica L. Rosenberg and Mary E. Putman. Kluwer Academic Publishers, Dordrecht, 2003, p.193, 193
- Ricotti et al. (2002a) Ricotti, M., Gnedin, N. Y., & Shull, J. M. 2002a, ApJ, 575, 33
- Ricotti et al. (2002b) Ricotti, M., Gnedin, N. Y., & Shull, J. M. 2002b, ApJ, 575, 49
- Salucci & Burkert (2000) Salucci, P., & Burkert, A. 2000, ApJ, 537, L9
- Sand et al. (2002) Sand, D. J., Treu, T., & Ellis, R. S. 2002, ApJ, 574, L129
- Sand et al. (2004) Sand, D. J., Treu, T., Smith, G. P., & Ellis, R. S. 2004, submitted (astro-ph/0309465)
- Smith et al. (2001) Smith, G. P., Kneib, J., Ebeling, H., Czoske, O., & Smail, I. 2001, ApJ, 552, 493
- Spergel & Steinhardt (2000) Spergel, D. N., & Steinhardt, P. J. 2000, Physical Review Letters, 84, 3760
- Stoehr et al. (2002) Stoehr, F., White, S. D. M., Tormen, G., & Springel, V. 2002, MNRAS, 335, L84
- Subramanian et al. (2000) Subramanian, K., Cen, R., & Ostriker, J. P. 2000, ApJ, 538, 528
- Susa & Umemura (2004) Susa, H., & Umemura, M. 2004, ApJ, 600, 1
- Syer & White (1998) Syer, D., & White, S. D. M. 1998, MNRAS, 293, 337
- Takahashi (1995) Takahashi, K. 1995, PASJ, 47, 561
- Tassis et al. (2003) Tassis, K., Abel, T., Bryan, G. L., & Norman, M. L. 2003, ApJ, 587, 13
- van den Bosch et al. (2000) van den Bosch, F. C., Robertson, B. E., Dalcanton, J. J., & de Blok, W. J. G. 2000, AJ, 119, 1579
- Wechsler et al. (2002) Wechsler, R. H., Bullock, J. S., Primack, J. R., Kravtsov, A. V., & Dekel, A. 2002, ApJ, 568, 52
- Zhao et al. (2003a) Zhao, D. H., Jing, Y. P., Mo, H. J., & Börner, G. 2003a, ApJ, 597, L9
- Zhao et al. (2003b) Zhao, D. H., Mo, H. J., Jing, Y. P., & Börner, G. 2003b, MNRAS, 339, 12