ATLAS vs. NextGen model atmospheres:
a combined analysis of synthetic spectral energy distributions
Abstract
We carried out a critical appraisal of the two theoretical models, Kurucz’ ATLAS9 and PHOENIX/NextGen, for stellar atmosphere synthesis. Our tests relied on the theoretical fit of spectral energy distributions (SED) for a sample of 334 target stars along the whole spectral-type sequence, from the classical optical catalogs of Gunn & Stryker (1983) and Jacoby et al. (1984). The best-fitting physical parameters (, ) of stars allowed an independent calibration of the temperature and bolometric scale vs. empirical classification parameters (i.e. spectral type and MK luminosity class); in addition, the comparison of the synthetic templates from the ATLAS and NextGen grids allowed us to probe the capability of the models to match spectrophotometric properties of real stars and assess the impact of the different input physics. We can sketch the following main conclusions of our analysis:
i) fitting accuracy of both theoretical libraries drastically degrades at low , where both ATLAS and NextGen models still fail to properly account for the contribution of molecular features in the observed SED of K-M stars.
ii) Comparing with empirical calibrations, both ATLAS and NextGen fits tend, in average, to predict slightly warmer (by 4–8%) for both giant and dwarf stars of fixed spectral type, but ATLAS provides in general a sensibly better fit (a factor of two lower of flux residuals) than NextGen.
iii) There is a striking tendency of NextGen to label target stars with an effective temperature and surface gravity in excess with respect to ATLAS. The effect is especially evident for MK I-III objects, where a fraction of stars of about one in four is clearly misclassified by NextGen in . This is a consequence of some “degeneracy” in the solution space, partly induced by the different input physics and geometry constraints in the computation of the integrated emerging flux (ATLAS model atmospheres assume standard plane-parallel layers, while NextGen adopts, for low-gravity stars, a spherical-shell geometry). A different vertical structure of stellar atmosphere seems also required for NextGen synthetic SEDs in order to better account for limb-darkening effects in cool stars, as supported by the recent observations of the EROS BLG2000-5 microlensing event.
1 Introduction
Theoretical computation of model atmospheres has been a leading issue of stellar astrophysics in the last decades. In this framework, Kurucz’ (1970; 1979) pioneering work certainly stands as a main reference, together with a few other major contributions like those of Gustafsson et al. (1975) and Tsuji (1976), on the synthesis of red giant stars.
In its more recent versions, Kurucz’ (1992a; 1995) ATLAS code included over 58 million spectral lines, providing an accurate description of blanketing effects, that modulate ultraviolet emission of stars (Holweger, 1970; Gustafsson et al., 1975), and also including nearly all the most important di-atomic molecules, that shape spectral energy distribution (SED) at longer wavelength. The lack of tri-atomic molecules (in primis H2O), and an incomplete treatment of TiO opacity, however, still prevents a satisfactory match of stars cooler than 3500 K (Kurucz, 1992b; Castelli, Gratton, & Kurucz, 1997). This limit of ATLAS theoretical atmospheres unfortunately affects a number of physical applications dealing, for instance, with the study of cool pulsating variables, or the match to integrated SED of galaxies, through stellar population synthesis.
More recently, Hauschildt et al. (1999a, b) have presented their PHOENIX/NextGen grid of model atmospheres for dwarf and giant stars. Allard, Hauschildt, & Schweitzer (2000) extended the original bulk of models to the pre-main-sequence (pre-MS) evolution at the low-mass regime. With its 500 million atomic and molecular lines and a spherical geometry treatment of stellar structure, the NextGen library is arguably the most advanced one currently available in the literature. As the low-temperature physical regime is suitably sampled, with models as cool as K, these may possibly fill the gap assuring a homogenous coverage of the stellar fundamental parameters across the whole H-R diagram.
Given the relevance of the Kurucz and Hauschildt et al. contributions, it could be of special interest, at this stage, to carry out a combined analysis of the ATLAS vs. NextGen codes, in order to check their mutual capabilities to match spectrophotometric properties of real stars and assess self-consistency in their input physics. Our analysis follows the Hauschildt et al. (1999a) preliminary discussion, and will be carried out in two steps. After a brief description of the main features of each theoretical dataset (Sec. 2), we will first try a fit to observations of template stars and compare model outputs (Sec. 3). This will rely on an original optimization procedure, that also provides an estimate of the fit uncertainty across the (, , [M/H]) phase space. The best fits will allow to establish an effective temperature scale and a calibration of the bolometric correction scale (Sec. 4). In Sec. 5 we will then analyse ATLAS vs. NextGen theoretical models for fixed fiducial spectral types. A full summary of the relevant conclusions of our tests is finally given in Sec. 6.
2 Input model atmospheres and grid properties
ATLAS model atmospheres assume steady-state plane-parallel layers under the hypothesis of local thermodynamic equilibrium (LTE). Line blanketing is computed statistically by means of opacity distribution functions (ODF), that average the contribution of the different atomic/molecular species through the corresponding oscillator forces (Strom & Kurucz, 1966; Kurucz, 1970, 1979). For our work, we used the ATLAS 9 version (Kurucz, 1995), whose treatment of convection is based on the mixing length theory (Böhm-Vitense, 1958) and accounts for the so-called “approximate overshooting”, according to Castelli, Gratton, & Kurucz (1997). The mixing length parameter is set to and the microturbulence velocity to 2 km s-1 throughout. The whole theoretical library is made available at the Kurucz web site.111 http://kurucz.harvard.edu
The model library spans a temperature range between K, sampled at a variable step from 250 to 2500 K with increasing temperature; surface gravity and metallicity cover the interval dex at steps of dex, and dex, respectively. The corresponding SEDs, which also account for line opacity through the ODFs, span from the far-ultraviolet ( Å) to the far-infrared (160 m), sampled by 1221 wavelength points, with Å in the UV and Å in the visual range.
NextGen models have originally been computed by Hauschildt and collaborators with the multipurpose code PHOENIX (e.g., Hauschildt et al., 1996). They assume LTE and plane-parallel geometry for dwarf stars, while a spherical symmetry is adopted in low-gravity model atmospheres () for giant and pre-MS stars (Hauschildt et al., 1999b; Allard, Hauschildt, & Schweitzer, 2000). As a striking difference with respect to the Kurucz models, direct opacity sampling is performed including over 500 million lines of atomic and molecular species along the spectrum.
The phase-space domain of the NextGen grid spans the K range at steps – K, with gravity in the
interval ( dex), and
metallicity in the range . The SEDs cover the
wavelength range from 100 Å to 970 m sampled at coarser wavelength
steps, that can change from model to model (depending on the intervening
absorption features in the spectrum). However, a typical
Å step in the optical region can be picked out. All
the data are available via anonymous ftp.222 ftp://calvin.physast.uga.edu/pub/
http://dilbert.physast.uga.edu/yeti
Note that the libraries of dwarf and giant stars available at these sites
have lower limits than the published ones.
In addition to the standard fundamental parameters (i.e. , , [M/H]), spherical models in NextGen require one supplementary “dimension” in the phase space. As and , then the emerging luminosity becomes . Contrary to the plane-parallel case, therefore, mean surface brightness depends on the absolute size of stars through the stellar mass (). Giant-star models in the NextGen grid are computed for , while pre-MS stars assume . However, mass scaling is found to induce second-order effects on the stellar SED (Hauschildt et al., 1999b), although total luminosity of the models scales of course as for fixed temperature and gravity.
3 Matching SED of template stars
A first “sanity” check in our analysis concerns the match with template stars along the whole O M spectral-type sequence. Comparison with observed SEDs is one of the most natural application of model atmospheres. High-resolution spectra help in fact investigate chemical composition of stars, while the shape of (pseudo-)continuum at lower resolution gives clues on stellar gravity and effective temperature.
3.1 The empirical spectral libraries
For our test we considered the complete libraries of stellar spectra by Gunn & Stryker (1983, hereafter GS83) and Jacoby et al. (1984, JHC84). Both sets of spectra span the whole range of stellar parameters, from giants (MK class I–III) to dwarfs (MK class IV–V), and have been widely used in the literature, particularly for population synthesis studies (e.g., Pickles, 1985; Guiderdoni & Rocca-Volmerange, 1987; Fanelli, O’Connell, & Thuan, 1987; Bruzual & Charlot, 1993). The complete sample of target stars amounts to 336 objects (175 stars from GS83 and 161 from JHC84, with no stars in common to the two libraries).
The GS83 data cover a wide wavelength range, from 3130 to 10800 Å, observed at low resolution (FWHM=20 Å in the blue and 40 Å in the red) and sampled at steps of 10-20 Å. Due to a poorer S/N quality in the ultraviolet, particularly for cool stars (Gunn & Stryker, 1983), only the wavelength interval for Å is suitable for our analysis. Thanks to a better sampling ( Å), the FWHM Å resolution of JHC84 spectra is better exploited, giving a more detailed picture of the main absorption features of template stars in the Å spectral range. For both the GS83 and JHC84 datasets we had to reject several regions (namely, around 6840–7000 Å, 7140–7350 Å, 7560–7720 Å, 8110–8360 Å, and 8900–9800 Å) affected by telluric bands of O2 and H2O.
In our work we adopted the original MK spectral classification by GS83 and JHC84. For 24 out of 26 unclassified objects we relied on the SIMBAD database. All the spectra have been corrected for Galaxy reddening and atmospheric extinction as reported in the original data sources.
3.2 The theoretical spectral libraries
The subsample of [M/H] = 0 model atmospheres has been used to match the observations. This choice is consistent with the mean metallicity of the GS83 and JHC84 stars. A systematic search from high-resolution abundance studies in the literature actually provided a mean value of for 67 stars in the GS83 sample, and for 25 JHC84 stars.333The bulk of metallicity estimates for our star sample comes from the catalogs of Cayrel de Strobel et al. (1997, 2001); other references are Hartkopf & Yoss (1982); Luck (1982); Kjaergaard (1984); Faber et al. (1985); Lambert et al. (1986); Norris (1986); Burkhart & Coupry (1988); Laird, Carney, & Latham (1988); Knude (1989); Luck & Bond (1989); Eggen (1991, 1998); Geisler, Claria, & Minniti (1991); Taylor (1991, 1999); Xu (1991); Friel & Janes (1993); Thogersen, Friel, & Fallon (1993); Worthey et al. (1994); Bartkevicius & Lazauskaite (1996, 1997); Claria, Piatti, & Osborn (1996); Zakhozhaj & Shaparenko (1996); Fry & Carney (1997); Flynn & Morell (1997); Schiavon, Barbuy, & Singh (1997); Takeda & Takada-Hidai (1998); Adelman (1999); Bartasiute, Ezhkova, & Lazauskaite (1999); Cenarro et al. (2001); Gray, Graham, & Hoyt (2001); Haywood (2001); Andrievsky et al. (2002); Venn et al. (2002), based on different spectroscopic or photometric methods. Note that the only two metal-poor stars (HD 94028 and SAO 102986) in the JHC84 catalog have been excluded in our analysis so that we are eventually left with 334 objects in the GS83 plus JHC84 total sample.

A total of 409 theoretical SEDs have been collected from the ATLAS grid, while from the NextGen library we extracted a set of 314 theoretical flux distributions composed by 164 plane-parallel models for dwarfs with K and plus 150 spherical models for giants with K and . The (, )-space coverage of the two grids is shown in Fig. 1.
In order to consistently compare empirical and theoretical libraries, we degraded both GS83 and JHC84 spectra with a Gaussian kernel of FWHM = 25 Å, rebinning the output at constant steps of Å. The same procedure has been applied to the ATLAS and NextGen SEDs, sampled at the same set of wavelength points. The effect of this low-resolution approach on the results of our analysis (especially on the calibration of the temperature scale), will be discussed in some detail in Sec. 4 and 5.
3.3 Fitting procedure
A “best fit” for the (, ) fundamental parameters (assuming ) was searched for each star in the GS83 and JHC84 samples by matching the observed SED with both ATLAS and NextGen libraries. As described in full detail in Bertone (2001) and Bertone & Buzzoni (2001), our method basically relies on a minimization of the statistical variance in the relative flux domain, as a measure of the similarity between target spectrum and theoretical SEDs across the reference grid.
 |
 |
 |
|
 |
 |


Operationally, the spectrum of the i-th target star is compared with the j-th synthetic SED along the common wavelength range, deriving a residual function
| (1) |
in the flux logarithm domain, as shown in Fig. 2. The offset constant, k, in eq. (1) is such as
| (2) |
so that
| (3) |
while the standard deviation
| (4) |
provides a measure of the spectral likelihood between observations and theoretical models.444The freedom degrees for are settled by the number of wavelength points after spectrum broadening, as described in previous section. The underlying hypothesis of our approach is of course that a non-degenerate trend exists for the function in the (, ) phase space, so that a univocal best solution can be found for a given input SED. For each target star we then mapped the distribution by matching the whole grid of synthetic model atmospheres, and searched for an absolute minimum, , after performing a cubic spline interpolation of the points at each gravity. This allowed us to locate the best-fitting values of and with a nominal resolution of and , respectively.
Statistical uncertainty of fiducial distinctive parameters was estimated by means of a one-tail test on the value of , at a 95% confidence level.555The freedom degrees of the distribution, in this case are simply , cf. previous footnote. The confidence interval was translated into an equivalent (, ) error box relying on a first-order estimate of and evaluated around the region in the phase space. An example of the fitting procedure for a star in the GS83 sample is displayed in Fig. 3.
The robustness of our minimization procedure was probed by means of a bootstrap test. We added a 10% noise to the full set of Kurucz synthetic SEDs and tried our best fit to recover the original (i.e. unperturbed) reference parameters. In all cases, the correct was identified, typically with a 1–2% uncertainty, a value that raised to 5–8% just for the few poorest cases. As far as surface gravity is concerned, the nominal values of the reference models were picked up within a dex in 98% of the cases (i.e. with only 8 outliers out of 409 fitted SEDs).
4 Temperature scale calibration
Out of the total of 334 stars in the GS83 and JHC84 libraries, a consistent fitting solution for the () fundamental parameters was found for 272 and 230 stars, respectively, using ATLAS and NextGen reference grids. Most of the remaining unfitted objects are M and O-B stars, that is at the two extreme edges of the temperature scale, where a fair value for cannot be confidently located within the theoretical model grid. The NextGen code, however, has proven to be marginally more efficient in the fit of M stars (of a total of 38 stars in this class, 10 were successfully matched by ATLAS and 24 by NextGen).
The accuracy of the ATLAS and NextGen model libraries in the fit of GS83 and JHC84 stars can be analysed by means of Fig. 4. In the two panels of the figure we report the distribution of the residual standard deviation of the best fits for stars in the two observed samples. As a common feature in the two plots, note that NextGen provides in general a poorer fit compared to the ATLAS code. This is particularly evident for G and K stars ( K), where ATLAS is a factor of two better than NextGen in terms of best-fitting variance. The figure also shows that the accuracy in the definition of the temperature scale directly depends on the wavelength baseline of the spectra. Compared with the GS83 stars, in fact the JHC84 fits are slightly poorer, given a narrower spectral range for the JHC84 library (i.e. Å vs. 7500 Å for GS83).

The incomplete treatment of molecular opacity in the Kurucz code is well evidenced in both plots of Fig. 4, facing the sharp increase of standard deviation in the fit of late-K and M stars. The same problem seems to affect, at a similar level, also the NextGen fits confirming in any case a still unsolved and pervasive discrepancy of the theory to self-consistently reproduce cool stars.

The temperature scale resulting from the ATLAS and NextGen fits is displayed in Fig. 5. We compared with a number of empirical mean loci for dwarfs and giants including the Johnson (1966) classical compilation and the Böhm-Vitense (1981) scales for hot stars. We also considered the recent calibration of F0–K5 giant stars from Alonso, Arribas, & Martínez-Roger (1999) and the extension to late-M giants of Perrin et al. (1998), which includes the Ridgway et al. (1980) data. Furthermore, Di Benedetto (1998) provided accurate and systematic measures of the effective temperature for a wide sample of 537 stars of A to K spectral type, within an internal accuracy of % in the individual estimates, using the surface brightness technique (Wesselink, 1969), calibrated by means of the angular diameters of 22 stars. His mean locus for the dwarf and giant subsamples is superposed to our data in Fig. 5.
In general, we find a consistent trend between the scale from the theoretical fits of the GS83 and JHC84 stars and the empirical reference calibrations. A more scattered distribution of our points derives, of course, from the fact that these are fits of individual stars, instead of a mean locus, and because of the luminosity and metallicity spread of the sample. Only one clear outlier appears among the GS83 stars in the top-right panel of Fig. 5; this is star HD 156252 (alias 38 Oph), classified by GS83 as a type A1V star with (dereddened) (B-V) = mag and color excess E(B-V) = 0.16 mag. The exceedingly blue color calls for a warmer fitting temperature ( K) with ATLAS, while also the NextGen match suggests a temperature in excess of 10 000 K, as no minima of the standard deviation [see eq. (4)] were present below that temperature.
This star is reportedly among the most reddened ones in the GS83 list but if one accounts, alternatively, for a much lower color excess as reported in the Hipparcos catalog [namely E(B-V) = 0.015 mag], then the evident discrepancy between fitting temperature and spectral type could easily be recovered.


To better single out the differences between the NextGen and ATLAS fits, in Fig. 6 and 7 we considered separately the main sequence (MK class V) and giant (MK III) star subsamples displaying the between our fitting temperature and the reference calibration of Böhm-Vitense (1981) and Johnson (1966), for dwarfs, and Alonso et al. (1999) and Perrin et al. (1998), for giants. Fig. 6 shows that both ATLAS and NextGen grids tend to fit F to M stars with a 4–8% warmer effective temperature, the excess being in general higher for the NextGen fits.
The situation is somehow different for giants (see Fig. 7) with a drift in the point distribution with respect to the Alonso et al. (1999) and Perrin et al. (1998) calibration (but, again, with the NextGen output marginally warmer than the ATLAS one).
As for the Kurucz models, a glance to Fig. 2 makes clear that part of the bias toward higher fitting temperatures might derive from the blanketing effects in the ultraviolet region of the stellar SED, shortward of 4000 Å. The residual scatter in this spectral region is in fact a major source to the global variance when matching observed SED and theoretical models, thus sensibly constraining the choice of the best-fit solution. More entangled is the situation for NextGen models, which adopt a different chemical mix representative of solar metallicity. While in fact ATLAS relies on the Anders & Grevesse (1989) solar abundances, NextGen assumes the revised values by Jaschek & Jaschek (1995); for , this makes NextGen Fe abundance slightly lower compared to ATLAS (namely, [FeNG/Fe dex). However, this feature could hardly explain the observed trend in the calibration as a Fe-poorer model atmosphere should actually display a lower blanketing, thus allowing a cooler temperature to fit the observed SED of stars (see, in this sense, the quantitative discussion by Buzzoni et al., 2001).666 As a cross-check in this regard, we tried a fit of the GS83 stars relying on the Kurucz library with [Fe/H] instead of solar. From the operational point of view, this should roughly mimic the NextGen solar case. As expected, the GS83 fitting temperatures are in average 50–100 K cooler than the values obtained with the ATLAS library at [Fe/H] = 0.
4.1 Bolometric corrections
Our best-fitting procedure with model atmospheres allows in principle a straightforward estimate of bolometric luminosity for stars in the GS83 and JHC84 samples. When coupled with the individual magnitudes, this could eventually supply a measure of the bolometric correction ().

In order to set the scale, for our calculations we identified the theoretical template for the Sun as the ATLAS model SUNK94, with (, , [M/H]) = (5777 K, 4.44, 0.0) according to Castelli, Gratton, & Kurucz (1997). Its theoretical SED has been convolved with the filter profile of Bessell (1990) and photometric zero points were tuned up such as to have (Bessell, Castelli, & Plez, 1998).
The for each star in the GS83 and JHC84 samples is then computed as:
| (5) |
Note that in eq. (5), the magnitude derives from the convolution of the observed spectrum while the offset “k” (that properly scales the bolometric magnitude of the theoretical fitting SED) is from eq. (3).
Our results are compared, in Fig. 8, with other standard calibrations for dwarf and giant stars vs. spectral type. We considered in particular the work of Flower (1977) and Johnson (1966) and its later revisions of Bessell (1991) (for late-K and M dwarf stars), and Code et al. (1976) (for hot O–B stars). When necessary, bolometric scales were shifted consistently such as to assure .
The final reference calibration for and vs. spectral type for dwarf and giant stars according to ATLAS and NextGen is summarized in Table 1. Given the limited spectral coverage of the observed spectra, our bolometric extrapolation suffers, of course, from intrinsic uncertainties at the two extremes edges of the temperature scale, where a substantial fraction of stellar energy is emitted outside the optical range. The calibration of Table 1 for B and M stars should therefore be taken with some caution since it critically relies on the theoretical input physics.
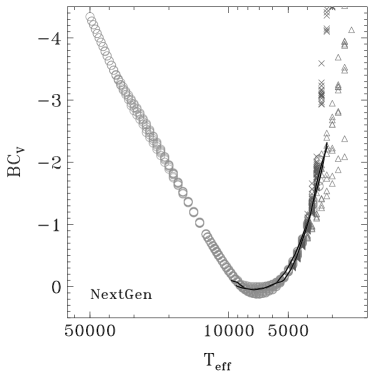
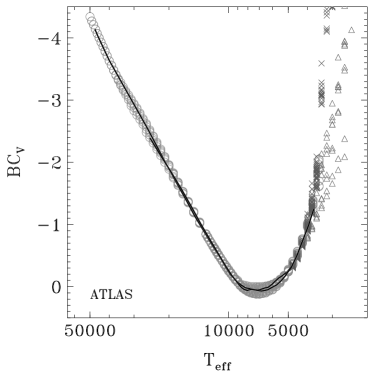
A more extensive discussion of this issue, from a fully theoretical point of view, has been carried out by Bessell, Castelli, & Plez (1998) based on the ATLAS and NMARCS model predictions, the latter ones as from the calibrations of Plez et al. (1992) for giants and Edvardsson et al. (1993) for dwarfs. A comparison of our results with those of Bessell, Castelli, & Plez (1998) is shown in Fig. 9 comforting, however, on the general agreement of our output.
| ATLAS | NextGen | ||||||||
|---|---|---|---|---|---|---|---|---|---|
| Dwarfs | Giants | Dwarfs | Giants | ||||||
| Sp. Type | BC | BC | BC | BC | |||||
| B0 | 30430 | -2.99 | 28640 | ||||||
| B1 | 25830 | -2.56 | 24910 | -2.39 | |||||
| B2 | 22000 | -2.14 | 22020 | -2.11 | |||||
| B3 | 18920 | -1.75 | 19470 | -1.84 | |||||
| B4 | 16490 | -1.41 | 17230 | -1.56 | |||||
| B5 | 15310 | -1.27 | |||||||
| B6 | 13090 | -0.85 | |||||||
| B7 | 11940 | -0.64 | 12330 | -0.74 | |||||
| B8 | 11040 | -0.47 | 11230 | -0.52 | |||||
| B9 | 10330 | -0.31 | 10340 | -0.33 | |||||
| A0 | 9780 | -0.19 | 9640 | -0.18 | 9730 | -0.10 | |||
| A2 | 8980 | -0.07 | 8700 | 0.00 | 9030 | -0.07 | 9200 | -0.02 | |
| A3 | 8680 | -0.03 | 8400 | 0.04 | 8740 | -0.03 | 8930 | 0.00 | |
| A5 | 8200 | 0.02 | 8050 | 0.06 | 8300 | 0.02 | 8530 | 0.02 | |
| A7 | 7810 | 0.03 | 7880 | 0.05 | 7910 | 0.04 | |||
| F0 | 7290 | 0.05 | 7660 | 0.04 | 7380 | 0.04 | 7810 | 0.04 | |
| F2 | 6980 | 0.05 | 7410 | 0.05 | 7080 | 0.03 | 7470 | 0.05 | |
| F5 | 6570 | 0.02 | 6830 | 0.07 | 6680 | 0.02 | 6730 | 0.03 | |
| F7 | 6330 | 0.01 | 6360 | 0.05 | 6450 | 0.02 | 6350 | -0.00 | |
| G0 | 6030 | -0.04 | 5720 | -0.03 | 6140 | -0.01 | 5850 | -0.05 | |
| G2 | 5860 | -0.08 | 5420 | -0.10 | 5950 | -0.03 | 5620 | -0.07 | |
| G5 | 5590 | -0.14 | 5160 | -0.18 | 5670 | -0.08 | 5410 | -0.08 | |
| G7 | 5400 | -0.17 | 5070 | -0.22 | 5490 | -0.14 | 5250 | -0.11 | |
| K0 | 5060 | -0.24 | 4850 | -0.30 | 5190 | -0.23 | 4870 | -0.27 | |
| K2 | 4820 | -0.33 | 4540 | -0.49 | 4980 | -0.33 | 4550 | -0.47 | |
| K5 | 4480 | -0.52 | 3960 | -0.98 | 4630 | -0.52 | 4090 | -0.90 | |
| K7 | 4290 | -0.71 | 3720 | -1.25 | 4380 | -0.70 | 3860 | -1.17 | |
| M0 | 4010 | -0.97 | 3990 | -1.05 | 3670 | -1.51 | |||
| M1 | 3890 | -1.04 | 3860 | -1.19 | 3630 | -1.61 | |||
| M2 | 3720 | -1.37 | 3550 | -1.74 | |||||
| M3 | 3420 | -1.94 | |||||||
| M4 | 3450 | -1.77 | 3180 | -2.26 | |||||
| M5 | 3320 | -2.02 | |||||||
| M6 | 3190 | -2.32 | |||||||
5 Comparing template SED along the spectral-type sequence
The whole set of synthetic templates for the GS83 and JHC84 stars prompts a straightforward comparison of the ATLAS vs. NextGen code performances taking into account in a self-consistent way the effect of the different input physics on the match of SED for real stars along the O M spectral-type sequence. For our test we especially relied on the subset of 216 objects from the GS83 and JHC84 catalogs for which a nominally best fit exists both for the ATLAS and NextGen grids over the temperature range K.
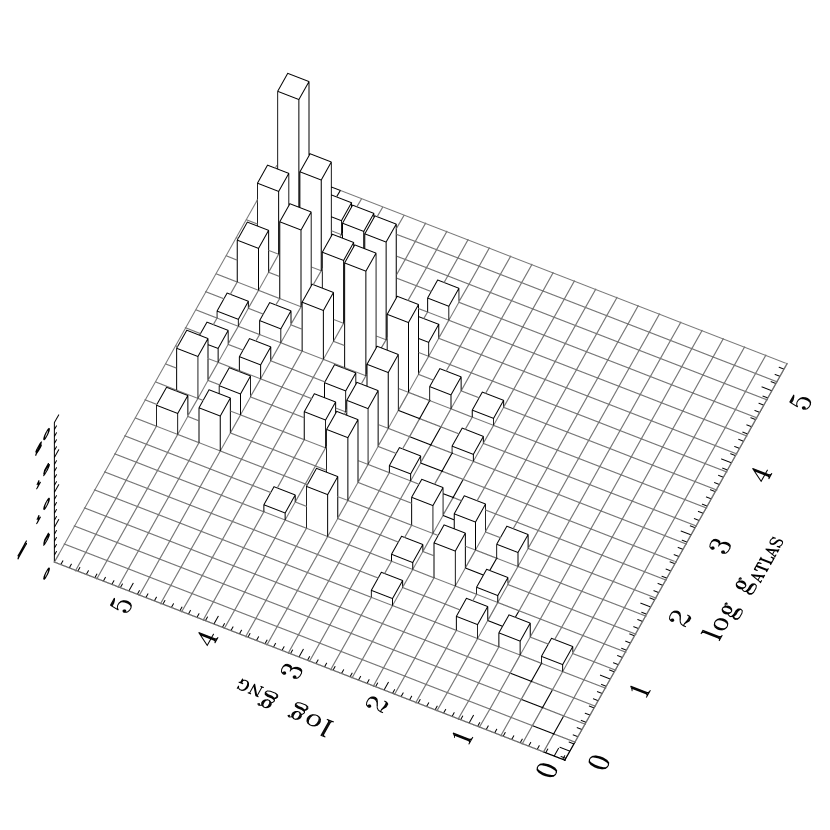
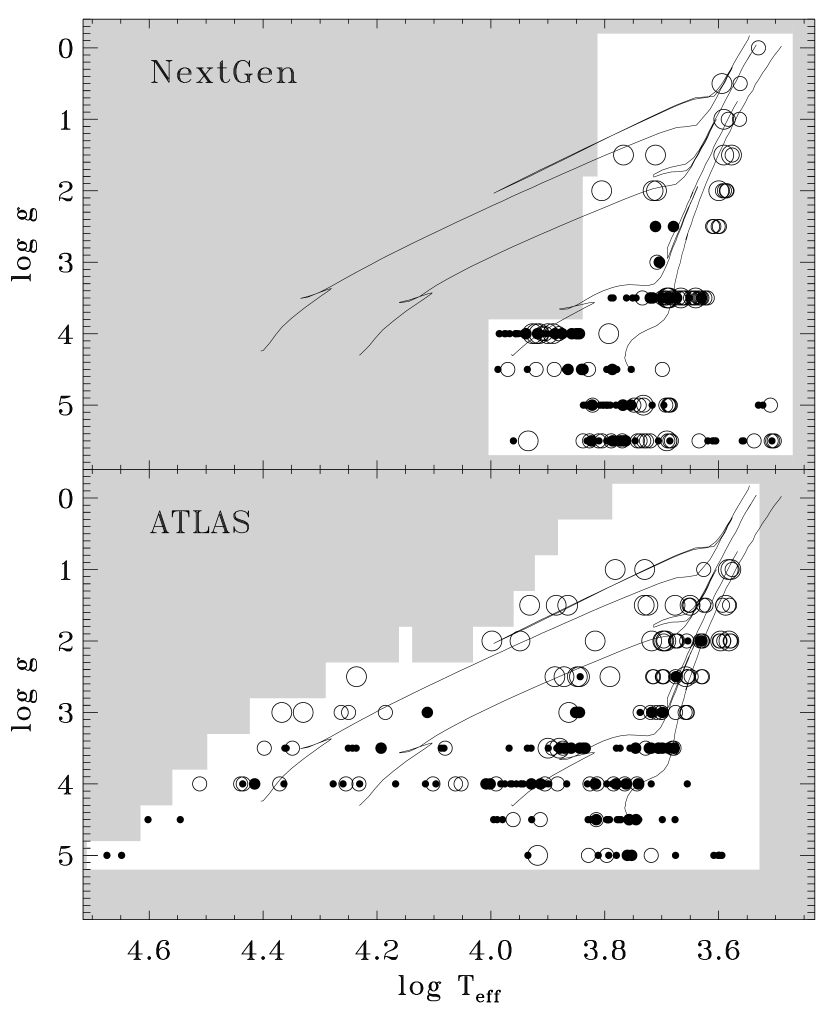
A first interesting feature, when comparing the two sets of theoretical templates, like in Fig. 10, concerns the distribution of the fitting gravity. It is evident from the histogram that for an important fraction of target stars NextGen tends to fit with a higher gravity with respect to ATLAS. This actually led to a number of “catastrophic outliers” among the giant and supergiant stars in the GS83 and JHC84 samples, as shown in Fig. 11. In the NextGen plot, in fact, (upper panel of the figure) 23 out of the 100 MK I–III stars are unexpectedly located in the high-gravity region of the diagram, pertinent to class V dwarfs, with a nominal “best-fit” gravity of dex. Conversely, only four such gravity outliers are present in the ATLAS diagram (lower panel) with a gravity of dex.
A similar trend can also be recognized for the fitting stellar temperature , as we have been discussing in Sec. 4. Again, Fig. 12 shows that NextGen estimates are in average 2% in excess with respect to the ATLAS best-fit values, with a sensibly higher scatter for the JHC84 stars (see lower panel in the figure), partly depending on the shorter wavelength baseline compared to the GS83 set of spectra [ dex for the JHC84 sample vs. a value of 0.018 dex for the GS83 stars].
The tendency of NextGen to overestimate temperature and gravity can be illustrated by means of Fig. 13, where we map the distribution of the fit variance () across the theoretical grid for two MK III giants in the GS83 and JHC84 samples.777This plot is basically a projected view of the 3-D fitting surface, like that shown in Fig. 3 One sees from the plots that actually two physically distinct solutions exist for these stars, one that correctly locates both K2III giants in the low-temperature low-gravity range [namely, (, ) (4500 K, 3.0 dex) in our example] and adopts a spherical model (i.e. in the domain), and the other (nominally better) one that assumes a plane-parallel geometry but places stars at a much higher dex and K. This apparent “bimodality” in the solution space is also well evident in the JHC84 panel of Fig. 12, where giant star distribution appears to split in two distinct sequences depending whether the spherical or the plane-parallel solution prevails as a best fit.888The same effect is not equally evident in the GS83 plot due to the dominant fraction of dwarf stars in this sample.
Note, by the way, that some correlation in the temperature and gravity excess, when fitting empirical SED with theoretical models, can naturally be expected on the basis of the arguments pointed out by Buzzoni et al. (2001). Their experiments showed in fact that a correspondingly higher gravity should likely be required to recover, at medium-high resolution, “too shallow” absorption features as predicted by a too warmer model forced to match the low-resolution SED of a given star. According to Buzzoni et al. (2001), such a tight dependence between and can be written in the form
| (6) |
A consistent trend in this sense is confirmed in Fig. 14, that reports the temperature and gravity differences between ATLAS and NextGen fiducial solutions for the 216 target stars in common.
5.1 Sphericity effects on theoretical SED
Such a different behaviour of ATLAS and NextGen model output directly calls, of course, for a distinct physical approach in the calculation of the inner structure of the stellar atmosphere. This is especially true for giant stars, where the plane-parallel model atmospheres of ATLAS are to be compared with the spherical-shell geometry of NextGen. The impact of geometry on the emerging flux of the theoretical models has been first assessed in a pioneering work by Scholz & Tsuji (1984) on the atmospheres of M and C stars, and more extensively explored in the recent years by Plez and collaborators (Plez, 1990; Plez et al., 1992).


Basically two intervening effects modulate the integrated SED of spherical models with respect to their corresponding plane-parallel cases. First, as a general trend for fixed and , spherical model atmospheres tend to display a lower electronic pressure and a cooler temperature profile vs. stellar spatial coordinate (i.e. radius or optical depth, cf. e.g. Scholz & Tsuji, 1984). To some extent, this is the physical consequence of the decreasing gravity when moving outward of stellar photosphere; with a lower gravity, in fact, thermodynamical equilibrium in the external layers readjusts such as to allow a lower pressure of the electronic plasma (because of an increased mean distance between atoms and a higher dumping potential for the bound-bound and bound-free transitions) and a cooler temperature, still sufficient however to “sustain” the atmosphere structure.
As a result, for fixed and , the SED of a “spherical” star is therefore expected to display sharper absorption lines and a “redder” continuum. Among others, this should also reflect in a less severe blanketing absorption (see in this sense the experiments of Hauschildt et al., 1999b) as a consequence of a reduced blend of metal absorption lines at short wavelength.
A second related effect that should be dealt with, when comparing plane-parallel and spherical model atmospheres, concerns limb darkening. Due to the geometry, in fact, the integrated flux that emerges from a “spherical” star receives a more important contribution from low-gravity cooler layers, and appears therefore in average “cooler” with respect to its corresponding plane-parallel model (Claret & Hauschildt, 2003).
This feature also emerges from the recent results of Fields et al. (2003) on the microlensing surface scanning of the K3 giant star related to the EROS BLG2000-5 event. Surface brightness measurements for this star are in fact inconsistent with the NextGen best-fit predictions at higher than 10, and indicate that the derived vertical structure of the theoretical atmosphere sensibly overestimates limb-darkening effects.
6 Summary and conclusions.
In this work we carried out a combined comparison of the two theoretical codes ATLAS (Kurucz, 1992b) and NextGen (Hauschildt et al., 1999a, b) for stellar atmosphere synthesis. Our tests relied on the fit of a set 334 target stars of nearly solar metallicity, spanning the whole sequence of spectral types and luminosity class, observed in the optical range by Gunn & Stryker (1983) and Jacoby et al. (1984).
For about 80% of this sample we obtained an estimate of the physical parameters (, ) of stars and their related statistical uncertainty by means of an original fitting procedure that matched the observed SED with the ATLAS and NextGen model grids.

This provided a twofold application of our results; from one hand, we achieved a self-consistent and independent calibration of the temperature and bolometric scale for giant and dwarf stars vs. empirical classification parameters (i.e. spectral type and MK luminosity class). On the other hand, the comparison of the synthetic templates from the ATLAS and NextGen model grids allowed us to directly assess the relative performances of each theoretical code to reproduce SED of real stars according to the different input physics adopted.
The comparison of our results with several empirical calibration scales in the literature (see Sec. 4) led to the following main conclusions:
i) the good fitting accuracy () of both theoretical models in reproducing SED of early-type stars (spectral type F and earlier) drastically degrades at lower , especially for K stars, where both ATLAS and NextGen codes still fail to properly account for the increasing contribution of molecular features in the spectra of stars. In general, ATLAS is found to provide a systematically better fit (a factor of two lower residual ) than NextGen along the whole B K spectral-type sequence, although the NextGen grid, due to its lower limit, more efficiently matches M stars.
ii) Comparing with empirical calibrations, both ATLAS and NextGen tend, in average, to predict warmer (by 4–8%) for both giant and dwarf stars of fixed spectral type. As for the ATLAS models, this effect has probably much to do with the imperfect treatment of metal blanketing at short wavelength (as extensively discussed, for instance, by Castelli, Gratton, & Kurucz, 1997), while the case of NextGen seems more entangled.
This issue has been further explored in Sec. 5 by comparing the ATLAS vs. NextGen template sequences for 216 stars in the GS83 and JHC84 catalogs with nominal best fit in the K temperature range. As a general feature, NextGen best-fit solutions are found to predict a temperature and gravity excess with respect to the corresponding ATLAS solutions for given target stars. The effect is especially evident for MK I–III objects, where the NextGen fails to correctly settle and sensibly overestimates surface gravity in about 25% of the cases vs. 4% of ATLAS. This misclassification partly derives from a lower capability of NextGen spherical models to reproduce the SED of giant stars, compared to the fit with the plane-parallel geometry. In most cases the latter proved in fact to be formally more accurate, leading however to a less physical combination of the fundamental parameters of stars.
An in-depth analysis of the fit accuracy for SED of target stars shows that, to some extent, the NextGen and excess is correlated, as a consequence of a sort of “degeneracy” in the solution space (Buzzoni et al., 2001). The effect is likely magnified in our framework when considering that, for low-gravity stars, ATLAS model atmospheres assume standard plane-parallel layers while NextGen adopts a spherical-shell geometry. Because of a more important contribution of external atmosphere layers to the integrated emerging flux in the case of the NextGen output, for fixed and this implicitly calls for a “redder” theoretical SED and a reduced blanketing absorption of metal blends at short wavelength, as a consequence of “sharper” spectral features.
The possible overestimate of the limb-darkening effects, as a consequence of the adopted vertical structure of NextGen model atmospheres, seems also a critical issue in this regard, as indicated by the recent observations of the EROS BLG2000-5 microlensing event.
References
- Adelman (1999) Adelman, S. J. 1999, MNRAS, 310, 146
- Allard, Hauschildt, & Schweitzer (2000) Allard, F., Hauschildt, P. H., & Schweitzer, A. 2000, ApJ, 539, 366
- Alonso, Arribas, & Martínez-Roger (1999) Alonso, A., Arribas, S., & Martínez-Roger, C. 1999, A&AS, 140, 261
- Anders & Grevesse (1989) Anders, E., & Grevesse, N. 1989, Geochim. Cosmochim. Acta, 53, 197
- Andrievsky et al. (2002) Andrievsky, S. M., Kovtyukh, V. V., Luck, R. E., et al. 2002, A&A, 381, 32
- Bartasiute, Ezhkova, & Lazauskaite (1999) Bartasiute, S., Ezhkova, O. V., & Lazauskaite, R. 1999, Baltic Astron., 8, 465
- Bartkevicius & Lazauskaite (1996) Bartkevicius, A., & Lazauskaite, R. 1996, Baltic Astron., 5, 1
- Bartkevicius & Lazauskaite (1997) Bartkevicius, A., & Lazauskaite, R. 1997, Baltic Astron., 6, 499
- Bertone (2001) Bertone, E. 2001, Ph. D. Thesis, Università di Milano
- Bertone & Buzzoni (2001) Bertone, E., & Buzzoni, A. 2001, in proc. of the First COROT-MONS-MOST Ground-based Support Workshop (Ghent 11-12/01/2001), Ed. C. Sterken, Brussel Univ., p. 75 (see also astro-ph/0105409)
- Bessell (1990) Bessell, M. S. 1990, PASP, 102, 1181
- Bessell (1991) Bessell, M. S. 1991, AJ, 101, 662
- Bessell, Castelli, & Plez (1998) Bessell, M.S., Castelli, F., & Plez, B. 1998, A&A, 333, 231
- Böhm-Vitense (1958) Böhm-Vitense, E. 1958, Zeitschrift für Astrophysik, 46, 108
- Böhm-Vitense (1981) Böhm-Vitense, E. 1981, ARA&A, 19, 295
- Bruzual & Charlot (1993) Bruzual, A., G., & Charlot, S. 1993, ApJ, 405, 538
- Burkhart & Coupry (1988) Burkhart, C., Coupry, M. F. 1998, A&A, 338, 1073
- Buzzoni et al. (2001) Buzzoni, A., Chavez, M., Malagnini, M. L., & Morossi, C. 2001, PASP, 113, 1365
- Castelli, Gratton, & Kurucz (1997) Castelli, F., Gratton, R. G., & Kurucz, R. L. 1997, A&A, 318, 841
- Cayrel de Strobel et al. (1997) Cayrel de Strobel, G., Soubiran, C., Friel, E. D., Ralite, N., & François, P. 1997, A&AS, 124, 299
- Cayrel de Strobel et al. (2001) Cayrel de Strobel, G., Soubiran, C., & Ralite, N. 2001, A&A, 373, 159
- Cenarro et al. (2001) Cenarro, A. J., Cardiel, N., Gorgas, J., Peletier, R. F., Vazdekis, A., & Prada, F. 2001, MNRAS, 326, 959
- Claret & Hauschildt (2003) Claret, A., & Hauschildt, P. H. 2003, A&A, 412, 241
- Claria, Piatti, & Osborn (1996) Claria, J. J., Piatti, A. E., Osborn, W. 1996, PASP, 108, 672
- Code et al. (1976) Code, A.D., Davies, J., Bless, R.C., & Hanbury Brown, R. 1976, ApJ, 203, 417
- Di Benedetto (1998) Di Benedetto, G. P. 1998, A&A, 339, 858
- Edvardsson et al. (1993) Edvardsson, B., Andersen, J., Gustafsson, B., Lambert, D. L., Nissen, P. E., & Tomkin, J. 1993, A&A, 275, 101
- Eggen (1991) Eggen, O. J. 1991, AJ, 102, 1826
- Eggen (1998) Eggen, O. J. 1998, AJ, 115, 2397
- Faber et al. (1985) Faber, S. M., Friel, E. D., Burstein, D., & Gaskell, C. M. 1985, ApJS, 57, 711
- Fanelli, O’Connell, & Thuan (1987) Fanelli, M. N., O’Connell, R. W., & Thuan, T. X. 1987, ApJ, 321, 768
- Fields et al. (2003) Fields, D.L., et al. (the PLANET collaboration) 2003, ApJ, 596, 1305
- Flower (1977) Flower, P. J. 1977, A&A, 54, 31
- Flynn & Morell (1997) Flynn, C., & Morell, O. 1997, MNRAS, 286, 617
- Friel & Janes (1993) Friel, E. D., Janes, K. A. 1993, A&A, 267, 75
- Fry & Carney (1997) Fry, A. M., & Carney, B. W. 1997, AJ, 113, 1073
- Geisler, Claria, & Minniti (1991) Geisler, D., Claria, J. J., & Minniti, D. 1991, AJ, 102, 1836
- Girardi et al. (2000) Girardi, L., Bressan, A., Bertelli, G., & Chiosi, C. 2000, A&AS, 141, 371
- Gray, Graham, & Hoyt (2001) Gray, R. O., Graham, P. W., & Hoyt, S. R. 2001, AJ, 121, 2159
- Guiderdoni & Rocca-Volmerange (1987) Guiderdoni, B., & Rocca-Volmerange, B. 1987, A&A, 186, 1
- Gunn & Stryker (1983) Gunn, J. E., & Stryker, L. L. 1983, ApJS, 52, 121, GS83
- Gustafsson et al. (1975) Gustafsson, B., Bell, R. A., Eriksson, K., & Nordlund, Å 1975, A&A, 42, 407
- Gustafsson et al. (2003) Gustafsson, B., Edvardsson, B., Eriksson, K., Mizuno-Wiedner, M., Jörgensen, U. G., Plez, B. 2003, in proc. of Stellar Atmosphere Modeling, ASP Conf. Ser. Vol. 288, Ed. I. Hubeny, D. Mihalas, and K. Werner (San Francisco: ASP) p.331
- Hartkopf & Yoss (1982) Hartkopf, W. I., & Yoss, K. M. 1982, AJ, 87, 1679
- Hauschildt et al. (1996) Hauschildt, P. H., Baron, E., Starrfield, S., & Allard, F. 1996, ApJ, 462, 386
- Hauschildt et al. (1999a) Hauschildt, P. H., Allard, F., & Baron, E. 1999a, ApJ, 512, 377
- Hauschildt et al. (1999b) Hauschildt, P. H., Allard, F., Ferguson, J., Baron, E., & Alexander, D. R. 1999b, ApJ, 525, 871
- Haywood (2001) Haywood, M. 2001, MNRAS, 325, 1365
- Holweger (1970) Holweger, H. 1970, A&A, 4, 11
- Jacoby et al. (1984) Jacoby, G. H., Hunter, D. A., & Christian, C. A. 1984, ApJS, 56, 257, JHC84
- Jaschek & Jaschek (1995) Jaschek, C., & Jaschek, M. 1995, The Behaviour of Chemical Elements in Stars (Cambridge: Cambridge Univ. Press)
- Johnson (1966) Johnson, H. L. 1966, ARA&A, 4, 193
- Kjaergaard (1984) Kjaergaard, P. 1984, A&AS, 56, 313
- Knude (1989) Knude, J. 1989, A&AS, 81, 215
- Kurucz (1970) Kurucz, R. L. 1970, SAO Special Report, no.309
- Kurucz (1979) Kurucz, R. L. 1979, ApJS, 40, 1,
- Kurucz (1992a) Kurucz, R. L. 1992a, RMxAA, 23, 45
- Kurucz (1992b) Kurucz, R. L. 1992b, Proc. IAU Symp. 149, eds. B. Barbuy, A. Renzini, Kluwer, Dordrecht, p.225
- Kurucz (1995) Kurucz, R. L. 1995, CD-ROM No. 13, ATLAS9 Stellar Atmosphere Programs and 2 km/s Grid, revised
- Laird, Carney, & Latham (1988) Laird, J. B., Carney, B. W., & Latham, D. W. 1988, AJ, 95, 1843
- Lambert et al. (1986) Lambert, D. L., Gustafsson, B., Eriksson, K., Hinkle, K. H. 1986, ApJS, 62, 373
- Luck (1982) Luck, R. E. 1982, ApJ, 263, 215
- Luck & Bond (1989) Luck, R. E., & Bond, H. E., 1989, ApJS, 71, 559
- Norris (1986) Norris, J. 1986, ApJS, 61, 667
- Perrin et al. (1998) Perrin, G., Coudé Du Foresto, V., Ridgway, S. T., Mariotti, J.-M., Traub, W. A., & Carleton, N. P. 1998, A&A, 331, 619
- Pickles (1985) Pickles, A. J. 1985, ApJS, 59, 33
- Plez (1990) Plez, B. 1990, Mem. SAIt, 61, 765
- Plez et al. (1992) Plez, B., Brett, J.M, Nordlund, Å 1992, A&A, 256, 551
- Ridgway et al. (1980) Ridgway, S. T., Joyce, R. R., White, N. M., & Wing, R. F. 1980, ApJ, 235, 126
- Salasnich et al. (2000) Salasnich, B., Girardi, L., Weiss, A., & Chiosi, C. 2000, A&A, 361, 1023
- Schiavon, Barbuy, & Singh (1997) Schiavon, R. P., Barbuy, B., & Singh, P. D. 1997, ApJ, 484, 499
- Scholz & Tsuji (1984) Scholz, M., & Tsuji, T. 1984, A&A, 130, 11
- Strom & Kurucz (1966) Strom, S. E., & Kurucz, R. L. 1966, JQSRT, 6, 591
- Takeda & Takada-Hidai (1998) Takeda, Y., & Takada-Hidai, M. 1998, PASJ, 50, 629
- Taylor (1991) Taylor, B. J. 1991, ApJS, 76, 715
- Taylor (1999) Taylor, B. J. 1999, A&AS, 134, 523
- Thogersen, Friel, & Fallon (1993) Thogersen, E. N., Friel, E. D., & Fallon, B. V., 1993, PASP, 105, 1253
- Tsuji (1976) Tsuji, T. 1976, PASJ, 28, 543
- Venn et al. (2002) Venn, K. A., Brooks, A. M., Lambert, D. L., Lemke, M., Langer, N., Lennon, D. J., & Keenan, F. P. 2002, ApJ, 565, 571
- Wesselink (1969) Wesselink, A. J. 1969, MNRAS, 144, 297
- Worthey et al. (1994) Worthey, G., Faber, S. M., Gonzalez, J. J., & Burstein, D. 1994, ApJS, 94, 687
- Xu (1991) Xu, Z. 1991, A&A, 248, 367
- Zakhozhaj & Shaparenko (1996) Zakhozhaj, V. A., & Shaparenko, E. F. 1996, Kinematika Fiz. Nebesn. Tel., 12b, 20