SNEWS: The SuperNova Early Warning System
Abstract
This paper provides a technical description of the SuperNova Early Warning System (SNEWS), an international network of experiments with the goal of providing an early warning of a galactic supernova.
1 Introduction
The famous supernova SN1987A in the Large Magellanic Cloud (LMC) brought the field of supernova neutrino astrophysics to life. Two water Cherenkov detectors, Kamiokande II and IMB, detected 20 events between them [1, 2, 3, 4]; two scintillator detectors, Baksan and LSD [5, 6] also reported observations. The sparse SN1987A neutrino data were sufficient to confirm the baseline model of gravitational collapse causing type II SNe and to put limits on neutrino properties (such as a mass limit of around 20 eV.) To make distinctions between different theoretical models of core collapse and supernova explosions and to extract more information about neutrino properties, we await the more copious neutrino signal which the new generation of large neutrino experiments will detect from the next such event in our Galaxy.
When the core of a massive star at the end of its life collapses, less than 1% of the gravitational binding energy of the neutron star will be released in the forms of optically visible radiation and the kinetic energy of the expanding remnant. The remainder of the binding energy is radiated in neutrinos, of which 1% will be electron neutrinos from an initial “neutronization” burst and the remaining 99% will be neutrinos from the later cooling reactions, roughly equally distributed among flavors. Average neutrino energies are expected to be about 13-14 MeV for , 14-16 MeV for , and 20-21 MeV for all other flavors. The neutrinos are emitted over a total timescale of tens of seconds, with about half emitted during the first 1-2 seconds. Reference [7] summarizes the expected features of a core collapse neutrino signal; more recent simulation work can be found in e.g. [8, 9].
A core-collapse supernova in our Galaxy will bring a wealth of scientific information. The neutrino signal will provide information about the properties of neutrinos themselves and astrophysicists will learn about the nature of the core collapse. One unique feature of the neutrino signal is that it is prompt — neutrinos emerge on a timescale of tens of seconds, while the first electromagnetic signal may be hours or days after the stellar collapse. Therefore, neutrino observation can provide an early alert that could allow astronomers a chance to make unprecedented observations of the very early turn-on of the supernova light curve; even observations of SNe as young as a few days are rare for extra-galactic supernovae. The environment immediately surrounding the progenitor star is probed by the initial stages of the supernova. For example, any effects of a close binary companion upon the blast would occur very soon after shock breakout. UV and soft x-ray flashes are predicted at very early times. Finally, there may be entirely unexpected effects—no supernova has ever been observed very soon after its birth. Although the neutrino signal will be plentiful in practically all galactic core collapses, it is possible that there will be little or no optical fireworks (the supernova “fizzles”); the nature of any observable remnant would then be very interesting.
This paper focuses on the prompt alert which is possible using the neutrino signal. We will describe the technical aspects of the system.
Section 2 gives an overview of SNEWS, and Section 3 briefly covers the expected signal in current detectors. Section 4 discusses some issues associated with SNEWS. Section 5 introduces the individual experiments’ monitors. Section 6 covers SNEWS implementation and defines the coincidence conditions and alert scheme. Section 7 describes the results of the “high-rate” system test performed in 2001. Section 8 describes the alert to the astronomical community. Section 9 gives future directions. The final section summarizes.
2 SNEWS Overview
The SNEWS (SuperNova Early Warning System) collaboration is an international group of experimenters from several supernova neutrino-sensitive experiments. The primary goal of SNEWS is to provide the astronomical community with a prompt alert for a galactic supernova. An additional goal is to optimize global sensitivity to supernova neutrino physics, by such cooperative work as downtime coordination.
The idea of a blind central coincidence computer receiving signals from several experiments has been around for some time (e.g. [10].) In addition to the basic early warning advantages of a neutrino detector, there are several benefits from a system involving neutrino signals from two or more different detectors. First, if the supernova is distant and only weak signals are recorded, a coincidence between signals from different detectors effectively increases the sensitivity by allowing reductions in alarm thresholds and allowing one to impose a minimum of (possibly model-dependent) expectations on the form of the signal. Second, even if a highly sensitive detector such as Super-K is online, requiring a coincidence among several detectors effectively reduces the “non-Poissonian” background present for any given detector and enormously increases the confidence in an alert.111“Non-Poissonian” refers to background alarms whose rate cannot be well predicted according to a constant-background-rate Poisson distribution. Detector effects such as flashing phototubes and electronics problems fall under this category. Rates may also be locally Poissonian, just non-stationary. Background alarms at widely separated laboratories are highly unlikely to be correlated. Without the additional confidence from coincident neutrino observations, it would be very difficult for any individual detector to provide an automated alert to astronomers. Finally, using signals from more than one detector, there is some possibility for determining the direction of the source when a single detector alone can provide no information (see reference [11].) Unfortunately triangulation is in practice quite difficult to do promptly, and cannot point as well as individual detectors.
An important question for SNEWS is: how often is a galactic supernova likely to occur? Estimates vary widely, but are typically in the range of about one per 30 years (e.g. [13].) This is frequent enough to have a reasonable hope of observing one during the next five or ten years, but rare enough to mean that we must take special care not to miss anything when one occurs.
The charter member experiments of SNEWS are Super-Kamiokande (Super-K) in Japan, the Sudbury Neutrino Observatory (SNO) in Canada and the Large Volume Detector (LVD) in Italy222MACRO[14] was another charter member, and was involved with SNEWS until it turned off in 2000.. Representatives from AMANDA, IceCube, KamLAND, Borexino, Mini-BooNE, Icarus, OMNIS, and LIGO participate in the SNEWS Working Group, and we hope will eventually join the active coincidence.
There is currently a single coincidence server, hosted by Brookhaven National Laboratory. We expect that additional machines will be deployed in the future. The BNL computer continuously runs a coincidence server process, which waits for alarm datagrams from the experiments’ clients, and provides an alert if there is a coincidence within a specified time window (10 seconds for normal running.) We have implemented a scheme of “GOLD” and “SILVER” alerts: GOLD alerts are intended for automated dissemination to the community; SILVER alerts will be disseminated among the experimenters, and require human checking.
As of this writing, no inter-experiment coincidence, real or accidental, has ever occurred (except in high rate test mode), nor has any core collapse event been detected within the lifetimes of the currently active experiments.
3 The Supernova Signal and Current Detectors
There are several classes of detectors capable of observing neutrinos from gravitational collapse. Most supernova neutrino detectors are designed primarily for other purposes, e.g. for proton decay searches, solar and atmospheric neutrino physics, accelerator neutrino oscillation studies, and high energy neutrino source searches.
| Detector type | Material | Energy | Time | Point | Flavor |
|---|---|---|---|---|---|
| scintillator | C,H | y | y | n | |
| water Cherenkov | H20 | y | y | y | |
| heavy water | D20 | NC: n | y | n | all |
| CC: y | y | y | , | ||
| long string water Cherenkov | H2O | n | y | n | |
| liquid argon | Ar | y | y | y | |
| high Z/neutron | Pb, Fe | y | y | n | all |
| radio-chemical | 37Cl, 127I, 71Ga | n | n | n |
Table 1 gives a brief overview of the supernova neutrino detector types. More detailed information about supernova detection capabilities can be found in reference [16]. To summarize briefly: scintillator and water Cherenkov detectors are sensitive primarily to ; those with neutral current capabilities (heavy water, high Z/neutron, and also water Cherenkov and scintillator to some extent) are sensitive to all flavors. Water Cherenkov and heavy water detectors have significant pointing capabilities. All except radiochemical can see neutrinos in real-time. All have energy resolution except long string water Cherenkov and radiochemical.
Table 2 lists specific supernova neutrino detectors and their capabilities [18, 19, 20, 22, 24, 25, 27, 29, 30]. For a summary of supernova neutrino capabilities of future detectors, please see [31, 32]. 333Note that the currently running Super-K II (after reconstruction in 2002) has nearly the same supernova sensitivity as Super-K I; a slight increase in energy threshold due to loss of phototubes will cause only a few percent loss of total signal events. 444Gravitational wave detectors deserve some note here. Large interferometer experiments such as LIGO, Virgo, GEO, TAMA and ACIGA[33] as well as cryogenic antennas belonging to the IGEC collaboration[34] may have the capability of detecting gravitational wave signals from asymmetric supernova explosions (although the details of a stellar collapse gravitational wave signal are not yet well understood.) When these detectors reach maturity over the next several years, they will become an important part of a stellar collapse network, and combined neutrino and gravitational wave data will be an extremely valuable source of information for testing supernova models. The gravitational wave signal may be more prompt even than the neutrino signal, and in fact, may provide a for a neutrino time of flight mass measurement (see e.g. [36].) The scientific potential from combined gravitational wave and neutrino signals from stellar collapse is exciting and largely unexplored territory.
| Detector | Type | Mass | Location | # of events | Status |
|---|---|---|---|---|---|
| (kton) | @8.5 kpc | ||||
| Super-K | H2O Ch. | 32 | Japan | 7000 | running |
| SNO | H2O, | 1.4 | Canada | 300 | running |
| D2O | 1 | 450 | |||
| LVD | scint. | 1 | Italy | 200 | running |
| AMANDA | long string | M0.4/pmt | Antarctica | running | |
| Baksan | scint. | 0.33 | Russia | 50 | running |
| Mini-BooNE | scint. | 0.7 | USA | 200 | running |
| KamLAND | scint. | 1 | Japan | 300 | running |
| Borexino | scint. | 0.3 | Italy | 100 | 200x |
| Icarus | liquid argon | 2.4 | Italy | 200 | 200x |
| OMNIS | high Z (Pb) | 2 | USA | 2000 | proposed |
| LANNDD | liquid argon | 70 | USA | 6000 | proposed |
| UNO/Hyper-K | H2O Ch. | 600-1000 | USA/Japan | 100,000 | proposed |
4 The Three “P”’s
In order to make the best use of a neutrino burst supernova alert, the astronomical community needs the “three P’s”: “prompt”, “pointing” and “positive”. We comment on each of these below.
4.1 “Prompt”
The alert must be as prompt as possible to catch the early stages of shock breakout, which occurs within hours (or less) of core collapse. We estimate an alert dissemination time of five minutes or less for an automated (GOLD) alert. A SILVER alert involving human-checked alarms would take longer, optimistically 20 minutes or so, but perhaps longer.
4.2 “Pointing”
Clearly, the more accurately we can point to a core collapse event using neutrino information, the more likely it will be that early light turn-on will be observed by astronomers. Even for the case when no directional information is available (e.g. for a single scintillator detector online) it is still useful for astronomers to know that a gravitational collapse event has occurred. However any pointing information at all is extremely valuable. The question of pointing to the supernova using the neutrino data has been examined in detail in reference [11]. There are two ways of pointing with neutrinos: first, individual detectors can make use of asymmetric reactions for which the products “remember” the direction of the incoming neutrino. Second, the timing of the neutrino signals in several detectors can be used to do triangulation. Reference [11] estimates roughly pointing accuracy for Super-K and pointing accuracy for SNO, given a galactic center core collapse. Triangulation is less promising, and presents practical difficulties: it requires immediate and complete exchange of event-by-event information, which is difficult in practice, and we do not plan to attempt it promptly.
We do not anticipate that SNEWS will disseminate pointing information as part of the initial alert message in the short term (although this may change); this information will come from the individual experiments, and may not be available immediately. Each experiment establishes its own protocol for making estimated pointing information available.
4.3 “Positive”:
There must be no false supernova alerts to the astronomical community. A single experiment cannot realistically decrease the false alert rate to zero, since there will always be some residual rate of false alerts from Poissonian and non-Poissonian sources. However, by requiring an inter-experiment coincidence, the false alert rate can be decreased to nearly zero: this is the great strength of SNEWS. We have chosen the nominal acceptable average false alert rate to be one per century. The following section is devoted to the question of ensuring a false alert rate which is sufficiently low.
4.3.1 False Alerts
The fundamental motivation for the SNEWS coincidence is the reduction of false alerts. We categorize the possibilities for false alerts below:
-
1.
Accidental Coincidences
Accidental (random) coincidences imply that there was no actual association with an astronomical event and that the coincidence occurred by chance. The rough expected rate of accidental coincidences can be calculated by assuming equal, constant, uncorrelated alarm rates for each experiment.
Figure 1 shows the average interval between accidental alerts for an -fold coincidence of experiments, for a 10 second coincidence window and an individual experiment background alarm rate of one per week. This plot shows that an individual experiment alarm rate of one per week is acceptable only if four or fewer experiments are online, or if a three-fold coincidence if required; otherwise a lower individual experiment rate is required. Based on these considerations, the requirement for an experiment to participate in SNEWS is an average alarm rate of no more than 1 per week. We may adjust the criteria defined in this paper if more than four experiments are running.
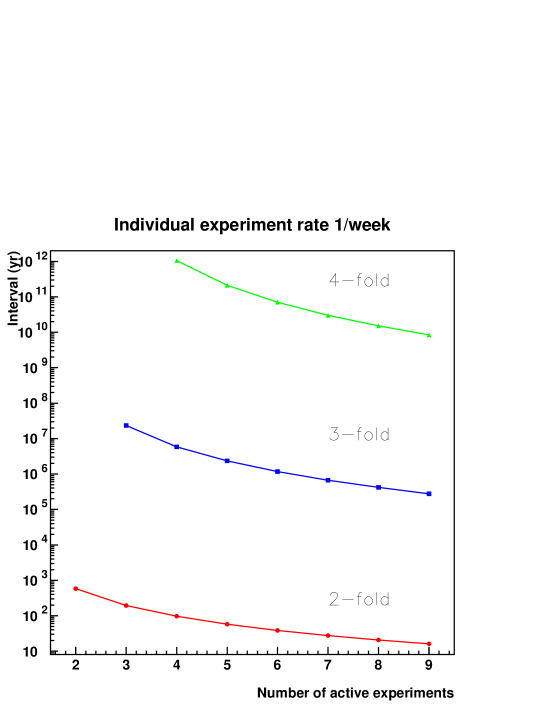
Figure 1: Average interval between accidental alerts for an -fold coincidence of experiments, for a 10 second coincidence window and a uniform individual experiment background alarm rate of one per week. In reality, individual alarm rates are not strictly Poissonian and change with time. However, they may be Poissonian on shorter time scales, and so long as instantaneous individual rates do not exceed a certain value, the accidental coincidence rate can be made as small as desired. In Section 6.6 we detail how we deal with potentially changing alarm rates.
-
2.
Non-astrophysical Correlated Bursts
The possibility of some correlation between bursts seen in the individual detectors, which is not astrophysical in origin, exists to the extent that some credible coupling can be shown to exist between detectors. For participating detectors that may be physically close to one another there are a large number of possible couplings from a shared local environment (electrical noise, ambient pressure, seismic, etc..) For participating detectors that are very well separated from one another one has to invoke more fanciful and substantially less probable couplings such as solar activity, solar flares, or widescale upper atmospheric electrical disturbances. The most credible coupling for separated detectors may well be the seismic one, but even that is not really plausible.
-
3.
Malicious Actions
A fake alert sent to the astronomical community by hackers breaking in to our machines is a remote possibility, but one which we view seriously. Breaching several machines at the individual experiments and creating false alarms at the client datagram level would have the same end effect, but would require more knowledge of the detailed and widely different operation of several detectors, so we feel this is much less of a concern. To prevent malicious actions, we take a serious approach to the security of the server and the connections to it. We require that the server be housed at a national laboratory with designated personnel to take responsibility for the security and maintenance of the machine.
4.4 Privacy
Another “P” (relevant to experimenters more than to astronomers) is “Privacy”. To satisfy inter-experiment privacy needs (and in addition to help ensure secure data transmission), we have set up a formal set of rules for data sharing and have structured the collaboration around these rules. The “SNEWS subgroup” is a working group of a few people per experiment, designated by our Advisory Board (spokespeople of the active experiments.) Only subgroup members have access to the alarm data from all experiments. Subgroup members agree not to propagate information without explicit approval from the Advisory Board.
5 Description of Individual Experiments’ Supernova Triggers
In this section we will describe briefly the online supernova monitoring systems of Super-K, SNO and LVD, which provide alarm input to the SNEWS coincidence. The supernova capabilities of the detectors are well known and details can be found elsewhere [16]; other details of the triggers, monitoring systems and analyses are also described elsewhere [38, 40, 43]. Although each of these three experiments takes a somewhat different approach to real-time monitoring, every one is sensitive to a galactic supernova and can provide an alarm on a timescale of minutes.
A note on SNEWS terminology: an “alarm” refers to a supernova neutrino burst candidate detected by an individual experiment, according to conditions defined for that experiment. An “alert” refers to a coincidence between alarms, and the conditions which define an alert are described in section 6. This section describes the individual experiment alarm conditions only. The detailed neutrino event information comprising the alarm bursts is not sent to the coincidence server.
5.1 Super-K Supernova Online Monitor
The Super-K supernova alarm system involves software that does a prompt pre-analysis before full reconstruction. Roughly two-minute chunks of data called “subruns” are sent from the event builder via “express-line” to a dedicated supernova burst monitor machine, skipping the usual steps required before data are sent to the offline processes. The low energy trigger events are then searched for clusters in several time windows (0.5 seconds, 2 seconds, 10 seconds.)
If the “pre-multiplicity” thresholds are exceeded for any of these time windows, then the “pre-candidate” is passed to a second monitor program for further analysis. Standard noise reduction algorithms similar to those applied for solar neutrino analysis [44] are applied, and the search is performed again, this time on events passing the cuts and with a higher energy threshold. Full energy reconstruction is not done (to save time), but vertices and directions are reconstructed. If any cluster passes a second pass multiplicity threshold, the multiplicity in a 20 second time window is counted; in addition, the mean distance between event positions in the cluster, , where is the number of pairs, is calculated. Background supernova alarms arise from muon spallation events and “flashing” tubes. Both of these types of fake clusters have event vertex distributions which are highly non-uniform, and which will yield small values. Candidate clusters with sufficiently high and are considered to be supernova candidates.
Because reconstruction of thousands of events in a real supernova burst ( 5000 events) could require an hour or more to fully analyze, pre-alarms are generated after 100 events if a candidate is found (roughly a 1 minute timescale.)
If an alarm burst candidate is found, a datagram is sent to the SNEWS server, and shiftworkers are alerted. Detailed information about the candidate is made available to shiftworkers (present 24 hours a day onsite.) The shiftworker checks for the existence of spallation muons, examines reconstructed vertices and their goodness, and also checks the exploded view of the PMT hit pattern. A preliminary estimate of the supernova direction from elastic scattering is available at this point. If a good supernova candidate is identified, an offline process will re-analyze to provide full, precise reconstruction within a few hours.
5.2 SNO Supernova Online Monitor
At SNO, custom readout electronics collect the PMT data underground and pass that information to an event builder. Built events are then sent to an event dispatcher process running on a surface computer, which is used for online monitoring. A fully detailed description will be found elsewhere [40]. Summarized here is the basic machinery of the trigger, which consists of three distinct levels which are fast and completely automated:
-
•
Level 1: This is the burst monitor which looks in the datastream for a certain number of events above a certain energy threshold within a certain time window. At present the multiplicity threshold is set to 30 events above approximately 4 MeV in a 2 second time window which provides a good sensitivity to a galactic supernova. Dynamic thresholds are used whenever calibration sources are introduced in the detector. Bursts satisfying the multiplicity criteria are written to a data file and then transferred to an analysis machine.
-
•
Level 2: At this level events are calibrated and analyzed on an event-by-event basis. The main task of this second-level trigger is to identify events with anomalous time and charge as well as events with geometric signatures of particular detector pathologies in order to cut them from the burst data set. For example, events with low charge to number of hit ratio usually indicate electrical pickup. A set of data cleaning cuts are applied which are meant to reject known instrumental background with a very high efficiency. Cherenkov events pass those cuts with very little sacrifice.
-
•
Level 3: If more than 35% of the events composing a burst survive the data cleaning cuts, an alert is sent to the SNEWS server and a dialout computer contacts the members of the SNO supernova trigger group. In the meantime a more in-depth analysis is performed to extract fitted vertices and direction cosines. The relative event fractions occurring in the / volumes are extracted and a search algorithm uses the events’ direction cosines to find the electron scattering (ES) events, which are expected to best convey information about the direction of the possible supernova.
The Level 2 analysis produces a set of histograms which are mainly useful for quick burst diagnostic by the operator and any interested party. Besides hit and time distributions, crate/slot/channel occupancies are provided, which are expected to be flat for a supernova signal. The Level 3 analysis produces a set of histograms using fitted vertices in both the light and heavy water volumes as well as angular distribution of the events’ fitted directions. Each burst is catalogued and automatically archived on the SNO private WWW server.
5.3 LVD Supernova Online Monitor
In the LVD experiment the scintillator counting rate is continuously
monitored by a DAQ task, which examines all data collected in real
time. A simple and fast muon rejection algorithm makes a
pre-selection of -candidate signals, registered by the experiment
with a ns time precision. This first selection level
does not apply cuts on pulse energy and topological distribution.
A
separate on-line monitor task looks for burst candidates from the
reduced data stream. The search algorithm is based on a pure
statistical analysis of the time sequence of events including some
additional cuts. The code processes the sequence in order to
extract significant clusters of pulses having an expected frequency,
induced by the accidental background, lower than a predefined
threshold.
At this level, pulse energy is required to be in the
7-100 MeV range in order to avoid fluctuation effects at the edge of
energy threshold and problems due to electronic noise, as well as to
reject single counter muon signals. After these cuts the background
pulse frequency is found to be very stable and corresponds, for the
full LVD configuration, to Hz. The resulting -pulse
candidate time sequence, collected inside a 1000-pulse deep circular
buffer, is processed by the alarm module of the monitoring
code. Buffered events are processed in fixed time windows s originating at the start run time. For each asynchronous
window the number of contained single pulses is obtained.
Then the Poissonian probability to have events in
the cluster is calculated according to: , where
is the mean expected number of pulses due to
background rate. To optimize sensitivity, the online frequency
is evaluated each time a new pulse is inserted into the buffer. The
alarm threshold probability is obtained from the above expression by
fixing a global alarm frequency . The predictive capability of
the selection algorithm has been checked with real and simulated data
as a function of the required global alarm frequency (.)
Finally, to reduce the number of false
alarms, for each selected candidate a topological check is
applied. For a real supernova burst candidate a uniform distribution
of pulses between involved counters is expected. If not, counters
with abnormal high counting are excluded and the resulting cluster is
re-analyzed. Surviving clusters are considered to be candidate
alarms, and corresponding datagrams are sent to the SNEWS servers; all
related information is saved for further analysis. Online
event buffering and processing gives less than 2 minutes delay between
the burst time and the alarm notification. The LVD shiftworker and
experts within the collaboration are notified.
6 SNEWS Coincidence Implementation
This section describes the hardware setup and software developed for SNEWS.
6.1 The Coincidence Server
There is currently a single SNEWS workstation running Linux at Brookhaven National Laboratory, which serves as the coincidence server. Previously, we had had servers at LNGS and Kamioka, but moved to BNL in fall of 2003, for ease of security and maintenance with the resources available there. The software has capabilities for dealing with multiple servers, and more may be added in the future. A second, identical machine is kept running and in synch with the primary server, so that immediate failover is possible in case of a problem with the primary server.
The coincidence server remains behind the BNL firewall. Only very limited access to SNEWS subgroup members and the BNL system administrator is permitted. In addition, the server is housed in a physically secure location. If additional servers are added to the network, they will be subject to similar security requirements.
6.2 Coincidence Software
The SNEWS software involves client and server programs which implement a simple datagram exchange via socket, employing TCP/IP protocol, and encrypted via OpenSSL. The code is designed to be easily portable to diverse operating systems.
The client software is provided to the individual experiments in the form of a library of subroutines that may be called by an experiment’s supernova watch software to initiate a datagram transfer. The package also provides standalone tools for testing.
The server software runs in a standalone mode, and most of the time simply waits to receive datagrams from the clients. It maintains two queues: a normal queue and a “high-rate” queue, for test alarms. When an alarm datagram is received, it is placed on a queue according to its flag (see Section 6.5.) One month’s worth of alarms are stored in the queue. Received alarms are written to disk, and are read in from disk if the server is stopped and restarted.
Every time an alarm is received, the last 24 hours’ worth of alarms on the queue is searched for a coincidence. See Section 6.6 for detailed coincidence conditions.
When a client initiates a connection, the server employs several layers of checks to validate the origin of the datagram. Only the IP addresses of the client machines of the involved experiments are allowed to submit packets. In addition the client and server exchange certificates which have been verified by the SNEWS Certificate Authority, and the server rejects the connection if any check fails.
6.3 SNEWS Shifts
SNEWS subgroup members share shiftwork on a regular cycle. Shift duties include a check twice daily to ensure that the server is running, that network connectivity is up, and that communication capability is in good order.
Individual experiment alarm rates are monitored by SNEWS subgroup members, so that any long term increase of rate over the 1/week limit may be addressed.
6.4 SNEWS Operational Modes
We have established a well-defined operational mode for SNEWS, which we expect to develop in a series of managed transitions between operational modes. For instance, new experiments or new coincidence servers will be added or removed. Each operational mode is identified by a number and the date when it came into effect, and will specify in detail the participants, the coincidence conditions, the alert classifications, and the procedures for action in case of different alarm conditions. The following sections outline the conditions for the operational mode we anticipate for the near future.
6.5 SNEWS Packet Types and Flags
Each participating experiment may generate and send to the server different types of alarm datagrams. The alarm datagrams include a packet type, and a level flag. The packet type can be PING, ALARM, or RETRACTION. The level flag can be TEST, GOOD, POSSIBLE, RETRACTED or OVERRIDE. Datagrams having packet field values which do not belong to any of these categories are discarded by the server.
Packet Types
-
•
PING: Ping packets are used for test purposes only and cause nothing more than a message printed to the coincidence server log.
-
•
ALARM: Alarm packets contain information about individual experiment alarms; what the server does with them depends on the level flag.
-
•
RETRACTION: Retraction packets contain information about previously sent alarms to be retracted from the server’s alarm queues.
Level Flags
-
•
TEST: This flag indicates a datagram packet intended for test use as well as for any high-rate test mode.
-
•
POSSIBLE : This flag indicates an alarm generated during scheduled operations (i.e. maintenance, calibration, tests, etc.) or other known anomalous conditions. It is up to each experimental collaboration to set this flag inside the packet when appropriate.
-
•
GOOD: This flag indicates an alarm generated during normal detector conditions.
-
•
RETRACTED: This flag is set for retraction packets (note that this information is redundant—all packets of RETRACTION type will be retracted regardless of level flag.)
-
•
OVERRIDE: This flag indicates an alarm that has been confirmed as good.
6.6 Coincidence Definition
The general coincidence definition implemented in the coincidence code
may generate either of two types of alert: GOLD or SILVER.
A GOLD alert is generated if all of
following conditions (1 through 4) are met:
-
1.
There is a 2 or more -fold coincidence (by UT time stamp) within 10 seconds, involving at least two different experiments. (The time window refers to the maximum separation of any of the alarms in the coincidence.)
-
2.
At least two of the experiments involved are at physically separated laboratories. This condition is automatically satisfied for the current operational mode.
-
3.
Two or more of the alarms in the coincidence are flagged as GOOD. It is the responsibility of each participant experiment to flag the alarm sent to the SNEWS server(s) appropriately. The specific criteria for GOOD/POSSIBLE alarms are locally defined by each experiment.
-
4.
For at least two of the experiments involved in the coincidence, the rate of good alarms for several past time intervals 10 minutes, 1 hour, 10 hours, 1 day, 3 days, 1 week, 1 month preceding the first alarm of the coincidence candidate, must be consistent with the 1/week requirement.555These intervals represent real time, not live time, since full live time information will not be available to the coincidence server. We define the precise condition as follows: if an experiment sent alarms in each of the last intervals before the first event of the coincidence, then the Poisson probabilities for or more alarms in ,
,
for each interval , must each be greater than %. This corresponds to the condition that each must be less than for the preceding intervals for an alarm to be GOLD.
When the first criterion is satisfied, but at least one of the other criteria is not satisfied, the generated alert is flagged as SILVER. In this case the alert has to be checked by the individual experiment collaborations before any public announcement. No alert will be sent to the community by SNEWS until (and if) there is an upgrade to GOLD.
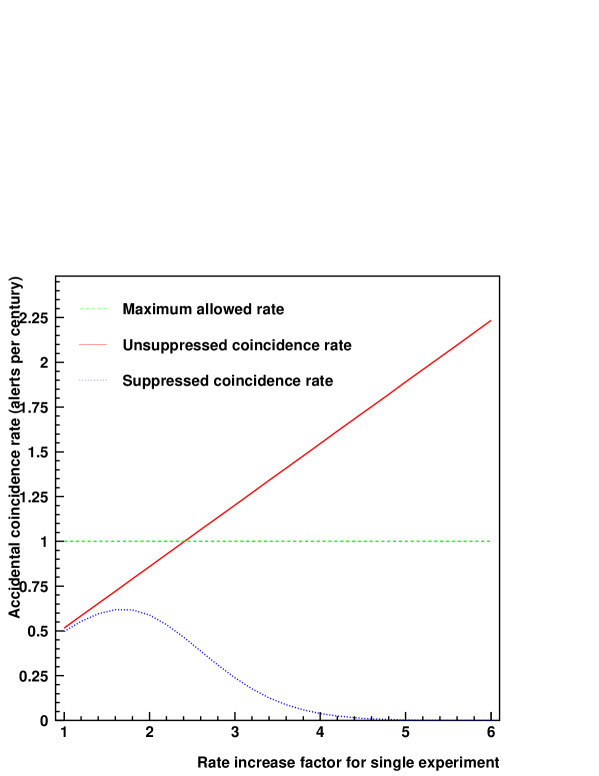
6.7 Rate-dependent GOLD Coincidence Suppression
The last criterion—demotion to SILVER based on past rate history—deserves some additional discussion. The purpose of this criterion is to protect against short term rate increases from one or more experiments. The suppression is effective: see Figure 2. However it comes at a slight cost: if one assumes a constant Poisson background rate of 1 per week for all three experiments, criterion 4 will result in demotion of about 4% of true GOLD alerts to SILVER, just due to Poisson fluctuations in the previous time windows. However, the protection against unexpected increases in background rate is probably worth this small loss (note that typically individual experiment alarm rates will be less than 1 per week anyway.)
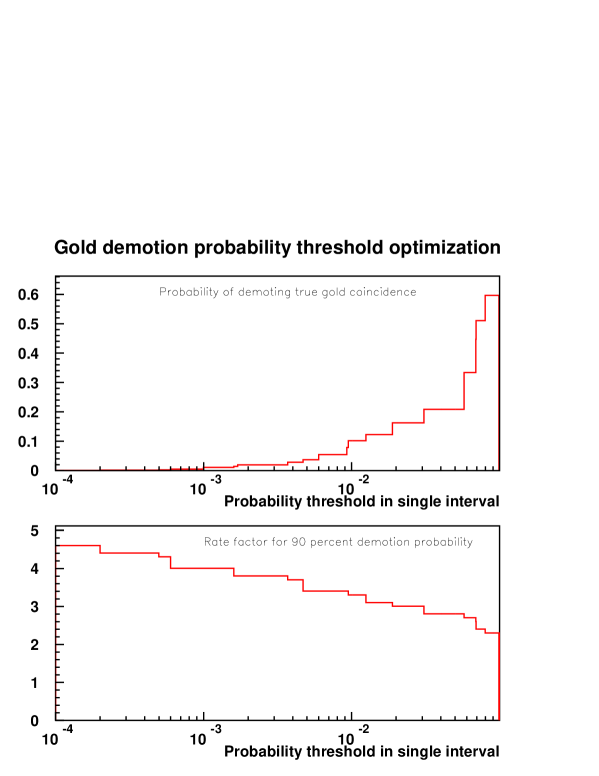
One might also worry that long term rate increases might cause increased demotion of true GOLD to SILVER. We have evaluated the overall average rate increase from any single experiment that would result in 90% of true coincidences being demoted. Figure 3 shows the effect of changing . The value of chosen was 0.5%, which gives fairly low true GOLD suppression (4%); and at this threshold any overall single experiment rate increase of more than a factor of 4 will result in demotion of 90% of coincidences.666 Note that long term average alarm rates will be monitored by shiftworkers, and subgroup members will be notified if rates of their experiments exceed the nominal 1 per week limit, so any such rate increase will be temporary. Also note that if alarm rate increases have clearly been corrected, by subgroup agreement on a case-by-case basis individual alarms may be retracted after the fact, so as not to decrease true GOLD coincidence efficiency.
We feel this GOLD and SILVER scheme strikes the right balance between danger of losing true coincidences due to too-stringent criteria and danger of issuing false alerts to astronomers.
6.8 Demotion and Promotion
Although we hope to avoid ever being in the situation where retraction of a GOLD alert is necessary, any experiment may reflag from GOOD (or POSSIBLE) to RETRACTED its own alarm after data checking. The server will then automatically reevaluate and reissue the alert based on alarms in the past day of its memory: the result may be still GOLD, demotion to SILVER, or no alert at all. For the latter case, the SNEWS subgroup is notified, and a RETRACTED alert will be issued to the same mailing list as for GOLD and posted on the public web page.
Experiments may also send OVERRIDE packets: a GOLD alert may also be generated if condition 1 is satisfied and at least one alarm in the coincidence is OVERRIDE and at least one is GOOD, regardless of whether the other conditions are satisfied. This case allows an override of past high-rate history demotion (or other conditions that could tag an alarm as POSSIBLE) for a human-checked alert.
Figure 4 summarizes the sequence of events and GOLD vs. SILVER decisions.

7 High Rate Test Results
During an approximately two-month period in April-June of 2001, Super-K, LVD and SNO subgroup members performed a “high rate test” of the coincidence software. The purpose was two-fold: first, to check the robustness of the software and work out any remaining bugs; and second, to increase confidence in our understanding of the expected coincidence rates. The test was highly successful.
The idea of the high rate test was to lower the thresholds of the experiments’ supernova monitors such that coincidence alerts increased to a non-negligible rate, due to the Poissonian nature of the data. Each experiment set its supernova monitor burst search parameters to yield a test alarm rate somewhere in the range of 10-100/day. In addition, in order to increase artificially the coincidence rate, the coincidence window was increased from its standard value of 10 seconds to 400 seconds.
The individual experiment alarm and coincidence rates were somewhat non-stationary, which was not unexpected. The results were analyzed via a “time-shift” method (see below) to show that alarms were uncorrelated, and that recorded coincidences were consistent with expected rates.
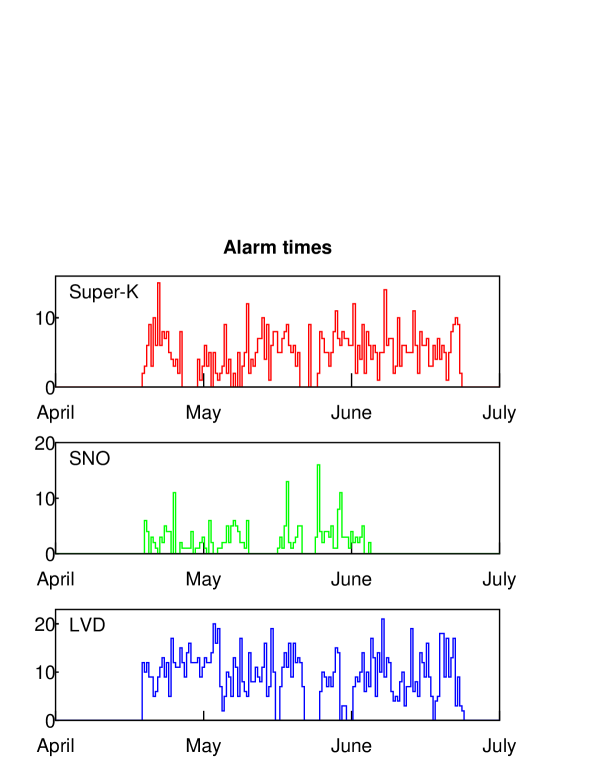
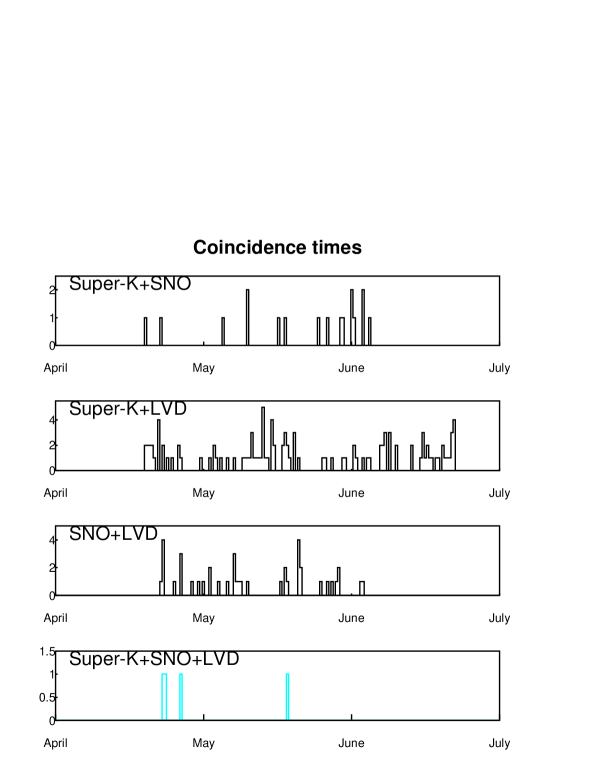
The alarms received as a function of time, and coincidences as a function of time, are shown in Figures 5 and 6. The numbers of individual alarms, and numbers of 2- and 3-fold coincidences are shown in Table 3. The rates are roughly constant over most periods, although there is clearly some “burstiness”.
Experiments can be “dead” to SNEWS for many reasons: actual detector deadtime, online supernova monitor problems, network problems, or coincidence server problems. To estimate the deadtime, we used the data themselves and counted improbably long gaps as deadtime. This method automatically takes into account dead time from all causes.
After removing the dead intervals, we calculated the overlapping live periods for each pair of detectors, as well as the 3-experiment overlap time. Note that there are some dead intervals common to all detectors due to network trouble; in particular the period from May 22-25 represents a problem with network availability to the test server at the Kamioka site (note that we expect very high uptime at the current BNL server site.)
Based on these known alarm rates and live periods, we then calculate expected accidental coincidence rates. For the purpose of comparison with expected coincidence rates, we have calculated the “raw” number of coincidences from the individual experiment alarms arriving at the server: the number of raw coincidences is defined as the number of times the individual experiment alarms are separated by a maximum test time window of =400 s.
Note that in the real case, according to the rate history-based demotion algorithm described above, the coincidence server will suppress redundant alerts. If there is more than one alarm from a given experiment within the time window, the server will send only one GOLD alert, corresponding to the coincidence of the first alarm from each experiment (assuming all conditions are satisfied) – whereas multiple “raw” coincidences would be counted for this cluster. Subsequent coincidences would be demoted to SILVER. The number of “unique” coincidences is the number of coincidences with different first alarm times.
The final column of Table 3 shows both “raw” and “unique” (in parentheses) numbers of coincidences. Figure 6 shows “unique” coincidences. The coincidence server output was checked to verify consistency with the calculated raw coincidences.
For stationary, uncorrelated Poisson point processes, the rate of -fold coincidences between detectors is given by
| (1) |
where is the coincidence window (the maximum separation of events for a coincidence), is the total common observing time, and is the number of events observed by the th detector. For example, for a 2-fold coincidence between detectors and , the expected number of coincidences is 2.
The uncertainties on the expectated rate values are calculated by propagating the uncertainties on the live time.
However, equation 1 is strictly valid only for stationary processes, and this assumption is clearly violated in our case (see Figure 5.) Therefore we take a different approach to calculate expected coincidence rates: to predict more generally the number of accidental coincidences from these non-stationary alarm sequences, we apply a “time-shift” method [46, 47, 49]: for any pair of detectors, we shift all of one experiment’s alarm time values by an offset , and determine the number of coincidences for that time offset value. This procedure is repeated for many values of ; the mean and standard deviation of the distribution of values then gives both the expected number of observed coincidences and its expected spread, which we then compare with the observed number of raw coincidences. Similarly, we time-shift one of the three experiment’s alarm time series by to determine the expected 3-fold coincidence rate.
The plot of versus time offset value should be flat, and show no spike at zero (or any other) offset, if there are no correlations between the different experiments’ alarm times. The results of this analysis for 2-fold coincidences are shown in Figure 7 (a similar plot, although with lower statistics, results for 3-fold coincidences.) We use time shifts ranging from -150 to 150 hours at 1000 second intervals. Live time is taken into account in the time-shifted sample by shifting the offset experiment’s live period by the same offset and then re-evaluating the overlap time. The mean and RMS values of the resulting shifted coincidence rates are used to determine the expected number of coincidences for each combination in Table 3.

Table 3 shows the expected and observed numbers of events. The expected numbers of coincidences from equation 1 do not exactly match the expected numbers from the time-shift method, even considering live time estimate uncertainty. Presumably this is due to the somewhat non-stationary nature of the alarm sequence. The number of observed coincidences do match the time-shift expectations well within the expected spread. In addition, the time shift plots show no evidence of correlations between experiments, as expected.
| Experiment | Common | SK/SNO/LVD | |||
| Combination | live time | alarms | expected | expected | observed |
| (days) | (eqn) | (shift) | raw (unique) | ||
| SK/SNO | 24.1 | 334/187/- | 24.1 | 24.9 7.0 | 30 (17) |
| SK/LVD | 44.6 | 576/-/1025 | 122.6 | 133.8 13.7 | 149 (112) |
| SNO/LVD | 27.7 | -/189/646 | 40.8 | 46.4 9.2 | 52 (41) |
| SK/SNO/LVD | 19.6 | 276/144/431 | 2.9 | 4.2 2.9 | 4 (4) |
Although these somewhat non-stationary data, taken at lowered threshold, do not necessarily imply that rates will also be non-stationary when thresholds are raised and running conditions are normal, one can never be completely sure that individual experiment rates will not increase unexpectedly. This is the motivation for the rate-dependent GOLD suppression scheme of section 6.7.
The coincidence server now has capability for continuous high rate testing, using tagged TEST alarms in parallel with normal alarms.
8 The Alert to the Astronomical Community
At the supernova early alert workshop of 1998, the conclusion from the astronomer working group [51] was that “the message will spread itself” and that SNEWS will need to do no more than send out emails to as many astronomers as possible. SNEWS maintains a mailing list of interested parties, including both professionals and amateurs, to be alerted in the case of a coincidence.
In an ideal case, the coincidence network provides the astronomical community with an event time and an error box on the sky at which interested observers could point their instruments. In a realistic case, the size of the error box is dependent on the location of the supernova and the experiments which are online, and may be very large (and at this time will not be available in the initial alert message.) However, members of the mailing list with wide-angle viewing capability (satellites, small telescopes) should be able to pinpoint an optical event quickly. Although an unknown fraction of galactic supernovae will be obscured by dust, many will be visible to amateurs with modest equipment.
Regardless of the quality of neutrino pointing available, however, the advance warning alone gives observers of all kinds valuable time to get to their observatories and prepare to gather data as soon as an accurate position is determined.
A Target of Opportunity proposal for the Hubble Space Telescope, “Observing the Next Nearby Supernova”, aiming to take advantage of early supernova light based on an early warning, was approved [52] for Cycle 13 and was operational for Cycles 8 through 12.
8.1 Amateur Astronomers
The large pool of skilled and well-equipped amateur astronomers is also prepared to help locate a nearby supernova. The editors of Sky & Telescope magazine have set up a clearinghouse for amateur observers in search for first light (and a precise optical position as early as possible) [53], via their AstroAlert service [54]. This was started by former editor-in-chief Leif Robinson, and has the continued support of current editor-in-chief Rick Fienberg. In collaboration with the American Association of Variable Star Observers, they have developed a set of criteria for evaluating amateur responses to an alert, so that a reliable precise position can be disseminated as early as possible. For instance: there must be at least two consistent reports, demonstrated lack of motion, lack of identification with known asteroid and variable star databases, variability consistent with supernova light curves and, if the information is available, a spectrum consistent with known supernova types.
On February 14 2003, Sky & Telescope performed a test for amateurs. A transient target (the asteroid Vesta at a near-stationary point in its retrograde loop) was selected, which at the time was about magnitude 6.7. Sky & Telescope issued an alert (very carefully tagged as a test) to their mailing list, with a given 13-degree uncertainty radius. They received 83 responses via the web response form, and more by email. The responses were of world-wide distribution, and although many observers experienced poor conditions, six were successful in identifying the target. From this experience, they have suggested refinements to optimize amateur astronomer strategy. A second test is planned soon, and should be a regular occurrence.
8.2 SNEWS Alerts
We maintain two alert mailing lists which will be sent to automatically by the SNEWS coincidence software in the case of an alert. The first is the GOLD alert list, which includes all astronomers who have signed up, including Sky & Telescope and the HST astronomers, and is to be an automated alert. The second mailing list will be for SILVER alerts, and is to be sent to neutrino experimenters only. These alerts will be checked out by shiftworkers at their respective experiments before an alert is issued; each experiment is responsible for making sure the SILVER alert messages reach shiftworkers. Each experimental collaboration defines its own protocol for acting on a SNEWS SILVER or GOLD alert.
For both SILVER and GOLD cases, a message containing the following information:
-
•
UTC time of the coincidence,
-
•
all detectors involved in the coincidence, and
-
•
the types of alarms (GOOD, POSSIBLE) for each experiment involved in the coincidence
will be automatically sent by the server to the SNEWS subgroup members. The information may also be posted to a restricted SNEWS subgroup page for SILVER, and a public page for GOLD.
To allow the confirmation of a SNEWS alert as really coming from SNEWS, any alerts will be public key signed using the SNEWS key. This key has the ID# 68DF93F7, and is available on the network of public PGP keyservers such as http://pgp.mit.edu/
Note that there is no restriction on individual experiments making any announcement based on individual observation in the case of absence of a SNEWS alert, SILVER or GOLD, or preceding or following any SNEWS alert message. Any individual experiment may publicly announce a supposed supernova signal following a dispatched SILVER alert which has not yet been upgraded to GOLD. In this case the information that a previous SILVER alert from the SNEWS server(s) has been received should be cited.
9 Status and Future Prospects
At the time of this writing, SILVER alerts only between Super-K and LVD are activated. We are working towards having the operational mode described in this paper to be activated in the very short term, comprising automated GOOD alarms from Super-K and LVD, but automated POSSIBLE alarms only from SNO, such that SNO will participate in a GOLD alert only if at least two other experiments’ GOOD alarms are present.
We also expect SNEWS to incorporate more galactic-supernova-sensitive neutrino detectors over the next few years. In addition, we may expand the network of servers with additional secure sites.
10 Summary
In summary, several supernova neutrino detectors are now online. If a stellar core collapse occurs in our Galaxy, these detectors will record signals from which a wealth of physical and astrophysical information can be mined.
An early alert of a gravitational collapse occurrence is essential to give astronomers the best chance possible of observing the physically interesting and previously poorly observed early turn-on of the supernova light curve. A coincidence of several neutrino experiments is a very powerful technique for reducing “non-Poissonian” false alarms to the astronomical community, in order to allow a prompt alarm. We have implemented such a system, currently incorporating several running detectors: LVD, SNO and Super-K. We expect to expand the network in the near future, and move to a more automated mode in the near future.
References
References
- [1] Hirata K S et al. 1987 Phys. Rev. Lett. 58 1490
- [2] Bionta R M et al. 1987 Phys. Rev. Lett. 58 1494
- [3] Bratton C B et al. 1988 Phys. Rev. D 37 3361
- [4] Hirata K S et al. 1988 Phys. Rev. D 38 448
- [5] Alekseev E N et al. 1987 JETP. Lett. 45 589
- [6] Aglietta M et al. 1987 Europhys. Lett. 3 1315
- [7] Burrows A et al. 1992 Phys. Rev. D 45 3361
- [8] Thompson T et al. 2003 Astrophys. J. 592 434
- [9] Liebendorfer M et al. Preprint astro-ph/0207036
- [10] Cline D B 1990 Proceedings of the Supernova Watch Workshop (Santa Monica)
- [11] Beacom J and Vogel P 1999 Phys. Rev. D 60 033007
- [12] [] (Beacom J and Vogel P 1999 Preprint astro-ph/9811350)
- [13] Tammann G A et al. 1994 Ap. J. Supp. 92 487
- [14] Ahlen S et al. 1992 Astropart. Phys. 1 11
- [15] [] Ambrosio M et al. 1998 Astropart. Phys. 8 123-133
- [16] Scholberg K 2000 Nucl. Phys. Proc. Suppl. 91 331
- [17] [] (Scholberg K 2000 Preprint hep-ex/0008044)
- [18] Aglietta M et al. 1992 Nuov. Cim. A 105, 1793
- [19] Fukuda S et al. 2003 Nucl. Instrum. Meth. A 501 418
- [20] Boger J et al. 2000 Nucl. Instrum. Meth. A 449 172
- [21] [] (Boger J et al. 2000 Preprint nucl-ex/9910016)
- [22] Jacobsen J E, Halzen F and Zas E 1994 Phys. Rev. D 49 1758
- [23] [] Jacobsen J E, Halzen F and Zas E 1996 Phys. Rev. D 53 7359
- [24] Bueno A, Gil-Botella I and Rubbia A 2003 Preprint hep-ph/0307222
- [25] Sharp M et al. 2002 Phys. Rev. D66 013012
- [26] [] (Sharp M et al. 2002 Preprint hep-ph/0205035)
- [27] Cadonati L et al. 2002 Astropart. Phys. 16 361
- [28] [] (Cadonati L et al. 2002 Preprint hep-ph/0012082)
- [29] R. N. Boyd et al. 2003 Nucl. Phys. A 718 222
- [30] C. K. Jung 2000 Preprint hep-ex/0005046
- [31] Homestake Collaboration 2003 NUSEL Science Book Preprint nucl-ex/0308018
-
[32]
Scholberg K 2003
http://mocha.phys.washington.edu/int_talk/WorkShops/Neutrino02/
Working_Groups/People/Scholberg_K/scholberg_thurs_solarstellarwg.pdf - [33] Hughes S A et al. 2001 Preprint astro-ph/0110349
- [34] Astone P et al. 2003 Phys. Rev. D 68 022001
- [35] [] (Astone P et al. 2003 Preprint astro-ph/0302482)
- [36] Arnaud N et al. 2000 Phys. Rev. D 65 033010
- [37] [] (Arnaud N al. 2000 Preprint hep-ph/0109027)
- [38] Fukuda Y 2003 Proc. of Origin of Matter and Evolution of Galaxies 2000 (World Scientific) 209
- [39] [] Super-K collaboration, in preparation
- [40] Virtue C 2001 Nucl. Phys. Proc. Suppl. 100 326
- [41] [] (Virtue C 2001 Preprint astro-ph/0103324)
- [42] [] SNO collaboration, in preparation
- [43] Fulgione W 1999 Nucl. Phys. Proc. Suppl. 70 469
- [44] Fukuda S et al. 2001 Phys. Rev. Lett. 86 5651
- [45] [] (Fukuda S et al. 2001 Preprint hep-ex/0103032)
- [46] Amaldi E et al. 1989 Astron. Astrophys. 216 325
- [47] Prodi G A et al. 2000 Int. J. Mod. Phys. D 9 237
- [48] [] (Prodi G A et al. 2000 Preprint astro-ph/0003106)
- [49] Allen Z A et al. 2000 Phys. Rev. Lett. 85 5046
- [50] [] (Allen Z A et al. 2000 Preprint astro-ph/0007308)
- [51] http://hep.bu.edu/schol/workshop/workshop_summary.html
- [52] Bahcall J (P.I.) 2003 Observing the next nearby supernova HST proposal 10264 http://presto.stsci.edu/public/propinfo.html
- [53] Robinson L J August 1999 Sky & Telescope 30
- [54] http://SkyandTelescope.com/observing/proamcollab/astroalert/