The Chandra Fornax Survey - I: The Cluster Environment
Abstract
We present the first results of a deep Chandra survey of the inner degree of the Fornax cluster of galaxies. Ten 50 ksec pointings were obtained in a mosaic centered on the giant elliptical galaxy NGC 1399 at the nominal cluster center. Emission and temperature maps of Fornax are presented, and an initial study of more than 700 detected X-ray point sources is made. Regions as small as 100pc are resolved. The intra-cluster gas in Fornax exhibits a highly asymmetric morphology and temperature structure, dominated by a 180 kpc extended “plume” of low surface brightness, cool ( keV) gas to the North-East of NGC 1399 with a sharper edge to the South West. The elliptical galaxy NGC 1404 also exhibits a cool halo of X-ray gas within the cluster, with a highly sharpened leading edge as it presumably falls into the cluster, and a cometary-like tail.
We estimate that some point sources are physically associated with Fornax. Confirming earlier works, we find that the globular cluster population in NGC 1399 is highly X-ray active, extending to globulars which may in fact be intra-cluster systems. We have also found a remarkable correlation between the location of giant and dwarf cluster galaxies and the presence of X-ray counterparts, such that systems inhabiting regions of low gas density are more likely to show X-ray activity. Not only does this correlate with the asymmetry of the intra-cluster gas but also with the axis joining the center of Fornax to an infalling group 1 Mpc to the South-West. We suggest that Fornax may be experiencing an intergalactic “headwind” due to motion relative to the surrounding large-scale structure.
1 Introduction
Low X-ray luminosity galaxy clusters appear to be the dominant reservoirs of bound matter in the Universe (Mulchaey, 2000), and therefore represent crucial laboratories for studying the state, and history, of cold and cooling baryons. In the hierarchical structure growth paradigm these poorer systems also represent the building-blocks of larger, rich clusters. Ideally we would study them in-situ, at high redshift, however this is extremely difficult because of the faintness of their X-ray gas component and low galaxy density contrast. We can however study them in great detail at low redshift, and then by proxie extend much of what we learn about their astrophysics to earlier epochs.
The relatively shallow gravitational potentials in low-luminosity, or poor, clusters imply a regime where the energetic influence of astrophysical phenomenae such as supernovae associated with star formation and active-galactic-nucleii (AGN) is comparable to that of gravity. The observation of an apparent minimum gas entropy in the core of clusters is one possible consequence of this ( Ponman, Sanderson, & Finoguenov (2003) and refs therein). However, the precise interplay of these non-gravitational energy sources with the intra-cluster medium (ICM), it’s evolution, and the member galaxy population is currently unclear (Tozzi & Norman, 2001; Tornatore et al., 2003; Voit et al., 2003; Borgani et al., 2004).
At a distance of about 20.5 Mpc (e.g. Ferrarese et al. (2000)) the Fornax cluster is second only to the Virgo cluster in the readiness with which high physical resolution multi-wavelength data may be obtained. With a best resolution of , Chandra offers an unprecedented access to X-ray structures as small as 100 pc in Fornax. In this work we describe the first results from the Chandra Fornax Survey (CFS) which consists of ten mosaiced pointings of 50 ksec exposure with ACIS-I, covering the innermost of the cluster. The aim of the CFS is to provide an X-ray dataset of sufficently high quality to allow; a detailed study of the properties of the ICM, its relationship to the galaxies in Fornax, the X-ray properties of those galaxies themselves, and the properties of point sources such as X-ray binaries, and accreting black holes.
Recent investigations of Fornax have revealed several characteristics of this cluster which point towards a highly complex environment. These include; a possible intra-cluster stellar population amounting to at least 10-40% of the total cluster stellar mass (Theuns & Warren, 1997; Ciardullo et al., 2002; Karick, Drinkwater, & Gregg, 2003; Neill, Shara, & Oegerle, 2004). Secondly, a population of ultra-compact intracluster stellar systems (Drinkwater et al., 2003) often referred to as ultra-compact-objects or dwarfs (UCOs or UCDs) which are not readily classifiable as either galaxies or globular clusters. Thirdly, approximately 1 Mpc to the south-west of the cluster center is an infalling poor group, suggesting significant dynamical activity in Fornax (Drinkwater, Gregg, & Colless, 2001).
In this paper we present the initial results from the CFS. In §2 we describe the basic data processing, in §2.1 we present multi-band images of the CFS, and in §2.2 we present an estimated gas temperature map of Fornax together with confidence regions and an example of narrow-band imaging designed to indicate relative metal abundances in the ICM. In §3.1 we discuss the infalling galaxy NGC 1404, and in §3.2 the tentative motion of NGC 1387 and the possible truncation of its hot IGM by the surrounding Fornax ICM. In §4 we present first results from efforts to compile an X-ray source catalog of over 700 detections in the CFS, together with X-ray color-color classifications. In §4.1 we discuss the X-ray counterparts to known bright Fornax galaxy members, and in §4.2 we present X-ray measurements of counterparts to two possible intra-cluster globular clusters in the outermost regions of the central galaxy NGC 1399. In §5 we present an analysis of what is likely a distant, hot, background cluster of galaxies seen to the immediate East of NGC 1399. Finally, in §6 we summarize the results presented here and discuss some of the implications for the overall Fornax environment.
2 Data and Analysis
The data for the Chandra Fornax Survey were obtained sequentially from the period of May 20 2003 through to June 6 2003. Sequence numbers were 800324 to 800333. Due to increased solar activity the observations were halted within this period, and sequence 800331 was interrupted and restarted once the solar activity had died down. Exposure times ranged between 45 and 48 ksec. A schematic of the mosaic strategy is given in Figure 1, overlaid on an optical Digitized Sky Survey image of Fornax. The mosaic was designed to provide a) contiguous coverage over the cluster core and b) high resolution (on-axis) data for the brightest galaxies in the Fornax core. Nine fields provided full coverage and a tenth was positioned to double the exposure in the region between NGC 1399 and NGC 1404, and ensure that the leading edge of NGC 1404 (§3.1) was not at a chip gap.
All data were taken using the VFAINT mode, and were reprocessed to take advantage of the increased background discrimination this offers. The Charge Transfer Inefficiency (CTI) correction was also reapplied. After filtering out periods of high background, the range of usable exposure was 40.8-46.6 ksec across all fields. Gain corrections were also applied to the data. In addition to the ACIS-I 0,1,2, and 3 chips, the ACIS-S S2 (chip 6) was switched on, although we do not consider those data here.
2.1 Images
Soft (0.3-1.5 keV), medium (1.5-2.5 keV), and hard band (2.5-8 keV) images of the full mosaic are presented in Figures 2,3, and 4. Exposure maps were constructed in these bands for each individual ACIS-I field using a spatial binning factor of 4 () and spectral weights calculated assuming a thermal MEKAL spectrum of 1.2 keV and 0.3 solar metal abundance. Each field/band was binned by a factor 4 and then smoothed using the adaptive smoothing algorithm CSMOOTH limited to a maximum smoothing scale of . The smoothing scales generated for each image were then applied to the band appropriate exposure maps, all smoothed images and exposure maps were then merged, and an exposure-corrected mosaiced image was produced in each energy band. It should be noted that some residual structures associated with the field overlap regions are still apparent in the soft band image, and to a much lesser degree in the medium and hard images. This is in part due to the imprecise nature of the exposure map spectral weighting, which necessarily assumes a uniform spectral model, and in part due to the inherent difficulty of merging two independently smoothed and exposure corrected versions of the same part of the sky, containing low surface brightness emission - as necessitated by current software limitations. We will address these issues in subsequent work on the CFS image maps.
Several features are notable in Figures 2,3, and 4. First, the soft band image clearly shows a remarkably asymmetric morphology of the low density Fornax ICM, which appears to be swept to the North-East. Within the higher density region surrounding the central giant elliptical NGC 1399 there is a further asymmetry such that NGC 1399 appears offset to the North-East relative to the ICM core, which extends further to the South-West. There is also clearly complex emission in the brightest regions of NGC 1399, probably associated with the radio-jet structure in this galaxy (Paolillo et al. 2002). Second, the galaxy NGC 1404 exhibits a spectacular “cometary” X-ray morphology, with a sharp North-West edge and a wisp-like emission tail extending some (30 kpc) to the South-East (see §3.1 below). Finally, in addition to the point source populations which are seen in all three bands there is an extended source approximately (52 kpc) to the East of NGC 1399 which is present at all energies. We do not currently know the precise origin of this emission, although it appears very likely that it is a hot, distant, background galaxy cluster (see §5 below).
2.2 Temperature Mapping
The gas temperature map shown in Figure 5 was produced using a technique with similarities to the multiple-band fitting approach of Markevitch et al. (2000) and Vikhlinin, Markevitch, & Murray (2001). A grid of MEKAL gas spectral models is generated varying the gas temperature from 0.1 to 12 keV in steps of 0.1 keV with abundances set at 0.3 solar and redshift set to zero, and a Galactic foreground absorbing column of cm-2. The models are generated using XSPEC and an on-axis Chandra response from 0.3-7 keV (variations in response with off-axis angle have negligible effect on the results presented here). A global background spectral model (generated using the on-line ACIS-I background files) is added to each grid model and the result is normalized to a single integrated count-rate. Bright sources are removed from the CFS data and photons are then spatially binned to pixels; counts per pixel range from to over 2000 in the 0.3-7 keV band. Within a given pixel each photon is assigned a unique probability for being drawn from a spectral model. In other words the normalized spectral model is treated as a probability distribution. The cumulative probability () that the photons in a pixel are drawn from a given model () is then calculated and the maximum of this is found, thereby yielding the “best fit” . The resultant temperature map is then spatially smoothed by a Gaussian of width to wash out low level noise features. A full discussion of this technique, and examples of its calibration against conventional fitting approaches will be presented by Scharf (2004, in preparation). The method was originally designed in combination with a spatial source detection algorithm to act as a computationally efficient optimal matched-filter for detecting low density, low temperature gas, and it is therefore quite robust when applied to datasets with good photon statistics, such as the Fornax data presented here.
The estimated temperatures in the vicinity of the central galaxy NGC 1399 are in excellent global agreement with earlier measurements from ROSAT ( keV, Jones et al. (1997), keV, Rangarajan, Fabian, Forman, & Jones (1995)), ASCA ( keV, Fukazawa (1996)) and more recently with XMM-Newton (0.9 & 1.5 keV components, Buote (2002)). As a guide to the robustness of the temperatures estimated here, Figure 6a shows overlaid contours of total (non exposure-corrected) photon counts. Regions outside the lowermost contour should be considered as noise and/or background dominated (reflected in the systematically higher estimated ’s).
In Figure 6b we also present an example of a narrow band X-ray image. Photons were extracted in a 140 eV wide band straddling the Fe-L complex (600-740 eV) and an off-band (460-500 eV). The off-band data were gaussian smoothed with a kernel radius of and an un-sharp masked image was created by subtracting this smooth off-band data from the on-band image and smoothing the residual map with a kernel (c.f. broad band unsharp masking, e.g. Fabian et al. (2003)). The resulting image represents enhancements in flux in the Fe-L complex band relative to the off-band and is therefore sensitive to a combination of higher Fe abundances and lower (which increases the relative Fe-L emission in these keV temperature ranges). The halo of NGC 1404 is the most significant feature in this image, suggesting that it may have a higher Fe abundance than the surrounding ICM. More detailed spectral modeling will be presented in a subsequent work.
3 Galaxy Motions
3.1 NGC 1404
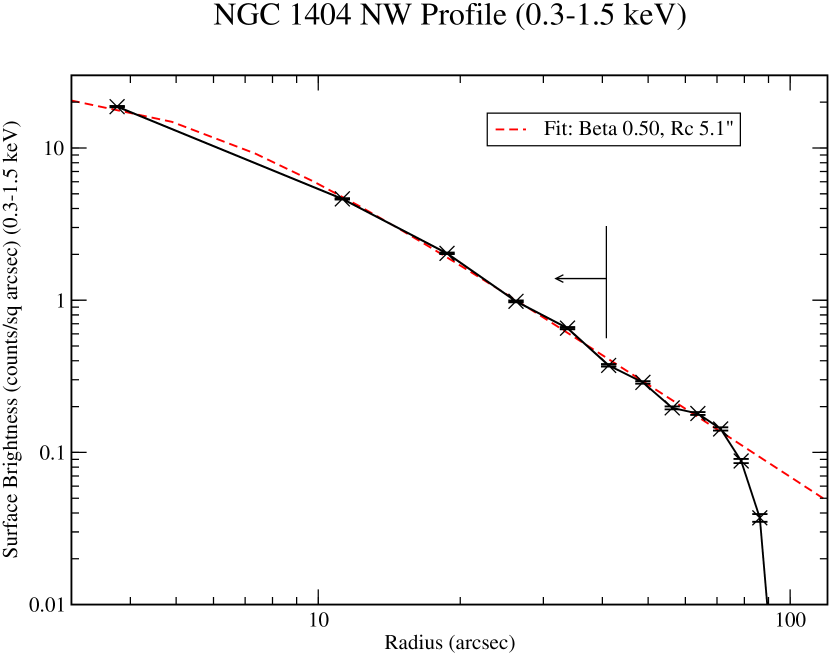
Previous studies of the X-ray morphology of the elliptical galaxy NGC 1404 have indicated the presence of distortion/elongation in the emission along an axis towards NGC 1399, strongly suggesting infall (Jones et al., 1997; Paolillo, Fabbiano, Peres, & Kim, 2002). Dynamical studies of Fornax have also suggested that NGC 1404 may be part of a clump (less significant than what is commonly considered major substructure) projected onto the Fornax core and infalling with a line-of-sight velocity relative to NGC 1399 of km s-1 (Drinkwater, Gregg, & Colless, 2001). In Figures 2 and 5 there is excellent support for this picture. NGC 1404 clearly has a very sharp NW edge in emission, combined with a “tail” of soft emission trailing to the SE. Furthermore, the temperature map reveals a dramatic plume of cooler material to the immediate SE. In Figure 8 we plot the soft band surface brightness profile of NGC 1404 in a pie-wedge set of circular annuli towards the NW (Figure 7). The inner (4 kpc) of emission is very well fit by a single model emission distribution, which continues to be a good fit to approximately (6 kpc). The best fit (0.5) and core radius () are in excellent agreement with those obtained from a fully azimuthally averaged profile using ROSAT HRI data (Paolillo, Fabbiano, Peres, & Kim, 2002). Beyond 6 kpc, however, the profile drops rapidly, by more than a factor in 2 kpc. In addition (Figure 5) the gas temperature rises from keV to keV. In these respects the situation appears very similar to that of the larger scale “cold-fronts” observed in massive clusters (Vikhlinin, Markevitch, & Murray, 2001; Markevitch et al., 2000).
We now apply a crude analysis to understand the implications of this structure, a more detailed investigation will be presented elsewhere. Following Vikhlinin, Markevitch, & Murray (2001) the ratio of pressure in the free stream (external ICM) to that at the stagnation point at the leading edge of a moving cold cloud is a function of the adiabtaic index and Mach number of the free stream. From a deprojection of the best fit model the approximate gas density at the (7 kpc) cold edge is cm-3 versus cm-3 in the ambient medium. This implies a pressure ratio between the NGC 1404 halo and the ICM of , corresponding to a Mach number of . NGC 1404 is therefore moving at or slightly higher than the ICM sound speed. The estimated velocity is km s-1.
If NGC 1404 is indeed moving supersonically then a bow shock is expected to form at some distance ahead of the motion. Because of the projected proximity to the massive galaxy NGC 1399, its X-ray halo, and the core of the cluster potential in the direction of motion, it is likely that any such bow shock will be hard to detect directly. Indeed, no such feature is readily apparent. Using the Rankine-Hugoniot jump conditions and the estimated Mach number, we can however estimate the likely temperature jump as being a factor . At close to sonic velocities we would also expect compression of the ambient ICM in the stagnation region immediately ahead of the cooler halo of NGC 1404, and this may correspond to the slight flattening of the profile visible in Figure 8 at (5.5-7 kpc).
We note also that NGC 1404 may be producing a Bondi-Hoyle (B-H) gravitational wake - which could mimic aspects of a ram-pressure stripped tail, while actually being the gravitationally focussed ICM (Stevens, Acreman, & Ponman, 1999; Sakelliou, 2000). It is also possible that some combination exists, such that the halo material of NGC 1404 is mixing with the ICM wake material. Visible B-H wakes are most likely for subsonic motion of a galaxy through a relatively cool ICM, and in the case of NGC 1404 at least one of these criteria is met in as much as the ambient ICM is quite cool ( keV). Sakelliou (2000) performed a simulation of NGC 1404 and its possible B-H wake and determined that with a velocity in the plane of the sky of 300 km s-1 the B-H wake could extend to 17 kpc; with a 500 km s-1 motion it could extend to 20 kpc. From the CFS data we estimate the length of the NGC 1404 tail to be (beyond an azimuthally averaged mean radius of (10 kpc)) at least 30 kpc. As Sakelliou (2000) notes, a wake exceeding 20 kpc could be due to a greater infall velocity, and our above estimate of km s-1 is certainly consistent with this.
Earlier dynamical and X-ray studies of NGC 1404 have suggested that it is likely undergoing its first “fall-through” in the Fornax system. If the emission tail seen here in the CFS is indeed ram-pressure stripped material then this picture is clearly supported. From these X-ray results we now also have an estimate of the velocity relative to the ICM/cluster frame close to the plane of the sky. This is comparable to the purely radial optical redshift velocity of 450 km s-1 (Drinkwater, Gregg, & Colless, 2001). Combined, these velocity vectors indicate an absolute upper limit for motion towards the cluster core of km s-1. Further deprojection modeling of the NGC 1404 emission may allow us to better constrain the velocity vector angle relative to the line of sight, and ultimately constrain the orbital parameters for this galaxy in the cluster potential.
3.2 NGC 1387
As the third brightest optical galaxy after NGC 1399 and NGC 1404, the galaxy NGC 1387, approximately 120 kpc to the West of NGC 1399, also exhibits a significant X-ray halo. The optical classification of NGC 1387 is slightly complex. There is an elongation of the bulge within an extended, nearly circular, very faint outer envelope, resulting in an SB classification. However, the envelope is definite and pronounced, characteristic of an S0 (Sandage & Bedke, 1994).
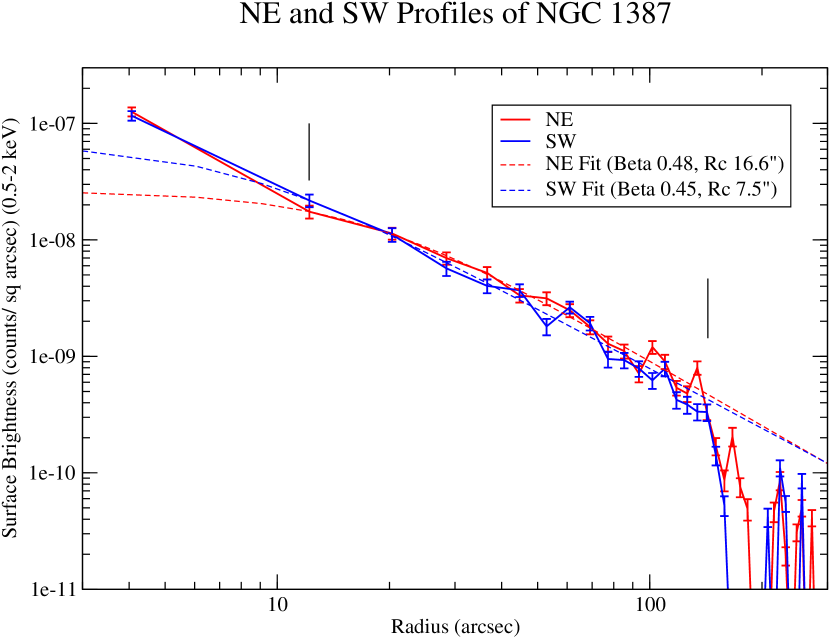
Owing to the design constraints of the CFS mosaic the emission from this galaxy falls across one of the ACIS-I chip gaps and so its interpretation is complicated by the need to carefully incorporate exposure corrections. There are no signficant morphological features in the soft emission map of Figure 2 and in the raw photon distribution. However, in the temperature map of Figure 5, there is evidence for a cool “tail” of gas similar to, but much weaker than, that seen in NGC 1404. This feature extends to the immediate NE of the galaxy, suggesting motion in the plane of the sky towards the SW. In Figure 9 the NE and SW emission profiles are plotted for NGC 1387 using pie-wedge circular annuli (see Figure caption). There is no significant difference between these profiles; both show evidence for a point source contribution within 1 kpc and are reasonably well fit by profiles between 1 and kpc. Both profiles do however show evidence for truncation beyond kpc, dropping by a factor over only kpc. Similar confinement of cooler media by an external ICM has been seen in the Coma cluster by Vikhlinin et el. (2001), and the possible adiabatic compression of a galaxy gas halo by an external ICM has been further considered by Finoguenov & Miniati (2004).
The absence of any notable emission morphology akin to that of NGC 1404 suggests that any motion of NGC 1387 is likely subsonic, combined with a lower ICM density at its location. The presence of a low-temperature tail may therefore point towards a Bondi-Hoyle accretion wake, although the lack of an obvious enhancement of gas density may argue against this.
4 The source catalog
To produce an initial source catalog, we merged the CFS data with the existing archival Chandra data of NGC 1399. Specifically, we merged the ACIS-S S3 chip data from the Chandra archive with the full CFS dataset. The combined exposure on NGC 1399 is approximately 145 ksec (two ACIS-I pointings, plus 55 ksec from ACIS-S). We ran the WAVDETECT source detection algorithm on the 0.3-8 keV combined image at two different binning scales (, and pixels) using the default parameters. The use of two image binning scales allows the algorithm to detect both the smallest angular scale sources and those of larger extent and/or lower surface brightness. We then merged the resulting lists visually, removing duplicates and selecting the resolution of the source detection which best enclosed the source flux. A total of 771 sources were thus obtained (Figure 10).
We then extracted source counts in three bands: soft (0.3-1.0 keV), medium (1.0-2.0 keV), and hard (2.0-8 keV) using the broad band source apertures. Note that these energy bands are slightly different from the bands used in Figures 2—4, and are chosen to match those used by Soria & Wu (2003) and Prestwich et al. (2003) for source classification. Owing to the variation in response between the ACIS-I and ACIS-S instruments, we here present results of source counts/colors from the CFS ACIS-I data only, although the set of source apertures is that derived from the combined CFS plus archival dataset. A total of 437 sources were obtained in the CFS with non-zero counts in all three energy bands. We plot the color-color diagram for this subset in Figure 11, following the color definitions of Prestwich et al. (2003) and Soria & Wu (2003). Two colors are defined, a “hard” color: and a “soft” color: , where and are the soft, medium, and hard total counts respectively. Typical error bars on the colors are large, of the order color units, owing to the relatively low photon count of the majority of sources.
In Figure 11 we also plot several curves corresponding to different spectral models. The curves trace a function of neutral column absorption, from the known foreground Galactic column of cm-2 to an arbitrary value of cm-2. Three power law spectra are plotted with photon indices of , 1.4, and 2.0. Many of the background AGN sources (see below) are likely to correspond to the range of colors covered by these power law spectra, as well as X-ray binaries (XRBs) in the hard state (). We also plot curves for: a keV black-body, typical of a supersoft source, a keV disk black-body, corresponding to an XRB in its quiet state, and a keV thermal spectrum akin to a supernova remnant/supernova driven outflow source or other soft emission. The 437 sources with non-zero counts in all bands clearly cover a wide range of potential spectral types
A significant, possibly majority, fraction of point sources in the CFS are expected to be background AGN. We estimate the maximum number count of such sources from the extra-galactic LogN-LogS curves as determined from the Chandra deep fields (Rosati et al., 2002). In the absence of the Fornax ICM emission the approximate flux limit for the non-overlapping CFS exposures is erg s-1 cm-2 for a detection of a power law point source on-axis (where the detection significance is given by in the usual Poisson limit). Given a CFS size of deg2 we then estimate a mean background source count of (0.3-8 keV). However, this assumes no ICM contribution to the effective background above which sources must be detected. We have estimated a conservative mean for the ICM contribution to the 0.3-8 keV background of approximately a factor 2 times the normal quiescent “blank field” background for ACIS-I. For a typical source detection aperture of radius this implies a net increase in the source flux detection limit (for a detection assuming Poisson errors) of approximately 30%. Owing to the steepness of the extragalactic function this translates to a new mean background count of . These numbers should be treated with caution, and the additional depth of the CFS in overlap regions (plus the inclusion of the archival NGC 1399 data) will boost the observed background count rates above these estimates (although surrounding NGC 1399 the ICM background is as much as two orders of magnitude larger than considered here). In summary, it is likely that some of the detected sources are physically associated with the cluster.
4.1 X-ray/optical galaxy counterparts and the morphology of Fornax
We have compared the distribution of X-ray sources in the CFS with a catalog of spectroscopically confirmed Fornax member galaxies from Karick, Drinkwater, & Gregg (2003). The optical catalog consists of 92 galaxies spectroscopically confirmed as cluster members over a deg2 region down to a limiting magnitude of . Of these galaxies 26 are within the CFS region. Figure 12 shows the positions of all X-ray sources overlaid on the soft-band CFS image, and the locations of the cluster member galaxies. We searched within a 3 kpc () radius of each galaxy center for X-ray counterparts, and such coincidences are labeled by arrows in Figure 12. The distribution of potential counterparts is strikingly asymmetric. There are 11 galaxies (excluding NGC 1399, but including NGC 1404 and NGC 1387) with possible X-ray counterparts in total (42 % of all cluster galaxies within the CFS), and 9 of these lie to the west/south-west of NGC 1399, and 1 is to the far north-east. The range of optical morphologies of the galaxies with potential X-ray counterparts are 4 S0 or SB0’s, 5 dS0 or dE’s, and 3 E’s (including NGC 1399 and 1404), following the classifications of Karick, Drinkwater, & Gregg (2003) and Drinkwater, Gregg, & Colless (2001). The X-ray colors of the counterparts indicate that the sources range from soft to hard spectra and may therefore include both power law (e.g. XRB’s, AGN) and thermal (e.g. starburst, gas halo) spectral types.
Although the numbers are small, the distribution of X-ray active galaxies in Fornax suggests an anticorrelation with the distribution of the ICM. The obvious implication is that the galaxies are strongly influenced by interaction with the ambient medium, and perhaps that these galaxies belong to a different population, such as field objects now entering the cluster environment. The idea that such an influence exists is in itself not new, but the majority of studies on the influence of the cluster/density environment on member galaxies have focussed on galaxy properties such as HI content (e.g. Solanes et al. (2001)) and optical stellar activity (e.g. Balogh et al. (2004)). In more recent works however, Poggianti et al. (2004) and Finoguenov & Miniati (2004) have investigated respectively the spatial distribution of starburst/post-starburst galaxies and that of X-ray luminous galaxies in the Coma cluster.
Finoguenov & Miniati (2004) conclude that the X-ray luminosities of galaxies in Coma is quenched by a factor of almost 6 compared to those of galaxies in the field, and that this must be linked to a reduction in star formation activity of galaxies in cluster environments. By comparison, Poggianti et al. (2004) find that the youngest and strongest post-starburst galaxies (E+a spectral types) are located close to the edges of infalling substructures, suggesting that interaction with the ICM is responsible both for a previous starburst episode and for subsequently quenching this activity. The implications for our present study of Fornax are clear - the X-ray active galaxies are likely in the process of being strongly influenced by the ambient medium. They are however not yet “quenched”, and may indeed be stimulated by infall through the less dense West/South-West Fornax ICM.
X-ray studies of Fornax over a wider field have identified a significant sub-cluster (including NGC 1316), likely infalling and approximately 1 Mpc to the South-West of NGC 1399 (Drinkwater, Gregg, & Colless, 2001). The approximate location and size of this system is shown in Figure 13. The geometry suggests that the Fornax core and the sub-cluster may lie along part of a filamentary structure which is collapsing and flowing in towards the common center of mass. In this picture, the morphology of the ICM seen in the CFS is consistent with either the agglomeration of IGM from the North-East and/or the presence of a relatively gentle ram-pressure tail as the NGC 1399 potential well drifts along the filament to the South-West, towards the common center of mass. In either scenario, the galaxies between NGC 1399 and the infalling sub-cluster are uniquely located in a region bounding two significant structures and containing a moderate density 1-2 keV ICM (a factor less dense than the North-Eastern regions).
4.2 X-ray counterparts to outlying NGC 1399 globular clusters
We have made an initial investigation of possible X-ray counterparts to a catalog of compact objects in the Fornax core. This catalog consists of 5 ultra-compact objects (UCO’s, Hilker et al. (1999)) and 18 objects from a spectroscopic survey of bright compact objects extending into the outer regions of NGC 1399 (Mieske, Hilker, & Infante, 2002). We have found 3 unambiguous matches with our X-ray source catalog, with X-ray/optical offsets of . Following the nomenclature of Mieske, Hilker, & Infante (2002) these objects are FCC 208 (dwarf elliptical, dE, N), FCOS 1-060 (Globular cluster), and FCOS 2-073 (Globular cluster). None of the UCO candidates were detected as X-ray sources. The location of the two globular cluster (GC) candidates is illustrated in Figure 14. Both are significantly distant from the center of NGC 1399, at 60 and 79 kpc for FCOS 1-060 and FCOS 2-073 respectively.
We have extracted source counts from diameter apertures around each GC, FCOS 1-060 lies in a region of double exposure in the CFS (90 ksec) while FCOS 2-073 has a 45 ksec exposure. The background subtracted source counts and rates for FCOS 1-060 and FCOS 2-073 use a mean background estimated from 10 apertures randomly placed within 1 arcmin of these objects, avoiding other sources. The X-ray properties are given in Table 1. The color indices have errors of . Based on the color-color plane (Figure 10) we then tentatively assign spectral types: FCOS 1-060, Disk Blackbody, keV, and FCOS 2-073, Power law, Galactic absorption, photon index 1.4. The intrinsic luminosities (Table 1) of these two objects are then estimated based on these spectral models.
The observed X-ray luminosities are consistent with those measured in the inner GC population of NGC 1399 (Angelini, Loewenstein, & Mushotzky, 2001). It is intriguing that both objects have X-ray luminosities consistent with the Eddington limit luminosity for spherical accretion onto a 1.4 neutron star ( erg s-1), which suggests that it is conceivable that we are detecting just one low mass X-ray binary (LMXRB) system in each GC. However, as Angelini, Loewenstein, & Mushotzky (2001) point out, in our galaxy and in 500 GC systems in M31 there are no GC’s with X-ray luminosities exceeding erg s-1. Within our Galaxy all LMXRB’s have luminosities between and erg s-1. Thus it might reasonable to assume that a population of anything between 2-200 LMXRB’s per GC would also produce the observed luminosity.
Such a large number of LMXRB’s in a GC indicates that the efficiency of producing such systems is greatly enhanced compared to the GCs of the Milky Way or M31. The stellar dynamics of the GCs in question must therefore be different than that of the typical GC in the Milky Way (or M31). It has been shown from N-Body simulations (Giannone & Molteni, 1985) that the number of stars initially in binaries greatly enhances stellar interactions and the tightening of binary orbits. This process eventually, after many interactions, produces mass exchange systems such as LMXRB’s. Large N-Body simulations of these systems( 100,000 stars) have only just begun to produce results, however, these simulations do not appear to produce hundreds of LMXRB’s. 111Prior to the existence of GRAPE-6 computers (Makino, Fukushige, Koga, & Namura, 2003), simulations this large were rarely undertaken.
The question was raised by Angelini, Loewenstein, & Mushotzky (2001) that the dynamics of the GCs in NGC 1399 would therefore have to be different to produce so many LMXRB’s. While it is hard to imagine a scenario where the dynamics of a GC would be so different from that of the Milky Way or M31, it should be stressed that the Fornax system is a cluster of galaxies that has undergone many galaxy-galaxy interactions and mergers. As well as an increase in the specific frequency of GCs due to the merger of populations, GC formation may also occur during the merger of giant galaxies (Ashman & Zepf, 1992; Zepf & Ashman, 1993). If the dynamics were different for the GCs existing prior to mergers in Fornax the GCs must have been tidally shocked during the galaxy mergers - stripping a large fraction of the low mass stars from a GC and causing it to undergo core collapse and creating many new tight binary systems (Kundic & Ostriker, 1995; Gnedin, Lee, & Ostriker, 1999; Gnedin, Hernquist, & Ostriker, 1999). If, however, the systems we are seeing are the GCs created during the galaxy mergers, then the number of short period binaries must have been greatly enhanced from that of GCs formed prior to the mergers. It would then also be likely that they would be younger than the general GC population. We will pursue this question in a future study.
Another possibility is that a fraction of all GCs contain black holes (BHs) of intermediate mass (100 - 10,000 M⊙). The evidence for BHs in GCs of the Milky Way and M31 (Gebhardt, Rich, & Ho, 2002; Gerssen et al., 2002; Colpi, Mapelli, & Possenti, 2003) is weak at this time (McNamara, Harrison, & Anderson, 2003; Baumgardt et al., 2003), though suggestive. If a fraction of all GCs have intermediate mass BHs then at any given time a fraction of that number must be in a high state due to the disruption of stellar material. The total number of GCs that may have a BH in them is about 1 to 5 in both the Milky Way and M31, which is 1% of the total GC population. NGC 1399 has more than 6000 GCs and if the fraction is the same that would suggest that about 60 GCs in NGC 1399 would have BHs. Of the possible GC BH candidates in the Milky Way, or M31, we know that none are X-ray bright and therefore it is likely that less than 10% of the BHs in Fornax GCs would be active now. That suggests that about 6 GC systems with a BH would be X-Ray bright now in NGC 1399. This is far fewer than the number found by Angelini, Loewenstein, & Mushotzky (2001), and suggested here in the CFS. If low-intermediate mass BHs are indeed the source of the observed high X-ray luminosities then the number of Fornax GCs with BHs must be enhanced over that of the Milky Way and M31, which presents similar difficulties as invoking an enhanced production of LMXRBs.
Future studies will look into population differences of the GC systems and determine if any correlation can be found with optical properties and X-ray properties.
5 A distant background cluster of galaxies ?
As discussed in §2 above, we have found an extended X-ray source approximately (52 kpc) to the East of NGC 1399, at a nominal position of (03 39 12, -35 26 09) (J2000) with a soft band extent of diameter. This source is clearly seen in all three energy bands, suggesting that it is spectrally much harder than the Fornax ICM. In Figure 15a the soft band (0.3-1.5 keV) raw image (binned to pixels) is shown with contours of the adaptively smoothed, exposure corrected, soft band image (Figure 2) overlaid. In Figure 15b a deep R-band image is shown centered on this position. This data was taken using the Mosaic camera on the CTIO 4m during December 1999 (Neill, Shara, & Oegerle, 2004) and has a magnitude limit of approximately .
The moderately bright star towards the image center is unlikely to be associated with this diffuse emission. There is a clear association of faint objects () directly coincident with the extended X-ray emission, including what could be two cD galaxies.
Analysis of the source spectrum is somewhat complicated by the source position in the overlap region of two pointings, but the combined exposure time is approximately 90 ksec. We have extracted the source photons in a circular aperture of 2 arcmin diameter from both pointings. We have generated ACIS-I responses for both pointing and then formed a weighted combined response, and co-added the source photon lists. The total, background subtracted source photon count is approximately 700 in total (count rate ) in the 0.3-10 keV band. The background spectrum is obtained from regions immediately surrounding this source and therefore contains the intracluster emission of Fornax. Limiting the energy range to 0.3-7 keV we have used SHERPA to examine possible spectral models for the emission. Fixing the foreground absorption to the Galactic value of cm-2 we fit a thermal MEKAL model with fixed abundance of 0.3 solar and free temperature, redshift and normalization using the spectrum grouped to a minimum of 20 counts per bin and a Chi-Gehrels statistic. The best fit model yields keV, and a reduced Chi-Gehrels statistic of . Alternatively, the data can be fit with a slightly poorer reduced statistic by a single power-law model, with Galactic foreground absorption and a photon index of . A power law model including a redshifted absorption component as well as Galactic absorption yields a better statistic but for and an absorber of cm-2 at , which seems physically unlikely for extended emission.
We therefore tentatively identify this object as CXOU J033912.0-352609, a likely hot, massive cluster of galaxies at (based also on optical magnitudes), although the true gas temperature is probably significantly lower than the 25 keV fit here.
6 Summary and Discussion
We have described the aquisition and initial analysis of the most detailed wide-field X-ray data on the Fornax cluster to date. In presenting some of the initial results of the CFS here we have attempted to illustrate several key aspects of the Fornax cluster environment which are now accessible for further investigation. Namely: (1) there is clear evidence of interaction between at least 2 galaxies (NGC 1404 and NGC 1387) and the Fornax ICM. In the case of NGC 1404 we have obtained the first quantitative constraint on it’s motion perpendicular to our line-of-sight, opening the way to constraining it’s orbital configuration when combined with existing redshift information. (2) the Fornax ICM has a clearly asymmetric morphology which we suggest may be related to the larger scale dynamics of this region, in which we are perhaps witnessing the coalescence of Fornax with an infalling group along a 1 Mpc filamentary structure. (3) possibly related to this ongoing growth, and almost certainly related to the local ICM density environment we find that the majority of X-ray active Fornax galaxies are distributed away from the bulk of the ICM, and between the Fornax core and the likely infalling structure. (4) we detect 2 globular cluster candidates which may be part of the outer structure of NGC 1399, or may be intracluster systems (formerly part of this, or another galaxy). Their X-ray luminosity suggests either a population of low-mass X-ray binaries or possibly an intermediate mass black hole.
The morphology of the Fornax ICM emission bears some resemblance to the phenomena of cold-fronts seen in other, massive, clusters on scales of some 0.5 Mpc (e.g. Vikhlinin, Markevitch, & Murray (2001)). However, in these situations the density of the gas environment is significantly higher than that seen in Fornax, and much more easily attributable to cool, dense, substructure passing through a warmer, dense ICM. Furthermore, the proto-typical cold fronts of Abell 2142 (Markevitch et al., 2000) and Abell 3667 (Vikhlinin, Markevitch, & Murray, 2001) are not physically close to the central cD galaxy of those clusters, whereas in Fornax NGC 1399 appears to be close to the “head” of the cometary type emission pattern. The striking temperature structure of Fornax also shows evidence for a much more extended cool component than is perhaps present in these richer systems. There is in addition an apparent offset between the location of NGC 1399 and the central core of ICM emission, where NGC 1399 is shifted some 2 arcmin to the North-East relative to the apparent geometric center of the core plateau. More detailed investigation of the gas density and temperature distribution is required in this region, but it seems plausible that there is relative motion between NGC 1399 and this region of emission.
As discussed in §4.1 it appears likely that the X-ray morphology of Fornax as seen in the CFS may be attributed to the ongoing coalescence of structure. In particular, the infall of the group identified by Drinkwater, Gregg, & Colless (2001) suggests that the Fornax core may be experiencing an intergalactic “wind” due to its relative motion with respect to structure along this infall axis. Unlike the case of strong cold fronts in the denser environment of massive clusters, this may represent a gentler phenomenon, associated directly with the intergalactic medium in the surrounding large scale structure.
Finally, as part of the CFS project, processed maps and source catalogs will be made available and continously updated via the Data Collections of the Department of Astrophysics at the American Museum of Natural History. 222http://research.amnh.org/astrophysics/collections.html
References
- Angelini, Loewenstein, & Mushotzky (2001) Angelini, L., Loewenstein, M., & Mushotzky, R. F. 2001, ApJ, 557, L35
- Ashman & Zepf (1992) Ashman, K. M. & Zepf, S. E. 1992, ApJ, 384, 50
- Balogh et al. (2004) Balogh, M., et al. 2004, MNRAS, 348, 1355
- Baumgardt et al. (2003) Baumgardt, H., Makino, J., Hut, P., McMillan, S., & Portegies Zwart, S. 2003, ApJ, 589, L25
- Borgani et al. (2004) Borgani, S., et al. 2004, MNRAS, 348, 1078
- Buote (2002) Buote, D. A. 2002, ApJ, 574, L135
- Ciardullo et al. (2002) Ciardullo, R., Feldmeier, J. J., Krelove, K., Jacoby, G. H., & Gronwall, C. 2002, ApJ, 566, 784
- Colpi, Mapelli, & Possenti (2003) Colpi, M., Mapelli, M., & Possenti, A. 2003, ApJ, 599, 1260
- Drinkwater, Gregg, & Colless (2001) Drinkwater, M. J., Gregg, M. D., & Colless, M. 2001, ApJ, 548, L139
- Drinkwater et al. (2003) Drinkwater, M. J., Gregg, M. D., Hilker, M., Bekki, K., Couch, W. J., Ferguson, H. C., Jones, J. B., & Phillipps, S. 2003, Nature, 423, 519
- Fabian et al. (2003) Fabian, A. C., Sanders, J. S., Allen, S. W., Crawford, C. S., Iwasawa, K., Johnstone, R. M., Schmidt, R. W., & Taylor, G. B. 2003, MNRAS, 344, L43
- Ferrarese et al. (2000) Ferrarese, L., et al. 2000, ApJ, 529, 745
- Finoguenov & Miniati (2004) Finoguenov, A. & Miniati, F. 2004, A&A, 418, L21
- Gebhardt, Rich, & Ho (2002) Gebhardt, K., Rich, R. M., & Ho, L. C. 2002, ApJ, 578, L41
- Gerssen et al. (2002) Gerssen, J., van der Marel, R. P., Gebhardt, K., Guhathakurta, P., Peterson, R. C., & Pryor, C. 2002, AJ, 124, 3270
- Giannone & Molteni (1985) Giannone, G. & Molteni, D. 1985, A&A, 143, 321
- Gnedin, Lee, & Ostriker (1999) Gnedin, O. Y., Lee, H. M., & Ostriker, J. P. 1999, ApJ, 522, 935
- Gnedin, Hernquist, & Ostriker (1999) Gnedin, O. Y., Hernquist, L., & Ostriker, J. P. 1999, ApJ, 514, 109
- Karick, Drinkwater, & Gregg (2003) Karick, A. M., Drinkwater, M. J., & Gregg, M. D. 2003, MNRAS, 344, 188
- Kundic & Ostriker (1995) Kundic, T. & Ostriker, J. P. 1995, ApJ, 438, 702
- Rangarajan, Fabian, Forman, & Jones (1995) Rangarajan, F. V. N., Fabian, A. C., Forman, W. R., & Jones, C. 1995, MNRAS, 272, 665
- Fukazawa (1996) Fukazawa, Y. 1996, Ph.D. Thesis
- Jones et al. (1997) Jones, C., Stern, C., Forman, W., Breen, J., David, L., Tucker, W., & Franx, M. 1997, ApJ, 482, 143
- Hilker et al. (1999) Hilker, M., Infante, L., Vieira, G., Kissler-Patig, M., & Richtler, T. 1999, A&AS, 134, 75
- Makino, Fukushige, Koga, & Namura (2003) Makino, J., Fukushige, T., Koga, M., & Namura, K. 2003, PASJ, 55, 1163
- Markevitch et al. (2000) Markevitch, M., et al. 2000, ApJ, 541, 542
- McNamara, Harrison, & Anderson (2003) McNamara, B. J., Harrison, T. E., & Anderson, J. 2003, ApJ, 595, 187
- Mieske, Hilker, & Infante (2002) Mieske, S., Hilker, M., & Infante, L. 2002, A&A, 383, 823
- Mulchaey (2000) Mulchaey, J. S. 2000, ARA&A, 38, 289
- Neill, Shara, & Oegerle (2004) Neill, J. D., Shara, M. M., & Oegerle, W. R. 2004, ApJsubmitted
- Paolillo, Fabbiano, Peres, & Kim (2002) Paolillo, M., Fabbiano, G., Peres, G., & Kim, D.-W. 2002, ApJ, 565, 883
- Ponman, Sanderson, & Finoguenov (2003) Ponman, T. J., Sanderson, A. J. R., & Finoguenov, A. 2003, MNRAS, 343, 331
- Poggianti et al. (2004) Poggianti, B. M., Bridges, T. J., Komiyama, Y., Yagi, M., Carter, D., Mobasher, B., Okamura, S., & Kashikawa, N. 2004, ApJ, 601, 197
- Prestwich et al. (2003) Prestwich, A. H., Irwin, J. A., Kilgard, R. E., Krauss, M. I., Zezas, A., Primini, F., Kaaret, P., & Boroson, B. 2003, ApJ, 595, 719
- Rosati et al. (2002) Rosati, P., et al. 2002, ApJ, 566, 667
- Sakelliou (2000) Sakelliou, I. 2000, MNRAS, 318, 1164
- Sandage & Bedke (1994) Sandage, A., Bedke, J. 1994, Carnegie Atlas fof Galaxies, v.1
- Solanes et al. (2001) Solanes, J. M., Manrique, A., García-Gómez, C., González-Casado, G., Giovanelli, R., & Haynes, M. P. 2001, ApJ, 548, 97
- Soria & Wu (2003) Soria, R. & Wu, K. 2003, A&A, 410, 53
- Stevens, Acreman, & Ponman (1999) Stevens, I. R., Acreman, D. M., & Ponman, T. J. 1999, MNRAS, 310, 663
- Theuns & Warren (1997) Theuns, T. & Warren, S. J. 1997, MNRAS, 284, L11
- Tornatore et al. (2003) Tornatore, L., Borgani, S., Springel, V., Matteucci, F., Menci, N., & Murante, G. 2003, MNRAS, 342, 1025
- Tozzi & Norman (2001) Tozzi, P. & Norman, C. 2001, ApJ, 546, 63
- Vikhlinin, Markevitch, & Murray (2001) Vikhlinin, A., Markevitch, M., & Murray, S. S. 2001, ApJ, 551, 160
- Voit et al. (2003) Voit, G. M., Balogh, M. L., Bower, R. G., Lacey, C. G., & Bryan, G. L. 2003, ApJ, 593, 272
- Zepf & Ashman (1993) Zepf, S. E. & Ashman, K. M. 1993, MNRAS, 264, 611
| GC | Counts | ct/s | Soft index | Hard index | Flux (erg s-1 cm-2) | Luminosity (erg s-1) |
|---|---|---|---|---|---|---|
| FCOS 1-060 | -0.35 | 0.39 | ||||
| FCOS 2-073 | -0.1 | 0.24 |
Note. — All counts, rates, fluxes and luminosities are quoted in the 0.3-8 keV band. Galactic absorption is assumed, cm-2. Nomenclature from Table 2, Mieske, Hilker, & Infante (2002)