Fire and Ice: IRS Mid-IR Spectroscopy of IRAS F00183–7111
Abstract
We report the detection of strong absorption and weak emission features in the 4–27 m Spitzer-IRS spectrum of the distant ultraluminous infrared galaxy (ULIRG) IRAS F 00183–7111 (z=0.327). The absorption features of CO2 and CO gas, water ice, hydrocarbons and silicates are indicative of a strongly obscured (A9.6 5.4; AV90) and complex line of sight through both hot diffuse ISM and shielded cold molecular clouds towards the nuclear power source. From the profile of the 4.67 m CO fundamental vibration mode we deduce that the absorbing gas is dense (n 106 cm-3) and warm (720 K) and has a CO column density of 1019.5 cm-2, equivalent to NH 1023.5 cm-2. The high temperature and density, as well as the small infered size ( 0.03 pc), locates this absorbing gas close to the power source of this region. Weak emission features of molecular hydrogen, PAHs and Ne+, likely associated with star formation, are detected against the 9.7 m silicate feature, indicating an origin away from the absorbing region. Based on the 11.2 m PAH flux, we estimate the star formation component to be responsible for up to 30% of the IR luminosity of the system. While our mid-infrared spectrum shows no tell-tale signs of AGN activity, the similarities to the mid-infrared spectra of deeply obscured sources (e.g. NGC 4418) and AGN hot dust (e.g. NGC 1068), as well as evidence from other wavelength regions, suggest that the power source hiding behind the optically thick dust screen may well be a buried AGN.
1 Introduction
One of the most important discoveries by IRAS was the detection of a class of galaxies with infrared (8–1000 m) luminosities in excess of 1012 L⊙ and infrared-to-blue ratios (LIR/LB) even higher than for lower luminosity infared-bright galaxies. Numerous studies have since established that ULIRGs are predominantly found in interacting systems and that their huge luminosities are the result of vigorous, merger-induced star formation and/or AGN activity. Spectacular as they may be, ULIRGs are relatively rare in the Local Universe (Soifer et al., 1987). At higher redshifts though, ULIRGs play an important role in the measurable star formation density and may account for most of the far-infrared (FIR) background (Blain et al., 2002). As such, the study of local members of the ULIRG community may be instrumental in understanding their high redshift counterparts.
IRAS F00183–7111 is a distant (=0.327; DL=1700 Mpc, assuming H0=71 km s-1 Mpc-1, =0.27, =0.73, =0), luminous (LIR=711012 L⊙) ULIRG, discovered by IRAS. The galaxy has been optically classified as LINER/Seyfert1.5 by Armus, Heckman & Miley (1989). Its radio luminosity is in the range of powerful radio galaxies, far higher than would be expected for starburst galaxies on the basis of the FIR luminosity (q=1.14; Roy & Norris, 1997; Norris et al., 1988). K-band imaging shows the galaxy to have a disturbed morphology (Rigopoulou et al., 1999). ISO mid-infrared (MIR) spectroscopy revealed its 5–12 m spectrum to be markedly different from that of template starbursts and AGNs, showing instead more similarities to deeply obscured Galactic sources (Tran et al., 2001). Based on the absorbed spectral appearance, Tran et al. (2001) conclude that IRAS F00183–7111 is an extremely obscured AGN.
The 5–12 m spectral appearance of IRAS F00183–7111 is not unique. In a study involving 103 galaxies observed spectroscopically by ISO (Spoon et al., 2002), IRAS F00183–7111 is classified along with IRAS 00188–0856, NGC 4418 and IRAS 15250+3609 as a class I ‘ice galaxy’; showing ice, silicate and hydrocarbon absorption features, with little or no sign of PAH emission bands. Based on this classification, Spoon et al. (2002) conclude that the power source in IRAS F00183–7111 may be in the obscured beginnings of star formation or AGN activity.
In this Letter we report a new spectrum obtained at a spectral resolution of 64–128, extending the observed range from 5–12 m to 4–27 m.
2 Observations and data reduction
A low resolution 5–38 m spectrum of IRAS F00183–7111 was obtained on November 14, 2003 using the IRS111 The IRS was a collaborative venture between Cornell University and Ball Aerospace Corporation funded by NASA through the Jet Propulsion Laboratory and the Ames Research Center. spectrometer (Houck et al., 2004) onboard the Spitzer Space Telescope (Werner et al., 2004). The observation (AOR key 7556352) was performed using 60 sec. ramps in both short-low order 2 (SL2; 5.2–7.7 m) and order 1 (SL1; 7.4–14.5 m), while using 31 sec. ramps in both long-low order 2 (LL2; 14.0–21.3 m) and order 1 (LL1; 19.5–38.0 m), with a total integration time amounting to 15 minutes.
The spectra were reduced using the IRS pipeline (V 9.1) at the Spitzer Science Center. Background emission in our aperture was removed from the SL and LL images by differencing the two nod positions. The spectrum of both the target and the calibration star (HD 105 for SL and HR 6348 for LL) were extracted with an aperture which scales with wavelength. The target spectrum was flux calibrated by dividing it by the stellar spectrum, followed by multiplication by the adopted Cohen stellar model (Cohen et al., 2003). Finally, the long-low section was defringed using the ‘IRS defringer’. For a good match to both LL1 and SL1, the LL2 spectrum was divided by 1.1. We estimate the absolute flux calibration of the resulting spectrum to have a tolerance of less than 20%.
3 Analysis
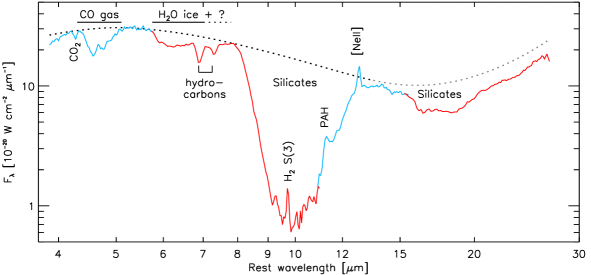
The IRS spectrum of IRAS F00183–7111 (Fig. 1) is dominated by broad and partially overlapping absorption features, spanning the entire observable range. Emission features have been detected only in the 9.5–13 m range.
3.1 Continuum placement
Optical depth profiles and the derived physical properties generally depend strongly on the assumed local continuum. Here we will adopt the spline-interpolated continuum as shown in Fig. 1. Although a small contribution of 7.7 m PAH emission to the 7.7 m flux is to be expected, the non-detection of the 6.2 m PAH band (Sect. 3.3) indicates that this contribution is small (5%). We therefore do not correct the 7.7 m local continuum for this emission. At 13.5 m we choose to run the local continuum a factor exp[(13.5 m)] above the 13.5 m flux to correct for the non-zero optical depth in the overlap region between the 9.7 and 18 m silicate absorption bands (see Sect. 3.2). Beyond 13.5 m, the local continuum is purely hypothetical, designed only to give a reasonable fit to the 18 m silicate feature.
3.2 Absorption features
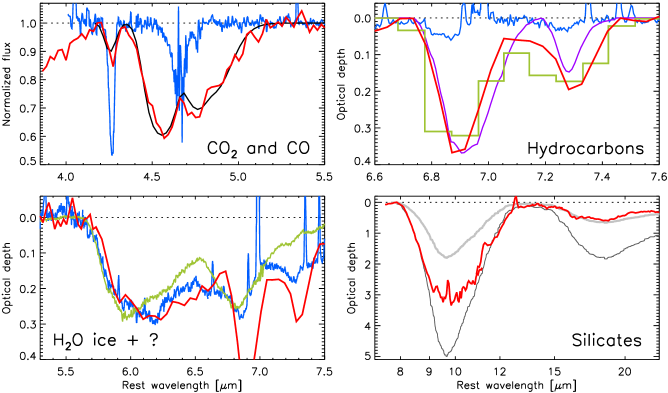
Table 1 gives an overview of the absorption features detected in the spectrum of IRAS F00183–7111; the associated optical depth profiles are presented in Fig. 2. In our analysis of the absorption features, we have used the spectra of extinguished Galactic lines of sight (the Galactic center sources GCS 3I and Sgr A∗ and the embedded massive protostar W 33A), as well as one extragalactic line of sight (the nucleus of NGC 4418) for comparison.
The broad double branched feature centered at 4.67 m is identified with the P and R branches of the fundamental vibration mode of CO gas. Using the isothermal plane parallel LTE gas models of Cami (2002), a best fit to the observed profile is found for a model with a gas temperature of 720 K, an intrinsic linewidth of 50 km/s and a column density of 1019.5 cm-2. The derived temperature is far higher than found towards Galactic ISM lines of sight, consistent with the clearly larger width of the feature. A comparison of the model to the data is shown in Fig. 2. For Galactic sources, a narrow absorption band at 4.26 m is normally attributed to CO2 ice. However, despite extensive comparison to Galactic ice sources, neither the peak position (4.273 m) nor the red wing of the feature in IRAS F00183–7111 is found to be consistent with solid state CO2. Using our gas models, a reasonable fit is obtained for gas phase CO2 at a temperature 110 K.
Another broad absorption complex extends from 5.7 to almost 7.8 m, with peaks at 6.15, 6.85 and 7.25 m. The peak positions and profiles appear very similar to those found for Sgr A∗ (Chiar et al., 2000). The blue wing (5.7–5.9 m) also matches the profile observed towards W 33A (Gibb et al., 2000). Beyond 6.0 m, the profiles of IRAS F00183–7111 and Sgr A∗ are markedly different from that of W 33A, peaking at 6.15–6.20 m instead of 6.0 m. While the W 33A profile is consistent with the profile of water ice, the shift in peak position for IRAS F00183–7111 and Sgr A∗ indicates the presence of strong additional absorption, likely due to hydrocarbons (Keane et al., 2004). The two absorption bands at 6.85 and 7.25 m are identified with the C–H stretching mode of hydrocarbons (e.g. Furton, Laiho & Witt, 1999). The only other two sources for which these bands have been detected are Sgr A∗ (Chiar et al., 2000) and the nucleus of NGC 4418 (Spoon et al., 2001). As shown in Fig. 2, the features compare well with those seen in a laboratory spectrum of hydrogenated amorphous carbons (HAC) (Furton, Laiho & Witt, 1999).
Beyond 8 m, the IRAS F00183–7111 spectrum shows two characteristic broad absorption bands due to silicates. To estimate the optical depth in both features, we use a baseline-subtracted silicate absorption profile of GCS 3I (Chiar & Tielens, 2004). Assuming the contribution of starburst-related emission to be negligible, a best fit to the blue wing of the 9.7 m feature is obtained for an optical depth of 5 (see Fig. 2). This fit also gives reasonable result for the red wing, but fails to fit the center of the feature. As will be discussed in Sect. 3.3, the latter is an indication for the presence of a separate, extended, low intensity, relatively unobscured emission component, filling in the bottom of the feature. The derived optical depth turns into a lower limit if the contribution from starburst emission is higher than assumed. Note that the fit to the 9.7 m feature overpredicts the depth of the 18 m band by more than a factor of 3. This either points to the presence of a strong starburst continuum filling in the 18 m silicate feature, or to the effects of radiative transfer in warm silicates. In either this case the true silicate optical depth may be far higher than inferred from our fit.
| Species | aa=d | ||||
|---|---|---|---|---|---|
| [m] | [cm-1] | [1018 cm-2] | [1022 cm-2] | ||
| CO2 gas | 4.26 | 0.05 | 5bbAssuming NH106 N | ||
| CO gas | 4.67 | 32 | 32ccAssuming all carbon to be locked up in CO, NH104 NCO | ||
| H2O ice + ? | 6.15 | 0.28 | 75 | ||
| ‘HAC’ | 6.85 | 0.36 | 15 | 11ddComputed using A(6.85 m)=1.3510-18 cm/mol. and A(7.25 m)=0.610-18 cm/mol.; Wexler (1967) | |
| ‘HAC’ | 7.25 | 0.19 | 6 | 11ddComputed using A(6.85 m)=1.3510-18 cm/mol. and A(7.25 m)=0.610-18 cm/mol.; Wexler (1967) | |
| silicates | 9.6 | 5.0 | 1130 | 17eeAssuming A9.6/AV=0.06 and NH=1.91021 AV cm-2 | |
| silicates | 18 | 0.57ffAssuming our choice for the local 14–27 m continuum | 129ffAssuming our choice for the local 14–27 m continuum |
3.3 Emission features
The spectrum of IRAS F00183–7111 (Fig. 1) reveals the presence of several emission features: 9.66 m H2 0–0 S(3), 11.2 m PAH and the 12.7–12.8 m blend of PAH and [Neii]. Interestingly, their presence in the center and red flank of the optically thick 9.7 m silicate band suggests a common origin away from the absorbing medium. Also the weak continuum, filling in the silicate feature, may be associated with these emission features. We list the measured line strengths as well as upper limits for lines commonly detected in star formation environments in Table 2.
Given the clear detection of the 11.2 m PAH band, the non-detection of the 6.2 m PAH band may seem surprising. However, as Hony et al. (2001) have shown for Galactic ISM lines of sight, the ratio 6.2PAH/11.2PAH is variable and ranges from 1 to 3 for Hii regions. At a value of 0.83, the ratio for IRAS F00183–7111 is outside the range for Galactic Hii regions, but still above the values found for the galaxies NGC 5195 (0.57; Boulade et al., 1996) and NGC 3226 (0.35; Appleton et al., 2004). Interestingly, in another study of Hii regions, Vermeij et al. (2002) find that sources with 6.2PAH/11.2PAH1 all happen to be low metallicity objects (e.g. SMC B1#1 and positions in 30 Dor).
A rough estimate of the IR flux associated with the star formation component can be made using conversion factors L(11.2PAH)/L(IR)=0.0014 and L(6.2PAH)/L(IR)=0.0034, as proposed by Soifer et al. (2002) for M 82 and Peeters, Spoon & Tielens (2004) for normal and starburst galaxies, respectively. The resulting contribution from the unobscured star formation component to the IR luminosity budget of IRAS F00183–7111 hence may range from 10% (based on the 6.2 m PAH upper limit) to 30% (based on the 11.2 m PAH flux).
Finally, we investigated the nature of the [Neii] flux by comparing it to the measured 11.2 m PAH flux and the [Neii]/11.2PAH ratio for a sample of (compact) Hii regions (Peeters et al., 2002). We find that the observed ratio for IRAS 00183–7111 (0.6) compares well to the Galactic values. The observed [Neii] flux may hence be ascribed completely to unobscured star formation.
| Species | flux | Species | flux | ||
|---|---|---|---|---|---|
| [m] | [10-21 W cm-2] | [m] | [10-21 W cm-2] | ||
| PAH | 6.22 | 3 | PAH | 12.7 | 2aaThe [NeII] flux was measured by fitting a gauss profile to the peak and red wing of the 12.55–12.95 m emission complex. The remaining flux in the blue wing (25%) is ascribed to the 12.7 m PAH feature. |
| Arii | 6.99 | 1.3 | Neii | 12.8 | 6aaThe [NeII] flux was measured by fitting a gauss profile to the peak and red wing of the 12.55–12.95 m emission complex. The remaining flux in the blue wing (25%) is ascribed to the 12.7 m PAH feature. |
| H2 0–0 S(3) | 9.66 | 0.6 | Nev | 14.3 | 1.5 |
| PAH | 11.2 | 3.6 | Neiii | 15.6 | 3 |
4 Discussion and conclusions
We have compared the wealth of emission and absorption features in the exotic MIR spectrum of IRAS F00183–7111 to (extra)galactic lines of sight displaying similar features. The picture that emerges is that of an energetically dominant nuclear power source, buried deeply behind two obscuring shells. The inner shell consists of warm gas (T720 K; NH =1023.5 cm-2; Table 1), giving rise to absorption bands of warm CO gas and hydrocarbons against an otherwise featureless hot MIR continuum. This absorbing gas has to be dense (n 3106 cm-3) as well in order to give rise to high-J level absorption, which limits the size of the absorbing region to 0.03 pc. The high temperature and density as well as the small scale size locates this absorbing gas to close to the power source of this region. The outer shell is far colder and is responsible for the absorption features of CO2 ice/gas, water ice and silicates. Given the depth of the 9.7 m silicate band (5), the column density of the outer shell amounts to at least NH =1023 cm-2 (Table 1). The emission lines from molecular hydrogen, PAHs and Ne+, as well as the weak continuum filling in the 9.7 m silicate feature, likely originate outside this shell structure. Based on the strength of the 11.2 m PAH feature, this star formation component may be responsible for up to 30% of the IR luminosity of the system.
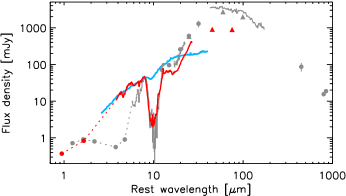
Optical and radio observations indicate that the power source hiding in the nucleus is most likely an AGN. The optical evidence comes from an emission line study of Armus, Heckman & Miley (1989), who classify IRAS F00183–7111 as a LINER/Seyfert1.5. Convincing evidence is also presented by Roy & Norris (1997), who show that the radio power of IRAS F00183–7111 is far higher than expected on the basis of the radio-FIR correleation for starburst galaxies. Radio VLBI observations further indicate the nucleus to be unresolved on the 0.025 (200 pc) scale (R.P. Norris, priv. comm.). Our IRS data is in agreement with these findings. In a diagram of L(6.2PAH)/L(FIR) versus L(6.2cont)/L(FIR), the so-called ‘MIR-FIR diagram’ (Peeters, Spoon & Tielens, 2004), IRAS F00183–7111 is found at a position intermediate between a deeply obscured source (e.g. NGC 4418) and AGNs with a clear line of sight to their AGN-heated hot dust (e.g. NGC 1068). The latter can also be infered from Fig. 3, where the IR spectrum of IRAS F00183–7111 shows signatures of both an AGN-like hot dust continuum (NGC 1068; Sturm et al., 2000) and a deeply obscured source (NGC 4418; Spoon et al., 2001)
In a follow-up study, high-resolution IRS spectroscopy will be used to search for direct mid-infrared AGN tracers such as 14.3 m and 24.3 m [Nev].
References
- Appleton et al. (2004) Appleton, P.N., et al., 2004, in prep.
- Armus, Heckman & Miley (1989) Armus, L., Heckman, T.M., Miley, G.K., 1989, ApJ, 347, 727
- Blain et al. (2002) Blain, A.W., Smail, I., Ivison, R.J., Kneib, J.P., Frayer, D.T., 2002, Phys. Rep., 369, 111
- Boulade et al. (1996) Boulade, O., et al., 1996, A&A, 315, L85
- Cami (2002) Cami, J., 2002, PhD thesis, Amsterdam University
- Chiar et al. (2000) Chiar, J.E., Tielens, A.G.G.M., Whittet, D.C.B., Schutte, W.A., Boogert, A.C.A., et al., 2000, ApJ, 537, 749
- Chiar & Tielens (2004) Chiar, J.E., Tielens, A.G.G.M., 2004, ApJ, in prep.
- Cohen et al. (2003) Cohen, M., Megeath, T.G., Hammersley, P.L., Martin-Luis, F., & Stauffer, J., 2003, AJ, 125, 2645
- Furton, Laiho & Witt (1999) Furton, D.G., Laiho, J.W., Witt, A.N., 1999, ApJ, 526, 752
- Gibb et al. (2000) Gibb, E.L., et al., 2000, ApJ, 536, 347
- Houck et al. (2004) Houck, J.R., et al., ApJS, this volume
- Hony et al. (2001) Hony, S., Van Kerckhoven, C., Peeters, E., Tielens, A.G.G.M., Hudgins, D.M., Allamandola, L.J., 2001, A&A, 370, 1030
- Keane et al. (2004) Keane, J.V., et al., 2004, in prep.
- Norris et al. (1988) Norris, R.P., Kesteven, M.J., Allen, D.A., Troupe, E., 1988, MNRAS, 234, 51P
- Peeters et al. (2002) Peeters, E., et al., 2002, A&A, 381, 571
- Peeters, Spoon & Tielens (2004) Peeters, E., Spoon, H.W.W., Tielens, A.G.G.M., 2004, ApJ, submitted
- Rigopoulou et al. (1999) Rigopoulou, D., Spoon, H.W.W., Genzel, R., Lutz, D., Moorwood, A.F.M., Tran, Q.D., 1999, AJ, 118, 2625
- Roy & Norris (1997) Roy, A.L., Norris, R.P., 1997, MNRAS,289, 824
- Soifer et al. (1987) Soifer, B.T., Sanders, D.B., Madore, B.F., Neugebauer, G., Danielson, G.E., et al., 1987, ApJ, 320, 238
- Soifer et al. (2002) Soifer, B.T., Neugebauer, G., Matthews, K., Egami, E., 2002, AJ, 124, 2980
- Spoon et al. (2001) Spoon, H.W.W., Keane, J.V., Tielens, A.G.G.M., Lutz, D., Moorwood, A.F.M., 2001, A&A, 365, L353
- Spoon et al. (2002) Spoon, H.W.W., Keane, J.V., Tielens, A.G.G.M., Lutz, D., Moorwood, A.F.M., Laurent, O., 2002, A&A, 385, 1022
- Sturm et al. (2000) Sturm, E., Lutz, D., Tran, D., Feuchtgruber, H., Genzel, R., et al., 2000, A&A, 358, 481
- Tran et al. (2001) Tran, Q.D., et al., 2001, ApJ, 552, 527
- Vermeij et al. (2002) Vermeij, R., Peeters, E., Tielens, A.G.G.M., van der Hulst, J.M., 2002, A&A, 382, 1042
- Werner et al. (2004) Werner et al., ApJS, this volume
- Wexler (1967) Wexler, A.S., 1967, Applied Spec. Rev., 1, 29