Identification of luminous infrared galaxies at z 2.5 1,2,3,4,5,6
Abstract
We present preliminary results on 24 m detections of luminous infrared galaxies at with the Multiband Imaging Photometer for Spitzer (MIPS). Observations were performed in the Lockman Hole and the Extended Groth Strip (EGS), and were supplemented by data obtained with the Infrared Array Camera (IRAC) between 3 and 9 m. The positional accuracy of 2″ for most MIPS/IRAC detections provides unambiguous identifications of their optical counterparts. Using spectroscopic redshifts from the Deep Extragalactic Evolutionary Probe survey, we identify 24 m sources at in the EGS, while the combination of the MIPS/IRAC observations with ancillary data in the Lockman Hole also shows very clear cases of galaxies with photometric redshifts at .
The observed 24 m fluxes indicate infrared luminosities greater than L⊙, while the data at shorter wavelengths reveal rather red and probably massive () galaxy counterparts. It is the first time that this population of luminous objects is detected up to in the infrared. Our work demonstrates the ability of the MIPS instrument to probe the dusty Universe at very high redshift, and illustrates how the forthcoming Spitzer deep surveys will offer a unique opportunity to illuminate a dark side of cosmic history not explored by previous infrared experiments.
1 Introduction
In the past few years, deep observations in the infrared and submillimeter revealed a population of high redshift galaxies emitting the bulk of their luminosity between 8 and 1000 m, whose cosmological significance had been previously missed or severly underestimated by optical surveys because of extinction effects due to dust. These sources, likely the analogs of the local Luminous and Ultra-Luminous InfraRed Galaxies (respectively LIRGs: L LL L⊙, and ULIRGs: L L⊙) played a crucial role through the cosmic ages. At mid-infrared wavelengths, results from the Infrared Space Observatory () mission show that the evolution of these powerful objects noticeably contributed to the global star formation history at (Elbaz et al. 1999; Flores et al. 1999). Observations with SCUBA at 850 m also led to the discovery of extremely bright infrared sources mainly located at and characterized by a space density 1000 times larger than observed in the local Universe (e.g., Chapman et al. 2003).
From the purely observational point of view though, very little is currently known about the potential importance of dusty sources at . This is explained on one hand by sensitivity limitations of the infrared instruments previously used, such as ISOCAM and ISOPHOT on-board , and on the other hand by the SCUBA surveys being mostly sensitive to L L⊙ galaxies which were much more numerous at 2-3. Current knowledge indicates that a large fraction of today’s stars were probably born at (e.g., Dickinson et al. 2003; Calura & Matteucci 2003), before the global activity of star formation began to decrease rapidly down to (Lilly et al. 1996).
The recently commissioned Multiband Imaging Photometer for Spitzer (hereafter MIPS) on-board Spitzer provides a unique opportunity to address this issue. For sources at , its 24 m band is particularly suitable for detecting the possible redshifted emission from the 8 m broad-band feature commonly seen in infrared galaxy spectra, while the main 15 m filter on ISOCAM was rather more adapted for detecting this feature at . Here we assess the capabilities of the MIPS instrument to shed light on a yet unexplored side of galaxy evolution, and present our preliminary results on the detection of infrared galaxies at 24 m. This work is one facet of a larger set of publications also addressing source number counts at 24, 70 and 160 m (Papovich et al. 2004; Dole et al. 2004), IR model interpretation (Lagache et al. 2004), as well as the relation between the MIPS-selected objects and other populations such as the SCUBA/MAMBO and VLA galaxies (Egami et al. 2004; Ivison et al. 2004; Serjeant et al. 2004) and X-ray sources (Alonso-Herrero et al. 2004; Rigby et al. 2004). Throughout the paper, a CDM cosmology with H0 = 70 km s-1 Mpc-1, = 0.3 and is assumed.
2 Observations and data analysis
We performed 24 m observations111Spitzer Prog. IDs 8 & 1077. with MIPS (Rieke et al. 2004) in a 5’5’ area of the Lockman Hole (LH, , , J2000) as well as in a 210’ region of the Extended Groth Strip (EGS, , , J2000). Data in the Lockman Hole were obtained in the MIPS “photometry mode”, with a series of dithered exposures allowing a high frame redundancy and efficient cosmic ray rejection (see Egami et al. 2004 for more details). Observations in the EGS were performed with the MIPS “slow scan” technique, an observing mode that allows coverage of large sky areas with high efficiency. Data reduction was carried out using the MIPS Data Analysis Tool (Gordon et al. 2004). Effective integration times of 250 s and 450 s per sky pixel were reached respectively for the Lockman Hole and EGS data, leading to a 24 m 1 rms 35 Jy (LH) and 25 Jy (EGS). The astrometry of the Groth Strip final mosaic was refined using bright objects also listed in the 2MASS catalog (Jarrett et al. 2000), while source positions in our smaller coverage of the Lockman Hole were matched against an abundant set of ancillary data (see below). We estimate the absolute astrometry accuracy to be better than 2″. Point source extraction and photometry were performed as described by Papovich et al. (2004).
Both fields were also observed with the Spitzer InfraRed Array Camera (hereafter IRAC, Fazio et al. 2004) at 3.6, 4.5, 5.8 and 8 m, down to 5 rms 1.2, 1.1, 6.5 and 8.0 Jy respectively. A detailed description of the IRAC data analysis is presented by Huang et al. (2004). In addition, we retrieved /WFPC2 images of the EGS from the public database of the Deep Extragalactic Evolutionary Probe (DEEP) team222see http://deep.ucolick.org, and a set of ancillary observations of the Lockman Hole was collected in the optical and the near-infrared (NIR) to supplement our Spitzer program. For the latter, we made use of archival –band images from the Wide Field Camera (WFC) of the Isaac Newton Telescope (INT), while data were obtained with the UH8K camera on the Canada–France–Hawaii Telescope (-bands), the Suprime-CAM instrument on the Subaru Telescope (-band), TIFKAM on the 2.1m Telescope of Kitt Peak (-band) and Omega-Prime on the 3.5m Telescope of Calar Alto (-band). Limiting Vega magnitudes (3 level) of 26.0, 24.0, 27.0, 24.0, 22.0, 20.5, 20.0 mag arcsec-2 were respectively derived in the filters. Source detection and photometry were carried out with Sextractor (Bertin & Arnouts 1996).
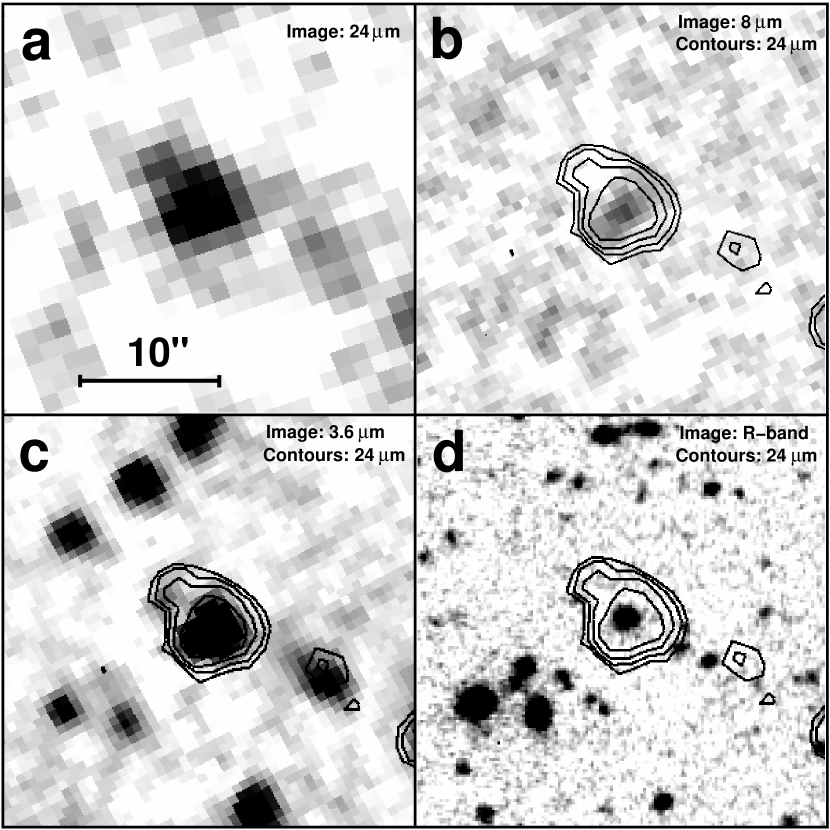
For the Lockman Hole data, the full-width at half maximum of the PSF goes from 1″ in the optical/NIR bands to 2″ and 6 in the IRAC and MIPS images, which gave us confidence in identifying the respective counterparts at each wavelength (see an illustration in Fig. 1). Merged catalogues among the different filters were then built, starting with matching the coordinates of the 24 m sources in the deep -band image. Following Kron (1980), we estimated the total flux for each object detected in the image using an elliptical aperture derived from an isophotal fit around the given source, and translated those apertures to the other optical and NIR data to obtain integrated fluxes for the corresponding filter (in all cases the apertures were large enough to enclose the PSF profile). IRAC and MIPS fluxes were derived respectively with circular aperture photometry and PSF fitting (see Huang et al. 2004; Papovich et al. 2004).
3 Results: Infrared galaxies at
3.1 Spectroscopic redshifts
Our source position catalog in the EGS region was compared to the DEEP1 database of galaxies with spectroscopic redshifts (Weiner et al., in preparation). Though most of objects from this survey clearly lie at , we identified from our 24 m observations nine galaxies at , and two other sources at =1.43 and = whose redshifts were respectively derived from H (Hopkins et al. 2000) and Fe II absorption lines (B. Weiner, priv. communication). From their observed 24 m fluxes and using the luminosity-dependent spectral energy distribution (SED) templates from the model of Lagache et al. (2004), we then estimated their infrared luminosities between 8 and 1000 m. Even though the exact relation between the mid- and total IR galaxy emission is not yet well understood, there are some indications that the mid- to far-infrared correlation still holds in the distant Universe (Appleton et al. 2004), and the L24μm/LIR ratio anyhow varies by less than a factor of 2–3 for most model SEDs at high reshifts (e.g., Papovich & Bell 2002). With this caution in mind, we found 4 sources with 41011L L L⊙, 6 galaxies with 1012 L L 31012 L⊙, and one hyper luminous system characterized by LIR=2.51013 L⊙. Given that the objects from the DEEP1 database are optically bright, we note that these luminous sources likely have higher optical/IR flux ratios than those of more obscured infrared galaxies. This underlies the importance of obtaining near-IR and mid-IR (e.g., IRS/Spitzer) spectroscopy as well as accurate photometric redshifts to study all types of IR–luminous objects.
3.2 Photometric redshifts
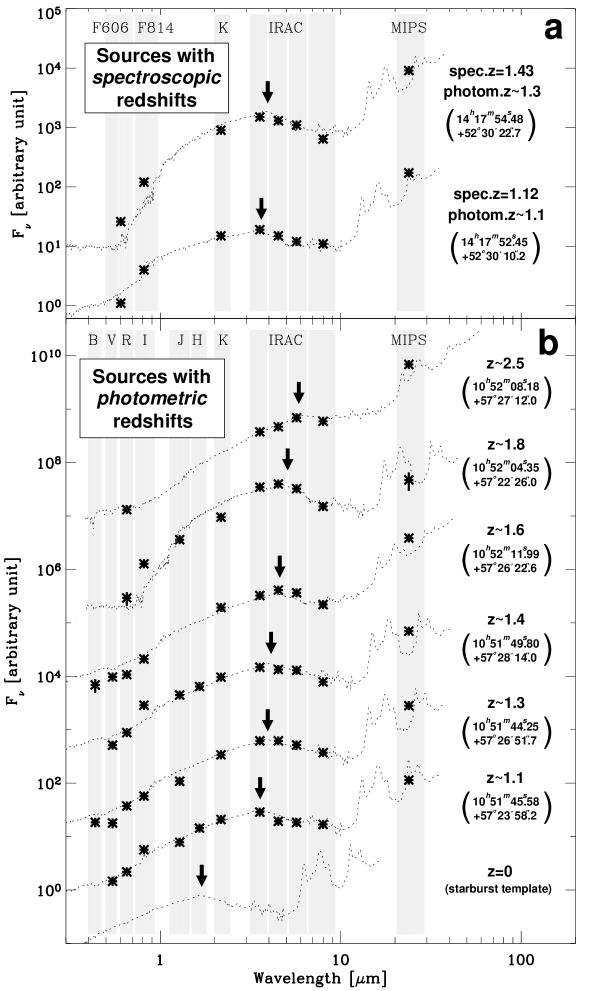
For distant galaxies, our analysis of SEDs for EGS sources with spectroscopic redshifts indicates that the combination of the 4 IRAC bands with optical and NIR data allows locating with good accuracy the spectral feature produced both by the stellar H- opacity minimum at rest-frame 1.6 m and the global shape of the underlying stellar continuum. This characteristic of galaxy SEDs provides a key indication for photometric redshift determinations (Huang et al. in preparation, see also Simpson & Eisenhardt 1999; Sawicki 2002). Figure 2a illustrates this result in the case of two representative sources of our sample, whose broad-band SEDs lead to photometric redshifts in good agreement with those determined from optical spectroscopy.
Relying on this new approach, we used our optical/NIR and IRAC data to locate 24 m selected sources with photometric redshifts . The analysis of the complete MIPS data set in the EGS is still in progress. We present in this preliminary study the results we obtained for the Lockman Hole. Over the 5’5’ area covered by MIPS, we identify at least 25 objects characterized by a rather prominent stellar bump revealing an unambiguous redshift larger than 1. Figure 2b shows the /IRAC/MIPS broad-band SEDs of several of these sources spanning the redshift range, with the best galaxy template fitted to our data. These templates were built by combining the optical/NIR spectral range emission modeled by Devriendt et al. (1999) with the infrared SEDs from the model of Lagache et al. (2004). For several objects showing a rather high MIPS to IRAC flux ratio, an additional contribution from a hot dust continuum (i.e., Very Small Grains) was arbitrarily added (see Gallais et al. 2004 for more details on the method). In this first attempt to locate galaxies using the 1.6 m stellar bump, we relied on a simple “by-eye” fit which clearly gives a sufficient constraint (i.e., z0.2) for the cases shown in Fig. 2. We emphasize that the few SEDs shown in Fig. 2 were not chosen to be globally representative of our galaxy sample at similar redshifts, but correspond to 24 m sources detected at least in the /IRAC bands and for which a photometric redshift could be reliably obtained from the spectral feature produced at rest-frame 1.6 m. This naturally biases the selection against sources with a rather shallow stellar bump like the active nuclei (see Alonso-Herrero et al. 2004). This issue will obviously have to be taken into account in future studies of more complete samples.
Table 1 summarizes general properties of our sample in the Lockman Hole. As in the EGS, the estimated redshifts and observed 24 m fluxes indicate infrared luminosities characterized by L L⊙. The rest-frame optical and NIR properties reveal rather red colors (i.e., observed ) originating either from an evolved stellar population or a young reddened starburst. They also indicate high luminosities in the rest-frame near-infrared, which suggests the presence of rather massive objects ().
Finally, we note that only one of these sources is detected in the deep X-ray observations of the Lockman Hole by XMM (Hasinger et al. 2001). In conjunction with the galaxy-like templates fitting their optical SEDs, the X-ray non-detections suggest that these galaxies are mostly dominated by star-forming activity, even if the presence of an active nucleus can not be fully excluded by the data (see Alonso-Herrero et al. 2004).
4 Discussion and Conclusion
We stress that our reported number of 24 m-selected infrared galaxies at is obviously a lower limit on their density at these redshifts, since we only selected sources characterized by a well-defined stellar bump in the rest-frame near-infrared. This limit agrees with the predictions of the various models dealing with infrared galaxy evolution (e.g., Lagache et al. 2004).
Our selected sources exhibit a rather wide range of MIPS to IRAC flux ratios and optical/NIR SED shapes. This suggests a possibly large diversity in the properties of infrared galaxies at high redshift. It is also interesting to note that the most distant sources of our sample tend to have extremely red colors from the to the 24 m band, with a global SED best fitted by ULIRG templates such as the one from Arp 220. Finally, our data suggest the presence at high redshift of the broad-band emission features often seen in the mid-infrared spectra of local galaxies and commonly attributed to large molecules transiently heated by UV photons. Even though we can not completely exclude a steeply rising continuum accounting for the 24 m emission, the observed MIPS/IRAC flux ratios are indeed difficult to reproduce without a significant contribution from these features (see Fig. 2). A similar conclusion is reached by Lagache et al. (2004) based on the modeling of the MIPS 24/70/160 m source number counts.
Since the late 1990’s, there have been a wealth of discoveries at very high redshift (e.g., ), while little progress has been made in the redshift range (but see Steidel et al. 2004). Yet, galaxy evolution at played a central role in the cosmic growth of structures and the assembly of galaxies (Ellis 2001). MIPS provides a unique opportunity to explore the star formation and black hole accretion history at these redshifts. Compared to previous models for instance, the new predictions by Lagache et al. (2004) based on the MIPS source number counts indicate a high density of 1.5 LIRGs/ULIRGs, the first of which have just been identified in this paper. The MIPS deep surveys will reveal the evolution of luminous and massive galaxies at , bridging the gap between the different populations revealed by and SCUBA. Combining with sources at similar redshifts but selected with different techniques (e.g., Balmer-break galaxies) will also give us new clues on galaxy evolution.
References
- Alonso-Herrero et al. (2004) Alonso-Herrero, A., Pérez-González, P.G., Rigby, J., et al. 2004, ApJS, this volume
- Appleton et al. (2004) Appleton, P., et al. 2004, ApJS, this volume
- Bertin & Arnouts (1996) Bertin, E. & Arnouts, S. 1996, A&AS, 117, 393
- Calura & Matteucci (2003) Calura, F. & Matteucci, F. 2003, ApJ, 596, 734
- Chapman et al. (2003) Chapman, S. C., Blain, A. W., Ivison, R. J., & Smail, I. R. 2003, Nature, 422, 695
- Devriendt et al. (1999) Devriendt, J., Guiderdoni, B., & Sadat, R. 1999, A&A, 350, 381
- Dickinson et al. (2003) Dickinson, M., Papovich, C., Ferguson, H. C., & Budavári, T. 2003, ApJ, 587, 25
- Dole et al. (2004) Dole, H., Le Floc’h, E., Pérez-González, P., et al. 2004, ApJS, this volume
- Egami et al. (2004) Egami, E., Dole, H., Huang, J.-S., et al. 2004, ApJS, this volume
- Elbaz et al. (1999) Elbaz, D., Cesarsky, C. J., Fadda, D., et al. 1999, A&A, 351, L37
- Ellis (2001) Ellis, R. 2001, “Galaxy Formation and Evolution: Recent Progress, XIth Canary Islands Winter School of Astrophysics” (astro-ph/0102056)
- Fazio et al. (2004) Fazio, G., et al. 2004, ApJS, this volume
- Flores et al. (1999) Flores, H., Hammer, F., Désert, F. X., et al. 1999, A&A, 343, 389
- Gallais et al. (2004) Gallais, P., Charmandaris, V., Le Floc’h, E., et al. 2004, A&A, 414, 845
- Gordon et al. (2004) Gordon, K., Rieke, G., Engelbracht, C., et al. 2004, PASP, submitted
- Hasinger et al. (2001) Hasinger, G., Altieri, B., Arnaud, M., et al. 2001, A&A, 365, L45
- Hopkins et al. (2000) Hopkins, A., Connolly, A. and Szalay, A. 2000, AJ, 120, 2843
- Huang et al. (2004) Huang, J.-S., Barmby, P., Fazio, G., et al. 2004, ApJ, this volume
- Ivison et al. (2004) Ivison, R.J., Serjeant, S., Greve, T.R., et al. 2004, ApJS, this volume
- Jarrett et al. (2000) Jarrett, T. H., Chester, T., Cutri, R., et al. 2000, AJ, 119, 2498
- Kron (1980) Kron, R.G. 1980, ApJS, 43, 305
- Lagache et al. (2004) Lagache, G., Dole, H., Puget, J.-L., et al. 2004, ApJ, this volume
- Lilly et al. (1996) Lilly, S. J., Le Fevre, O., Hammer, F., & Crampton, D. 1996, ApJ, 460, L1
- Papovich & Bell (2002) Papovich, C. & Bell, E. F. 2002, ApJ, 579, L1
- Papovich et al. (2004) Papovich, C., Dole, H., Egami, E., et al. 2004, ApJS, this volume
- Rieke et al. (2004) Rieke, G., Young, E., Engelbracht, C., et al. 2004, ApJS, this volume
- Rigby et al. (2004) Rigby, J., Rieke, G., Maiolino, R., et al. 2004, ApJS, this volume
- Sawicki (2002) Sawicki, M. 2002, AJ, 124, 3050
- Serjeant et al. (2004) Serjeant, S., Mortier, A.M.J., Ivison, R.J., et al. 2004, ApJS, this volume
- Simpson & Eisenhardt (1999) Simpson, C. & Eisenhardt, P. 1999, PASP, 111, 691
- Steidel et al. (2004) Steidel, C. C., Shapley, A. E., Pettini, M., et al. 2004, ApJ, 604,534
| Redshift | typea | Nob | LIR(1011L⊙)c | MKc,d |
|---|---|---|---|---|
| 1.0 – 1.5 | Red Sp. | 3 | 4 | |
| Starb. | 11 | 6 | ||
| VLIRG | 3 | 18 | ||
| 1.5 – 2.0 | Red Sp. | 1 | 4 | |
| VLIRG | 7 | 26 | ||
| 2.0 – 2.5 | VLIRG | 3 | 58 |