Imaging of High Redshift Submillimeter Galaxies at 16 and 22 with the Spitzer/IRS111The IRS was a collaborative venture between Cornell University and Ball Aerospace Corporation funded by NASA through the Jet Propulsion Laboratory and the Ames Research Center. Peak-up Cameras: Revealing a population at z2.5222Based on observations obtained with the Spitzer Space Telescope, which is operated by JPL, California Institute of Technology for the National Aeronautics and Space Administration.
Abstract
We present broad band imaging observations obtained with the “peak up” imagers of the Spitzer Space Telescope Infrared Spectrograph (IRS) at wavelengths of 16 m and 22 m for a number of sources detected primarily at submillimeter wavelengths, which are believed to be at high, though undetermined, redshift. We targeted 11 sources originally detected by SCUBA and 5 submillimeter sources detected at 1.2mm by MAMBO. Two optically discovered quasars with z6 were also observed to determine if there is detectable dust emission at such high redshifts. Seven of the submillimeter sources and both high-redshift quasars were detected, and upper limits of about 50 Jy apply to the remainder. Using their mid-/far-IR colors, we demonstrate that all of the submillimeter sources are at z1.4. The mid-IR colors for two of our detections and three of our strong upper limits suggest that these galaxies must be at z2.5. We also introduce a technique for estimating redshifts and source characteristics based only on the ratio of fluxes in the 16 m and 22 m images.
Subject headings:
dust, extinction — infrared: galaxies — galaxies: submillimeter — galaxies: high-redshift – galaxies: AGN — galaxies: starburst1. Introduction
It is currently widely accepted that the energy production in the universe, often quantified with the star formation rate (SFR), increases by more than an order of magnitude as we move from the local Universe to z2 (e.g., Madau et al., 1998). Interstellar dust, a direct product of star formation and evolution, often obscures and absorbs the light emitted from stars or non-thermal sources and reradiates at longer wavelengths in the mid- and far-infrared (mid-IR/far-IR) and submillimeter. The results of IRAS, launched more than 20 years ago, have demonstrated that in the local universe 6% of the total infrared emission originates from the centers of galaxies which are highly enshrouded by dust and therefore are extremely difficult to probe through direct observations in the optical and near-infrared (near-IR). These are the luminous and ultraluminous infrared galaxies (LIRGs/ULIRGs) (e.g., Houck et al., 1984). Deep IR extragalactic surveys, mainly performed at 15m with the Infrared Space Observatory (ISO), recently revealed a strong evolution in galaxy counts such that at z1 a large fraction of the cosmic infrared background (CIRB) is due to LIRGs and ULIRGs (Franceschini et al., 2001; Elbaz et al., 2002a; Elbaz & Cesarsky, 2003; Metcalfe et al., 2003). Furthermore, deep maps with the Sub-mm Common User Bolometric Array (SCUBA), as well as studies with the Max-Plank Millimeter Bolometer (MAMBO), have shown that almost 100% of the submillimeter background can be resolved into individual sources, most of which are too faint for optical spectroscopy (see Blain et al., 2002, for a review).
Unlike the majority of ISO sources detected at 15m, for which direct optical imaging and redshift measurements were feasible (see Franceschini et al., 2001; Elbaz et al., 2002a), the nature of the submillimeter galaxy (SMG) population is much more elusive. More than 300 SMGs have been detected to date, but their faintness in the optical and near-IR and the positional uncertainty of the 13′′ SCUBA beam made a secure identification of a counterpart at those wavelengths very challenging. The typical spectral energy distribution (SED) of a dusty galaxy produces a negative K correction in the mm and sub-mm for high redshift systems, making detection of such sources much easier than at shorter wavelengths. The observed surface density of SCUBA sources and estimated photometric redshifts imply that the co-moving density of a high redshift, L☉ population of galaxies is 400 times greater than in the local universe (Blain et al., 2002). Confirmation that such high-redshift sources are present was achieved by Chapman et al. (2003) who used optical spectroscopy and accurate radio continuum positions (Barger et al., 2000; Ivison et al., 2002) to measure the redshifts for ten such sources and show that for this population the median redshift is 2.4.
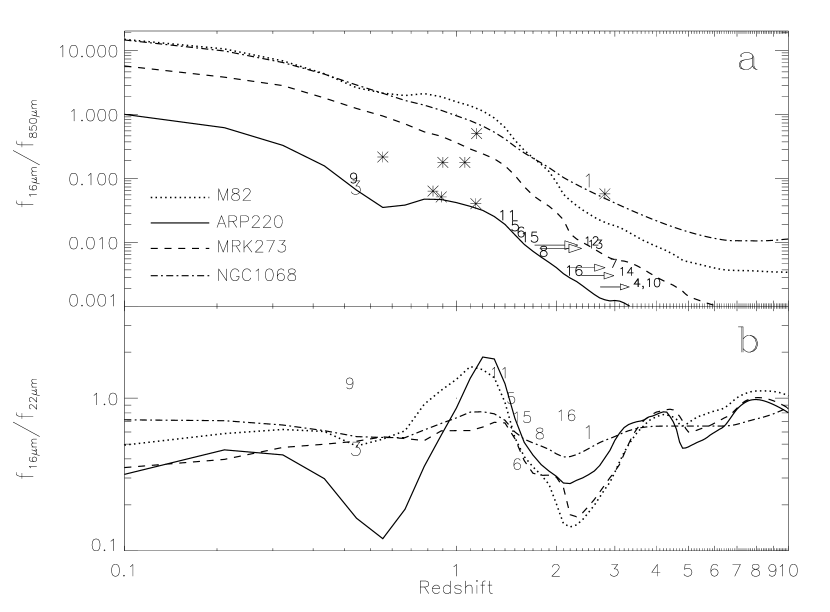
It remains crucial to develop diagnostics for understanding the nature of these luminous, primordial sources and to determine accurate redshifts so that their evolution can be traced. Optical observations probe the rest-frame ultraviolet or blue continuum, which only characterizes the small fraction of luminosity that escapes the dust. Observations at longer rest frame wavelengths can place important constrains on the properties of dust as well as the physics of the dominant ionizing source and are essential if the optical is invisible (i.e. Frayer et al., 2004). Near-IR spectroscopy even with 8m telescopes is extremely difficult for SMGs, which typically have an mmag, so the mid-IR is the next available wavelength window. Combining the results of the deep surveys performed with ISO and SCUBA over the past 7 years, only 11 galaxies have been observed at both 15m and 850m, and redshifts have been determined for 9 of them (see Fig.1a). Seven of the SMGs were detected because of favorable gravitational amplification of their emission by foreground lensing clusters (Metcalfe et al., 2003), two were identified in the CFRS14 field (Lilly et al., 1999; Flores et al., 1999; Higdon et al., 2004), one was found in the Hubble Deep Field (Hughes et al., 1998; Aussel, et al., 1999), and one, HR10, is an extremely red object (ERO) at z=1.44 (Elbaz et al., 2002b).
The superb sensitivity of the Spitzer Infrared Spectrograph (IRS) (Houck et al., 2004), and the ability of the IRS to efficiently obtain 16m and 22m images to levels of several tens of Jy and follow-up spectra to a level of 0.5mJy opens a unique opportunity to examine the mid-IR emission from SMGs. In this paper we present our first results from a program of targeted observations of a number of such sources. We discuss selection criteria and observing strategy in section 2, results are presented in section 3, and our conclusions can be found in section 4.
2. Observations
The targets were selected from a number of recent submillimeter catalogs, with several objectives. Primarily, we wished to obtain mid-IR images of sources for which no positive identification had been made with an optical counterpart, or for which no redshift had been obtained but was expected to be z1. Various sources with no optical counterparts will be found by Spitzer deep surveys in the mid-IR, so it is important to begin calibrating the properties of samples derived in other ways which may have similarities to such sources. The 16m to 850m ratios can improve estimates of the probable redshift. We can also utilize the 16m to 22m flux ratio to determine the slope of the infrared spectrum or the presence in one or the other band of any strong polycyclic aromatic hydrocarbon (PAH) emission features or silicate absorption features. The final objective of our imaging survey of SMGs was to determine whether any are bright enough for an IRS spectroscopic follow-up which can give a precise redshift measurement333For f0.7mJy we can obtain a 20–38m spectrum with a detection in 1hr.. In addition to observing the submillimeter sources, we added two quasars at very high redshift (z 6) identified by the Sloan Digital Sky Survey to determine if such distant quasars also have sufficient re-emission from dust to be detectable in Spitzer deep surveys. One of these quasars, J1148+5251, has many characteristics of the extreme submillimeter sources; it has M☉ of molecular gas and an L(FIR) L☉ (Walter et al., 2003), has been detected by MAMBO (f1.2mm=5.00.6mJy), and is estimated to contain M☉ of dust (Bertoldi et al., 2003). Whether sufficiently hot dust is present in such AGN to be seen at the much shorter wavelengths observed in the rest frame is important to know for interpreting other sources. All of our targets were observed during the first 3 IRS campaigns that took place between 14 December 2003 and 9 February 2004.
We used the blue and red peak up cameras located in the short low module of the IRS to observe our targets at 16m (13.5–18.7m) and 22 m(18.5–26.0m). By using the Spitzer focal plane as the reference frame, it is possible to program observations to obtain dithered observations in both the 16m and 22 m images as a standard IRS short low first order (SL1) staring AOT (see Houck et al., 2004) with the targets defined of type “fixed cluster offsets” on the plane of the array. The offsets, in arcsecs parallel and perpendicular to the SL1 slit, were set to (-62′′, 289′′) and (50′′, 284′′) for the centers of the blue and red peak up windows respectively. When the telescope was performing the standard nodding pattern on the SL1 slit, the actual target was imaged at two positions on the peak up cameras separated by 18′′. This approach enables us to obtain both images with a single telescope pointing, and also to collect the data in the “raw mode”, which allows flexible image analysis.
The data were processed by the standard IRS pipeline (version S9.1) at the Spitzer Science Center (see chapter 7 of Spitzer Observing Manual444http://ssc.spitzer.caltech.edu/documents/som/). The 2D images were converted from slopes after linearization correction, subtraction of darks, and cosmic ray removal. The resulting images were divided by the photometric flat, and a world coordinate system was inserted into them using the reconstructed pointing of the telescope. The astrometric accuracy of our images is better than 2′′ and the FWHM of the point spread function is 3.5′′ and 4.8′′ at 16m and 22m respectively. Since we typically had multiple images of the same target, we used the astrometry information to shift and co-add our pointings, as well as to perform sky subtraction by taking the differences of the two nod positions. Flux calibration was performed using a number of stars for which high quality spectral templates were available. The properties of all targets observed are presented in Table 1. Our photometric uncertainties are less than 10%. The detection limit of the peak up cameras depends rather strongly on the brightness of the background. Since the targets observed are in a low background region with surface brightness 20MJy sr-1, the 1 detection limit is 30Jy for an integration time of 120sec at 16m and 240sec at 22m.
3. Results
As we show in Table 1, we were able to detect 10 out of the 16 submillimeter targets at , including all 3 sources for which there are published redshifts. Only one source, CFRS 10.1411 at just z=0.07 (Lilly et al., 1999), is above 1mJy. The fluxes of the remainder of the SMG detections are on the order of a few hundred Jy in both 16 and 22m. No source without a known redshift is above the f22μm=0.7mJy. The two quasars, J1048+4637 and J1148+5251, with redshifts of 6.23 and 6.42, respectively, were also detected. Given their extreme redshift, our measurements probe their rest frame near-IR emission (2–3m) which is likely due to a hot dust component. This is especially significant for J1148+5251, a strong submillimeter source, because it could be used to explore whether AGN at high redshift which have sufficient cool dust for submillimeter emission can contain a hot dust component. It also illustrates the challenges in determining the primary luminosity source (starburst or AGN) for the “submillimeter” population.
When we combine our measurements from the IRS peak up filters with the SCUBA 850m points, we can bracket the peak of the infrared SED of a source, typically found at 80m in the rest frame, and obtain a photometric estimate of its redshift. In a manner similar to the discussion of Lilly et al. (1999) in exploring the ISO 15m to 850m colors, we calculated the f16μm/f850μm ratio as a function of z for a number of various template SEDs. Our results for a few selected templates are presented in Figure 1a. We can see that as the source moves to higher z, due to the negative K correction the flux sampled by SCUBA at 850m remains relatively flat or decreases only slightly. The rate of the decrease clearly depends on where the far-IR SED peaks and it is faster(slower) when the galaxy has warmer(colder) far-IR color. The flux measured by our 16m peak up window decreases much more rapidly up until z1 when the rest frame 6–8m range begins to enter the window. Beyond that point the details depend on features in the mid-IR spectrum of the source. If a source has a featureless mid-IR continuum with weak PAH emission such as an AGN dominated template (i.e. NGC 1068), the f16μm flux would decrease monotonically. The situation is a bit more complex if strong PAH emission features (such as those seen in M82) or silicate absorption (as in the case of Arp 220) are present in the spectrum. It is evident from Figure 1a that given a sufficiently large sample of possible templates we can define a lower limit to the possible f16μm/f850μm at a given redshift. Calculating this ratio as a function of z for a wide range of known SEDs suggests that at any given z0.5, where most SMGs are found, an SED similar to that of Arp 220 provides the most conservative limit of the possible value f16μm/f850μm. By measuring this ratio for our SMG targets, we can obtain the absolute lower limit for their redshift, assuming this SED.
To demonstrate this, we also plot in Figure 1a, along with our data, all SMG sources for which redshifts and ISO 15m fluxes have been published to date555Given the similarities between the ISO 15m (LW3) and the IRS 16m blue peak up filters, as well as the possible shapes of the mid-IR SEDs for the ISO detected SMGs we have set their f16μm f15μm 10%.. We see that all SMGs of known redshift have f16μm/f850μm ratios placing them between Arp 220 and Mrk 273. An accurate estimate of the redshift clearly depends on the assumed SED of the source. Our conservative method indicates that with one exception666We cannot explain at this point why source #9 despite its strong detection and the fact that radio/sub-mm data suggest a z2.4 (Barger et al., 2000), has rather peculiar mid-IR and sub-mm colors. all SMGs in Table 1 with no known redshift must be at z1.4. Even if at z1.5, a source like Arp 220 would have an m23.5mag, well within spectroscopic capabilities from the ground. Our upper limits for the f16μm/f850μm ratio on sources #4, #10 and #14 suggest that these sources are beyond z2.5.
Interestingly, the highest redshift (z=2.8) known ISO source, SMM 02399-0136 in Abell 370 (Metcalfe et al., 2003), as well as our target #1, the ERO N4 of Frayer et al. (2003), are located very close to the pure AGN locus (NGC 1068). If the SMGs are indeed warm AGN-like sources following the SEDs discussed by Blain (1999), then our Arp 220 limit is extremely conservative. In this case, the luminosity of these sources would derive from a scaled up version of an enshrouded AGN, and the thermal emission from the AGN in the 1–6m rest frame will enter into our 13m–18m blue peak up window at z2. This will increase the expected f16μm/f850μm ratio by a factor of 8, as seen in Figure 1a, so that the necessary redshifts will easily exceed z.
We can also begin to investigate whether it will eventually prove possible to get reliable photometric redshifts from the 16m and 22m imaging data alone, and to use this mid-infrared flux ratio for diagnostic information on the dominance of an AGN or a starburst. The concept of this is illustrated in Figure 1b. Galaxies whose mid-IR luminosities derive primarily from starbursts are characterized by strong PAH emission features (e.g. Brandl et al., 2004), whereas AGN generally produce dust continua without PAH emission but often with silicate absorption (e.g. Laurent et al., 2000). While we intend to calibrate the effect with many more spectroscopic observations of known starbursts and AGN, we illustrate in Figure 1b the changes that would be expected in the f16μm/f22μm ratio for templates like the ISO spectra of the starburst M82 (Sturm et al., 2000), the AGN NGC 1068 (Le Floc’h et al., 2001), and the more enshrouded sources Arp 220 (Spoon et al., 2004) and Mrk 273 (Devriendt et al., 1999). Note that even though NGC 1068 hosts a Sy2 nucleus affected by considerable extinction in the optical, it displays a nearly power-law continuum with very weak PAH and silicate features in the mid-IR (Sturm et al., 2000; Le Floc’h et al., 2001). Over a broad range of redshifts for z1, the approximately power-law spectrum of this AGN means, therefore, that the 16m to 22m flux ratio has a narrow range, from 0.7 to 0.9, whereas this ratio for other sources with stronger spectral features ranges between extremes of 0.1 to 1.7. It is clear that this flux ratio information is potentially useful for constraining source characteristics and redshifts. For illustration, we apply this concept to the present results in Table 1 by plotting sources in Figure 1b at the redshifts corresponding to the minimum redshift determined from the f16μm/f850μm ratio. Only sources #6, #9, and #11 have ratios considerably outside the expected NGC 1068 values. Having the ratios shown implies that these 3 sources have strong spectral features and, for sources #6 and #11, yields redshift estimates consistent with those derived from the f16μm/f850μm ratio in Figure 1a.
4. Conclusions
The unprecedented sensitivity of the IRS peak up cameras has enabled us to perform efficient imaging of 16 SMGs at 16m and 22m. Ten of these sources are detected, which doubles the number of mid-IR detections for sources discovered through submillimeter surveys. Using a number of SED templates along with the observed f16μm/f850μm ratios or upper limits, we have shown that 13 of these SMG sources must be located at z1.4, with some being constrained to z2.5. We also introduce use of the observed f16μm/f22μm ratio to constrain photometric redshifts, and to demonstrate that some of the SMGs must have mid-infrared spectra similar to those of AGN.
References
- Aussel, et al. (1999) Aussel, H., Cesarsky, C. J., Elbaz, D., & Starck, J. L. 1999, A&A, 342, 313
- Barger et al. (2000) Barger, A. J., Cowie, L. L., & Richards, E. A. 2000, AJ, 119, 2092
- Bertoldi et al. (2003) Bertoldi, F., Carilli, C. L., Cox, P., Fan, X., Strauss, M. A., Beelen, A., Omont, A., & Zylka, R. 2003, A&A, 406, L55
- Blain (1999) Blain, A. W. 1999, MNRAS, 304, 669
- Blain et al. (2002) Blain, A. W., Smail, I., Ivison, R. J., Kneib, J.-P., & Frayer, D. T. 2002, Phys. Rep., 369, 111
- Borys et al. (2002) Borys, C., Chapman, S. C., Halpern, M., & Scott, D. 2002, MNRAS, 330, L63
- Brandl et al. (2004) Brandl, B. R., et al. 2004, ApJS, this volume
- Chapman et al. (2003) Chapman, S. C., Blain, A. W., Ivison, R. J., & Smail, I. R. 2003, Nature, 422, 695
- Devriendt et al. (1999) Devriendt, J. E. G., Guiderdoni, B., & Sadat, R. 1999, A&A, 350, 381
- Eales et al. (1999) Eales, S., Lilly, S., Gear, W., Dunne, L., Bond, J. R., Hammer, F., Le Fèvre, O., & Crampton, D. 1999, ApJ, 515, 518
- Eales et al. (2003) Eales, S., Bertoldi, F., Ivison, R., Carilli, C., Dunne, L., & Owen, F. 2003, MNRAS, 344, 169
- Elbaz et al. (2002a) Elbaz, D., Cesarsky, C. J., Chanial, P., Aussel, H., Franceschini, A., Fadda, D., & Chary, R. R. 2002, A&A, 384, 848
- Elbaz et al. (2002b) Elbaz, D., Flores, H., Chanial, P., Mirabel, I. F., Sanders, D., Duc, P.-A., Cesarsky, C. J., & Aussel, H. 2002, A&A, 381, L1
- Elbaz & Cesarsky (2003) Elbaz, D. & Cesarsky, C. J. 2003, Science, 300, 270
- Flores et al. (1999) Flores, H., et al. 1999, ApJ, 517, 148
- Franceschini et al. (2001) Franceschini, A., Aussel, H., Cesarsky, C. J., Elbaz, D., & Fadda, D. 2001, A&A, 378, 1
- Frayer et al. (2003) Frayer, D. T., Armus, L., Scoville, N. Z., Blain, A. W., Reddy, N. A., Ivison, R. J., & Smail, I. 2003, AJ, 126, 73
- Frayer et al. (2004) Frayer, D. T., Reddy, N. A., Armus, L., Blain, A. W., Scoville, N. Z., & Smail, I. 2004, AJ, 127, 728
- Higdon et al. (2004) Higdon, S. J. U., et al. 2004, ApJS, this volume
- Houck et al. (1984) Houck, J. R., et al., 1984, ApJ, 278, L63
- Houck et al. (2004) Houck, J. R., et al., 2004, ApJS, this volume
- Hughes et al. (1998) Hughes, D. H., et al. 1998, Nature, 394, 241
- Ivison et al. (2002) Ivison, R. J., et al. 2002, MNRAS, 337, 1
- Laurent et al. (2000) Laurent, O., Mirabel, I. F., Charmandaris, V., Gallais, P., Madden, S. C., Sauvage, M., Vigroux, L., & Cesarsky, C. 2000, A&A, 359, 887
- Le Floc’h et al. (2001) Le Floc’h, E., Mirabel, I. F., Laurent, O., Charmandaris, V., Gallais, P., Sauvage, M., Vigroux, L., & Cesarsky, C. 2001, A&A, 367, 487
- Lilly et al. (1999) Lilly, S. J., Eales, S. A., Gear, W. K. P., Hammer, F., Le Fèvre, O., Crampton, D., Bond, J. R., & Dunne, L. 1999, ApJ, 518, 641
- Madau et al. (1998) Madau, P., Pozzetti, L., Dickinson, M. 1998, MNRAS, 498, 106
- Metcalfe et al. (2003) Metcalfe, L., et al. 2003, A&A, 407, 791
- Spoon et al. (2004) Spoon, H. W. W., Moorwood, A. F. M., Lutz, D., Tielens, A. G. G. M., Siebenmorgen, R., & Keane, J. V. 2004, A&A, 414, 873
- Sturm et al. (2000) Sturm, E., Lutz, D., Tran, D., Feuchtgruber, H., Genzel, R., Kunze, D., Moorwood, A. F. M., & Thornley, M. D. 2000, A&A, 358, 481
- Walter et al. (2003) Walter, F., et al. 2003, Nature, 424, 406
| RA | DEC | z | [ID]/Comments | |||||
|---|---|---|---|---|---|---|---|---|
| (J2000) | (J2000) | (mJy) | (mJy) | (mJy) | ||||
| 04:43:07.1 | 02:10:25.1 | 0.52 | 0.98 | 0.54 | 2.51 | 7.2 | 0.072 | [1] SMM J04431+0210(N4) in (1) |
| 10:00:37.2 | 25:14:57.9 | 1.88 | 2.55 | 0.73 | 0.07 | 4.7 | 0.400 | [2]aaUnlike the rest of the sources where the on source integration times were 120sec and 240sec at 16m and 22m, the corresponding times for these targets were 140sec and 280sec respectively. CFRS 10.1411 in (2) |
| 10:00:38.2 | 25:14:49.2 | 0.27 | 0.62 | 0.42 | 0.50 | 4.8 | 0.056 | [3] CFRS 10.1153 in (2) |
| 12:36:06.4 | 62:11:38.0 | 0.026 | 0.030 | - | [2.5] | 15.4 | 0.002 | [4] HDFSMM-3606+1138 in (4) |
| 12:36:18.4 | 62:15:49.2 | 0.12 | 0.13 | 0.92 | [1.5] | 7.8 | 0.015 | [5] #7 in (3) |
| 12:36:46.7 | 62:14:46.9 | 0.13 | 0.38 | 0.34 | [1.5] | 10.7 | 0.012 | [6] #33 in (3) |
| 12:36:52.32 | 62:12:26.3 | 0.025 | 0.041 | - | [2.0] | 7.0 | 0.004 | [7] HDF N(850.1) in (5) |
| 12:37:00.4 | 62:09:08.5 | 0.07 | 0.13 | 0.54 | [1.8] | 11.9 | 0.006 | [8] #49 in (3) |
| 12:37:09.5 | 62:08:39.5 | 0.70 | 0.61 | 1.15 | [0.5] | 8.3 | 0.084 | [9] #58 in (3) |
| 12:37:29.7 | 62:10:51.0 | 0.028 | 0.024 | - | [2.5] | 14.3 | 0.002 | [10] HDFSMM-3730+1051 in (4) |
| 14:17:40.2 | 52:29:06.5 | 0.19 | 0.14 | 1.35 | [1.4] | 8.8 | 0.022 | [11] CFRS 14A in (6) |
| 12:05:17.59 | -07:43:11.5 | 0.060 | 0.068 | - | [1.6] | 6.3 | 0.009 | [12]aaUnlike the rest of the sources where the on source integration times were 120sec and 240sec at 16m and 22m, the corresponding times for these targets were 140sec and 280sec respectively. MMJ 120517-0743.1 (NTT-MM25) in (7) |
| 12:05:39.45 | -07:45:26.1 | 0.049 | 0.050 | - | [1.7] | 6.3 | 0.008 | [13]aaUnlike the rest of the sources where the on source integration times were 120sec and 240sec at 16m and 22m, the corresponding times for these targets were 140sec and 280sec respectively. MMJ 120539-0745.4 (NTT-MM16) in (7) |
| 12:05:46.55 | -07:41:33.2 | 0.040 | 0.060 | - | [2.2] | 18.5 | 0.003 | [14]aaUnlike the rest of the sources where the on source integration times were 120sec and 240sec at 16m and 22m, the corresponding times for these targets were 140sec and 280sec respectively. MMJ 120546-0741.5 (NTT-MM31) in (7) |
| 15:41:25.2 | 66:14:39.6 | 0.11 | 0.16 | 0.69 | [1.6] | 10.7 | 0.010 | [15] J 1541+6615 (A2125-MM26) in (7) |
| 15:41:27.3 | 66:16:59.4 | 0.05 | 0.07 | 0.71 | [2.2] | 14.6 | 0.003 | [16] J 1541+6616 (A2125-MM27) in (7) |
| 10:48:44.9 | 46:37:15.5 | 0.23 | 0.37 | 0.62 | 6.23 | [17] J1048+4637 | ||
| 11:48:16.5 | 52:51:49.1 | 0.51 | 0.74 | 0.69 | 6.42 | [18] J1148+5251 |
Note. — In cases of non detections we indicate our 1 upper limits. The identifications and more detail on individual sources are presented in: (1) Frayer et al. (2003), (2) Lilly et al. (1999), (3) Barger et al. (2000), (4) Borys et al. (2002), (5) Hughes et al. (1998), (6) Eales et al. (1999), (7) Eales et al. (2003). Redshifts in brackets are absolute minimum redshifts based on photo-z and an Arp 220 template (see section 3 and Fig.1).