Molecular line opacity of LiCl in the mid-infrared spectra of brown dwarfs
Abstract
We present a complete line list for the electronic ground state of 7Li35Cl computed using fully quantum-mechanical techniques. This list includes transition energies and oscillator strengths in the spectral region for all allowed rovibrational transitions in absorption within the electronic ground state. The calculations were performed using an accurate hybrid potential constructed from a spectral inversion fit of experimental data and from recent multi-reference single- and double-excitation configuration interaction calculations. The line list was incorporated into the stellar atmosphere code PHOENIX to compute spectra for a range of young to old T dwarf models. The possibility of observing a signature of LiCl in absorption near 15.8 m is addressed and the proposal to use this feature to estimate the total lithium elemental abundance for these cool objects is discussed.
1 Introduction
In the study of low-mass stellar objects, the presence or absence of the Li I 6708 Å resonance line has played an important role in ascertaining whether the object is a brown dwarf. However, the use of this so-called lithium test (Rebolo, Martin, & Magazzu, 1992) to determine substellarity has some drawbacks. L dwarfs which lie just below the bottom or at the edge of the hydrogen-burning main-sequence may have some period in their early evolution of lithium burning, depleting their lithium abundance, decreasing the strength of the Li I resonance line, and thereby suggesting they are main-sequence stars. Furthermore, the depletion of lithium is age dependent, which in turn can be used as a clock under the correct conditions (see e.g. Basri, Marcy & Graham, 1996; Chabrier, & Baraffe, 1997; Barrado y Navascués, Stauffer & Patten, 1999, and references therein). The reduction of the strength of the Li I resonance line can also occur in lower temperature objects ( K), near the L/T dwarf interface, due to the sequestering of lithium into molecular species such as LiCl, LiH, and LiOH (Lodders, 1999). In either case, conclusions drawn from the lithium test alone (like age determination, or substellarity in the case of L dwarfs) may be inaccurate.
Thermochemical equilibrium calculations of cool dwarf atmospheres (Lodders, 1999) suggest that LiCl is the dominant Li-bearing gas over an extended domain of the temperature-pressure diagram. LiCl has a large dipole moment in its ground electronic state which may give rise to an intense rovibrational line spectrum in the mid-infrared near 15.8 m. As such, LiCl may give a significant absorption feature in L and T dwarf spectra as suggested by Lodders (1999) and Burrows, Marley & Sharp (2000). If the feature is observable, it could be used to estimate the total lithium elemental abundance in conjunction with optical Li I observations, to confirm the equilibrium lithium chemistry models, and to provide a better test of substellarity for cool objects.
In this work, we continue our long term project to update and complete molecular opacity data (Weck et al., 2003a, b, c, 2004). Here we present a complete line list (transition energies and oscillator strengths) of all allowed rovibrational transitions in the electronic ground state of 7Li35Cl. The calculations were performed using an accurate hybrid potential and the dipole moment function of Weck et al. (2004). The line list was incorporated into the stellar atmosphere code PHOENIX (Hauschildt & Baron, 1999) to compute spectra for a range of T dwarf models to explore the possibility of observing LiCl.
2 Molecular calculations
For the present calculations, an accurate hybrid potential was constructed for the electronic state from the spectral inversion fit of Ogilvie (1992) and from the multi-reference single- and double-excitation configuration interaction (MRSDCI) calculations of Weck et al. (2004). The fit to the effective potential energy proposed by Ogilvie (1992) consisted of a sum of five radial functions accounting empirically for vibrational adiabatic and nonadiabatic effects. The coefficients of this expansion were determined by direct spectral inversion from the frequencies of 2577 known transitions in the infrared and microwave spectral regions for the isotopic variants 6Li35Cl, 6Li37Cl, 7Li35Cl and 7Li37Cl. The normalized standard deviation of the fit was 0.993 over the complete domain of definition of the radial functions, i.e. for internuclear distances from to . A shift in energy of was applied to the Ogilvie fit, in addition to a shift of from its original equilibrium geometry, to obtain coincidence with the ab initio energy minimum at determined by cubic spline interpolation from the MRSDCI data of Weck et al. (2004). Beyond the range , a spline fit to the ab initio data was used, connecting smoothly with the shifted Ogilvie fit. For internuclear distances , a fit to the multi-reference potential has been performed using the usual van der Waals dispersion expansion to account for the long-range interaction. To our knowledge, no data have been reported for the van der Waals coefficients of the state of LiCl, thus theoretical estimates were obtained using average values from several techniques in a similar way as in Weck et al. (2003c).
In order to determine the spectroscopic constants of the potential, the vibrational wave functions, , and energy eigenvalues, , have been calculated by solving with Numerov techniques (Cooley, 1961) the radial nuclear Schrödinger equation,
| (1) |
where is the reduced mass of the system, is the rotational quantum number corresponding to the angular momentum of nuclear rotation, and is the electronic potential energy. The reduced mass adopted for 7Li35Cl was 111In atomic mass units, Aston’s scale (Huber & Herzberg, 1979). Calculations were performed on a grid with stepsize for the integration, over a range of internuclear distances from to .
The calculations yielded for this hybrid potential an energy difference and a dissociation energy , slightly larger than the thermochemical value, , of Brewer & Brackett (1961) or the flame photometry measurement, , of Bulewicz, Phillips & Sugden (1961). The introduction of the spin-orbit interaction in our calculations would lower the dissociation asymptote of the state, thereby bringing the theoretical dissociation energy into closer agreement with the experimental estimates. Our theoretical vibrational constants , and are in excellent agreement with the accurate Dunham constants , and , respectively, derived from experiment by Thompson et al. (1987) for 7Li35Cl. The frequency of the first band, , essentially reproduces the value of , obtained using the Dunham terms given above.
The line oscillator strengths, , from rovibrational states to final state were computed using the dipole moment function of Weck et al. (2004) for all allowed absorption transitions between the 29,370 rovibrational levels solutions of Eq. (1), thus giving a total of 3,357,811 lines222The complete list of 7Li35Cl oscillator strength data is available online at the UGA Molecular Opacity Project database website http://www.physast.uga.edu/ugamop/. A standard expression for the line oscillator strength can be found, for example, in Skory et al. (2003). Computed line oscillator strengths and transition energies are reported in Table 1, along with the high resolution measurements of Jones & Lindenmayer (1987), for the -branch of the fundamental vibrational band , for to 4. The agreement is excellent, with a maximum transition energy discrepancy of for the line of the band.
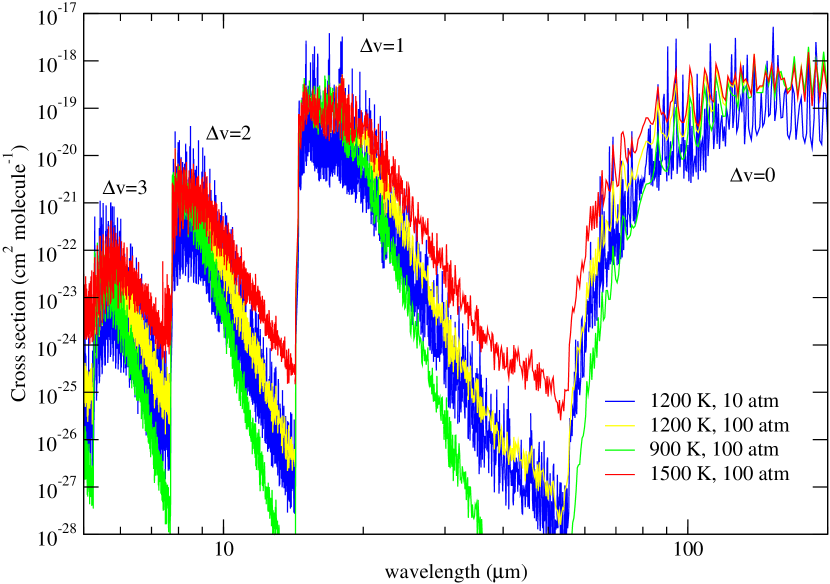
In Figure 1, representative LiCl opacities, absorption cross section per molecule, are presented for pressures and temperature appropriate to T dwarfs. The opacities are computed using Eq. (6) of Dulick et al. (2003), using Einstein A-coefficients from the above line lists, and multiplying by a Lorentzian line profile. The full width half maximum line width is estimated by only considering collisional broadening and is typically 0.1 cm-1 at 100 atm. The rovibrational levels of LiCl are assumed to be in equilibrium and a correction for stimulated emission is included. The fundamental and first two vibrational overtone bands, as well as a portion of the pure rotational band, are depicted. The fundamental band, with a band origin at 15.8 m, is the dominant LiCl opacity source in the mid-infrared. We note, however, that PHOENIX uses molecular line lists instead of pre-computed opacity tables as described below.
3 PHOENIX synthetic spectra
The atmosphere models used for this work were calculated as described in Allard et al. (2001). These models and their comparisons to earlier versions were the subject of a previous publication Allard et al. (2001) and we thus do not repeat the detailed description of the models here. However, we will briefly summarize the major physical properties. The models are based on the Ames H2O and TiO line lists by Partridge & Schwenke (1997) and Schwenke (1998) and also include the line lists for FeH by Phillips & Davis (1993) and for VO and CrH by R. Freedman (NASA-Ames, private communication). We try as much as possible to constantly add new opacities as they become available (see for example, Weck et al., 2003a, b) and the new FeH and CrH opacities recently calculated in Burrows et al. (2002) and Dulick et al. (2003) will soon be added to our database. However, as can be seen from these references, the new line lists calculated for FeH and CrH have no features (for vibrational transitions) in the mid-IR region where the LiCl feature is located. Although the global opacity is expected to be changed overall using these new line lists, for the purpose and wavelength window of this paper the use of the line lists of Phillips & Davis (1993) and R. Freedman is appropriate. The models account for equilibrium formation of dust and condensates and include grain opacities for 40 species. In this paper we only consider the so-called “AMES-cond” models in which the dust particles have sunk below the atmosphere from the layers in which they originally formed. As demonstrated in Allard et al. (2001) this limiting case is appropriate for T dwarfs which are discussed in this paper. We stress that large uncertainties persist in the water opacities for parts of the temperature range of this work (Allard et al., 2000).
In addition to the opacity sources listed above and in Allard et al. (2001, and references therein) the new LiCl line list presented in this paper has been added to our opacity database. In order to assess the effects of the new LiCl line data, we compare spectra calculated with and without this opacity source. The models used in the following discussion were all iterated to convergence for the parameters indicated. The high resolution spectra which have the individual opacity sources selected are calculated on top of the models. The LiCl line opacity data turned out to be too weak to influence the temperature structure of the atmosphere. The models have solar abundances with the non-depleted lithium abundance of log(nLi)=3.31.
We calculated models with log(g)=3.0, 4.0 and 5.0 and effective temperatures of 900 K, 1200 K and 1500 K which are typical parameters of old to young T dwarfs. This parameter region turned out to be the one showing the strongest LiCl features. As can be seen in Figure 2 the effect of LiCl is strongest for =1200 K and log(g)=3.0 in the IR around the fundamental vibrational band origin at 15.8 m and the relative flux difference is typically less than 20% overall. The general strength of the LiCl absorption warrants inclusion in model calculations, but the lack of a distinct feature will make it hard to detect in an observed spectrum which is dominated by water absorption. However, the model parameters =1200 K and log(g)=3.0 are particularly interesting since these are parameters typical for very young (and hence very bright) mid to early T dwarfs.
4 Conclusion
Using an accurate hybrid potential and fully quantum-mechanical techniques, we have constructed a comprehensive and complete theoretical line list of spectroscopic accuracy for the electronic ground state of 7Li35Cl. Although LiCl appears to be a dominant Li-bearing gas over an extended domain of the diagram in cool dwarf atmospheres, synthetic spectra calculations with the stellar atmosphere code PHOENIX suggest that flux differences resulting from the incorporation of this new line list are less than 20% for parameters typical of young to old T dwarfs. The strongest signature of LiCl for =1200 K and log(g)=3.0 appears in the vicinity of the fundamental vibrational band origin at 15.8 m, where the spectrum is dominated by water absorption. The current results suggest that it will be difficult to measure the full inventory of elemental lithium in T dwarfs after it is reposited into molecular species.
References
- Allard et al. (2001) Allard, F., Hauschildt, P. H., Alexander, D. R., Tamanai, A., & Schweitzer, A. 2001, ApJ, 556, 357
- Allard et al. (2000) Allard, F., Hauschildt, P. H., & Schweitzer, A. 2000, ApJ, 539, 366
- Barrado y Navascués, Stauffer & Patten (1999) Barrado y Navascués, D., Stauffer, J. R., & Patten, B. M. 1999, ApJ, 522, L53
- Basri, Marcy & Graham (1996) Basri, G., Marcy, G. W., & Graham, J. R. 1996, ApJ, 458, 600
- Brewer & Brackett (1961) Brewer, L., & Brackett, E. 1961, Chem. Rev., 61, 425
- Bulewicz, Phillips & Sugden (1961) Bulewicz, E. M., Phillips, L. F., & Sugden, T. M. 1961, Trans. Faraday Soc., 57, 921
- Burrows, Marley & Sharp (2000) Burrows, A., Marley, M. S., & Sharp, C. M. 2000, ApJ, 531, 438
- Burrows et al. (2002) Burrows, A., Ram, R. S., Bernath, P., Sharp, C. M., & Milsom, J. A. 2002, ApJ, 577, 986
- Chabrier, & Baraffe (1997) Chabrier, G., & Baraffe, I. 1997, A&A, 327, 1039
- Cooley (1961) Cooley, J. W. 1961, Math. Computation, 15, 363
- Dulick et al. (2003) Dulick, M., Bauschlicher, C. W., Jr., Burrows, A., Sharp, C. M., Ram, R. S., & Bernath, P. 2003, ApJ, 594, 651
- Hauschildt & Baron (1999) Hauschildt, P. H., & Baron, E. 1999, J. Comput. App. Math. 102, 41
- Huber & Herzberg (1979) Huber, K. P., & Herzberg, G. 1979, Molecular Spectra and Molecular Structure, Vol. IV, Constants of Diatomic Molecules (New York: Van Nostrand Reinhold)
- Jones & Lindenmayer (1987) Jones, H., & Lindenmayer, J. 1987, Chem. Phys. Lett., 135, 189
- Lodders (1999) Lodders, K. 1999, ApJ, 519, 793
- Ogilvie (1992) Ogilvie, J. F. 1992, Spectrosc. Lett., 25, 1341
- Partridge & Schwenke (1997) Partridge, H., & Schwenke, D. W. 1997, J. Chem. Phys., 106, 4618
- Phillips & Davis (1993) Phillips, J. G., & Davis S. P. 1993, ApJ, 409, 860
- Rebolo, Martin, & Magazzu (1992) Rebolo, R., Martin, E. L., & Magazzu, A. 1992, ApJ, 389, L83
- Schwenke (1998) Schwenke, D. W. 1998, Chemistry and Physics of Molecules and Grains in Space, Faraday Discussion, 109, 321
- Skory et al. (2003) Skory, S. S., Weck, P. F., Stancil, P. C., & Kirby, K. 2003, ApJ, 148, 599
- Thompson et al. (1987) Thompson, G. A., Maki, A. G., Olson, W. B., & Weber, A. 1987, J. Mol. Spectrosc., 124, 130
- Weck et al. (2003a) Weck, P. F., Schweitzer, A., Stancil, P. C., Hauschildt, P. H., & Kirby, K. 2003a, ApJ, 582, 1059
- Weck et al. (2003b) Weck, P. F., Schweitzer, A., Stancil, P. C., Hauschildt, P. H., & Kirby, K. 2003b, ApJ, 584, 459
- Weck et al. (2003c) Weck, P. F., Stancil, P. C., & Kirby, K. 2003c, J. Chem. Phys., 118, 9997
- Weck et al. (2004) Weck, P. F., Kirby, K., & Stancil, P. C. 2004, J. Chem. Phys., 120, 4216

| Transition Energy | |||||
|---|---|---|---|---|---|
| Band | Line | aaThis work. | TheoryaaThis work. | Expt.bbJones & Lindenmayer (1987). | cc |
| R(7) | 1.26217(-5) | 644.64 | 644.7380 | 0.0980 | |
| R(10) | 1.21968(-5) | 648.35 | 648.4665 | 0.1165 | |
| R(16) | 1.16041(-5) | 655.30 | 655.4703 | 0.1703 | |
| R(19) | 1.13577(-5) | 658.55 | 658.7408 | 0.1908 | |
| R(22) | 1.11270(-5) | 661.64 | 661.8543 | 0.2143 | |
| R(26) | 1.08349(-5) | 665.53 | 665.7600 | 0.2300 | |
| R(34) | 1.02818(-5) | 672.44 | 672.7089 | 0.2689 | |
| R(49) | 9.30016(-6) | 682.23 | 682.5450 | 0.3150 | |
| R(50) | 9.23624(-6) | 682.73 | 683.0491 | 0.3191 | |
| R(58) | 8.72963(-6) | 686.06 | 686.3802 | 0.3208 | |
| R(1) | 3.25145(-5) | 628.00 | 628.0418 | 0.0418 | |
| R(6) | 2.55717(-5) | 634.51 | 634.5921 | 0.0821 | |
| R(12) | 2.38987(-5) | 641.78 | 641.9116 | 0.1316 | |
| R(18) | 2.28181(-5) | 648.45 | 648.6304 | 0.1804 | |
| R(23) | 2.20447(-5) | 653.55 | 653.7615 | 0.2115 | |
| R(25) | 2.17516(-5) | 655.47 | 655.6910 | 0.2210 | |
| R(28) | 2.13235(-5) | 658.21 | 658.4520 | 0.2420 | |
| R(32) | 2.07686(-5) | 661.62 | 661.8852 | 0.2652 | |
| R(36) | 2.02270(-5) | 664.75 | 665.0280 | 0.2780 | |
| R(37) | 2.00932(-5) | 665.49 | 665.7710 | 0.2810 | |
| R(48) | 1.86527(-5) | 672.38 | 672.6855 | 0.3055 | |
| R(5) | 3.89879(-5) | 624.51 | 624.5800 | 0.0700 | |
| R(13) | 3.54663(-5) | 634.09 | 634.2288 | 0.1388 | |
| R(16) | 3.46439(-5) | 637.42 | 637.5746 | 0.1546 | |
| R(20) | 3.36623(-5) | 641.61 | 641.8000 | 0.1900 | |
| R(23) | 3.29764(-5) | 644.58 | 644.7908 | 0.2108 | |
| R(27) | 3.21029(-5) | 648.30 | 648.5320 | 0.2320 | |
| R(40) | 2.94364(-5) | 658.45 | 658.7343 | 0.2843 | |
| R(45) | 2.84505(-5) | 661.54 | 661.8405 | 0.3005 | |
| R(46) | 2.82550(-5) | 662.10 | 662.4058 | 0.3058 | |
| R(51) | 2.72851(-5) | 664.64 | 664.9493 | 0.3093 | |
| R(52) | 2.70924(-5) | 665.09 | 665.3980 | 0.3080 | |
| R(12) | 4.75816(-5) | 624.26 | 624.3715 | 0.1115 | |
| R(15) | 4.64316(-5) | 627.60 | 627.7262 | 0.1262 | |
| R(25) | 4.32566(-5) | 637.63 | 637.8264 | 0.1964 | |
| R(33) | 4.09981(-5) | 644.42 | 644.6672 | 0.2472 | |
| R(38) | 3.96417(-5) | 648.10 | 648.3652 | 0.2652 | |
| R(50) | 3.64842(-5) | 655.09 | 655.3840 | 0.2940 | |
| R(58) | 3.44306(-5) | 658.27 | 658.5725 | 0.3025 | |
| R(17) | 5.70297(-5) | 621.13 | 621.2291 | 0.0991 | |
| R(20) | 6.70073(-5) | 624.18 | 624.3003 | 0.1203 | |
| R(32) | 5.14267(-5) | 634.85 | 635.0536 | 0.2036 | |
| R(47) | 4.63923(-5) | 644.66 | 644.9326 | 0.2726 | |
| R(55) | 4.37976(-5) | 648.23 | 648.5196 | 0.2896 | |