A Lyman emitter at found with slitless spectroscopy††thanks: Based on observations obtained at the European Southern Observatory using the ESO Very Large Telescope on Cerro Paranal (ESO programs 066.A-0122, 068.A-0182, 272.A-5007).
We report the discovery of a Lyman emitting galaxy at . The single line was found in the 43 arcmin2 VLT/FORS field by slitless spectroscopy limited to the atmospheric window at Å (sampling Ly at ). Its counterpart is undetected in a deep band image and the line has an asymmetric appearance in a deeper follow-up spectrum. There are no plausible line identifications except for Ly with a flux of 1.9 erg cm-2 s-1 and rest frame equivalent width Å. The lower limit to the star formation rate density at derived from our complete sample is 510-4 M⊙ yr-1 Mpc-3, consistent with measurements in the Subaru Deep Field and Hubble Ultra Deep Field but approximately ten times higher than in the Large Area Lyman Alpha survey. This Ly emitter is among the very small sample of highest redshift galaxies known.
Key Words.:
Galaxies: high-redshift – Galaxies: formation – Galaxies: starburst1 Introduction
While reaching for the stars, our arms are still growing longer. Until a few years ago, the most distant objects known were QSOs at (Fan et al. 2000) and a handful of Ly emitters (LAEs) at (Stern & Spinrad 1999, for a review). However, advances in the past years with respect to the red sensitivity of CCDs have enabled the detection of galaxies at even higher redshifts (Taniguchi et al. 2003, for a review).
The detection of galaxies allows to study the star formation rate in the early Universe, the modes of early galaxy formation and the interplay between the first galaxies and the intergalactic medium (IGM). With the large sample of Lyman break galaxies (LBGs) now available at and , the star formation rate density (SFRD) at these redshifts is quite well determined (e.g. Steidel et al. 1999). At higher redshifts, there have been tentative determinations of the SFRD recently, but these are still based on poor statistics and some uncertainties in the modeling (Heavens et al. 2004; Bunker et al. 2004; Ricotti et al. 2004). At high redshift, we may encounter stars formed out of primordial elements, which differ strongly from those formed from enriched material, due to differences in initial mass function (IMF) and stellar temperatures. These so–called Population III (PopIII) stars are responsible for the production of the first metals in the Universe (Scannapieco et al. 2003; Schaerer 2003). The redshift range is a very intriguing time during cosmic evolution, when hydrogen reionization is believed to be basically complete and the IGM starts to be polluted with metals. Even though it is now believed that reionization of most of the hydrogen takes place earlier (Kogut et al. 2003), large scale structure may inhibit a homogeneous distribution of ionizing radiation, introducing a large cosmic variance in the reionization (Gnedin 2000; Ciardi et al. 2003).
As the Ly line can be a prominent feature of young star forming galaxies, this line has been used extensively to search for distant galaxies. Blind spectroscopic searches are carried out from Earth (e.g. Ellis et al. 2001; Martin & Sawicki 2004) and from space (Rhoads et al. 2004a; Pirzkal et al. 2004), but most surveys are performed by narrow band imaging with ground based telescopes. Using narrow band filters sensitive to wavelengths in the atmospheric window at m, corresponding to Ly emission at , and subsequent spectroscopy, three groups have detected galaxies at . The first of these was found due to the lensing amplification (4.5) by the cluster Abell 370 (Hu et al. 2002), two were found by surveying the huge field of view (814 arcmin2) of the Subaru Suprime-Cam instrument (Kodaira et al. 2003) and one during the course of the Large Area Lyman Alpha survey (LALA, Rhoads et al. 2004b). Detections of even higher redshift, very strongly lensed, galaxies are reported by Kneib et al. (2004, ) and Pelló et al. (2004, ).
We have followed a different method to find Ly emitting galaxies at and positively identify one galaxy at . Throughout this Letter, we adopt a flat Universe with , and km s-1 Mpc-1.
2 Observations
Our approach to find LAEs at is to use ground based slitless spectroscopy in combination with a medium band filter and imaging carried out with FORS2 at the VLT of a 7′7′ field with very low Galactic extinction (=0.002) centered at RA = 04:01:55.9, Dec = -37:43:34 (J2000). The filter (ESO’s z_SPECIAL+43, from now on) has a central wavelength of 9135 Å and FWHM of 193 Å and is therefore sensitive to Ly originating from to . The filter reduces the sky background and overlap problems by providing short spectra. This technique provides a completeness limit on line flux and the redshift of lines with enough resolving power to separate possible contaminants from real LAEs.
We used the holographic 600 grism which delivers a resolution of about 1400 for 1″ objects. Over a period of four months in the winter of 2002/03, an exposure of 7.6 hours was collected. Weather conditions were excellent resulting in 07 seeing. Direct imaging was carried out through the filter, to determine the sources of emission lines detected in the spectroscopy, and Bessel- filter, to determine the colour. A Gunn- image was available from earlier observations of this field. Total exposure times were 6.33, 4.0 and 1.0 hours with seeing discs of 07, 07 and 06 for the , and bands, respectively.
Reduction was carried out in a standard way. Flux calibration of the spectroscopic image was provided by observations of two spectrophotometric standards. For the filter, the literature values were convolved with the sensitivity of the filter to obtain the magnitude. Three sigma limiting AB magnitudes for a 1″ aperture are 27.0 and 27.5, respectively for the and band. Special calibration were carried out to determine the distortion pattern of the FORS2 instrument using the movable slitlets of FORS2 in direct and spectroscopic modes using seven slit configurations to cover the entire field. These calibration images allowed us to determine the region on the direct image where the source of a spectrum or line on the spectroscopic image can be located to within 1 pixel or 025.
In november 2003, we have also carried out 2.1 hours of multi object spectroscopy in Director’s Discretionary Time (DDT) with FORS2 using the 1028 grism, which delivers a resolution of about 2600 for the 1″ slits used in the mask. The eight frames were offset by 3″ in an ABBA sequence. The observations were reduced in a standard way, by subtraction of the overscan region and flat fielding with screen flats. Cosmic rays were rejected by combining the two pairs of frames with the same offset. Wavelength calibration and rectification of the two–dimensional spectra were carried out by measuring the position of about 10 sky lines. The error in the wavelength calibration is dominated by fringing which influences the determination of the center of the sky lines and limits the wavelength accuracy to 0.2 Å.
3 Results
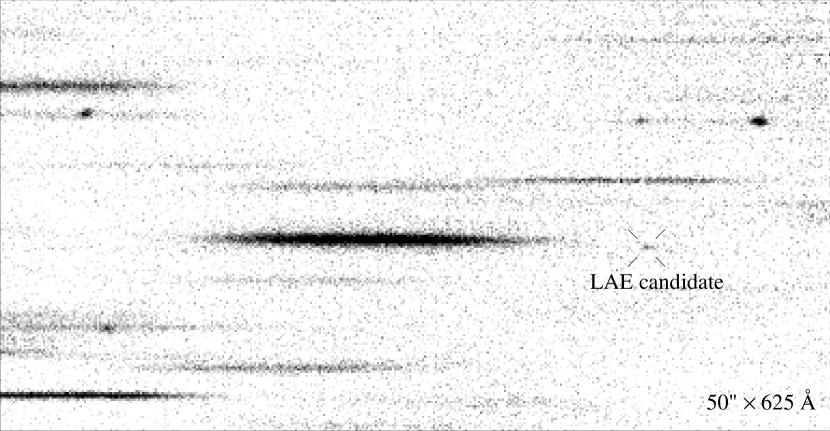
In the slitless spectroscopic image, three authors (JK, AC and SSA) have independently searched for emission lines by visual inspection. Automatic extraction has been attempted but fails to detect emission lines superposed on continua and results in many fake detections. The visual inspection has a completeness level which corresponds to line fluxes of 1.0 to 2.010-17 erg cm-2 s-1 depending on the (unknown) wavelength of the line (values stated are for a line at the maximum of the filter transmission and half of it). Fig. 1 shows a small part of the slitless image, including a LAE candidate which has a signal close to the completeness limit. In the resulting combined list, there are 161 lines, each of which can originate from a counterpart within a region of about 50″1″ on the direct image. Taking all objects detected by SExtractor in the image into account, the emission lines are related to 321 possible counterparts in the zsp image. The average number of possible counterparts per emission line is therefore two, which is consistent with one of these being the real counterpart as randomly placed regions with the above specified size cover on average one object in our image. For each possible counterpart we have determined the associated line flux from the spectroscopic image (which depends on the position of the counterpart).
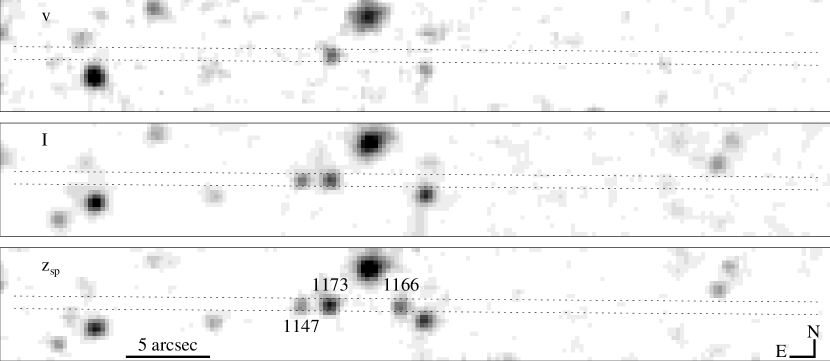
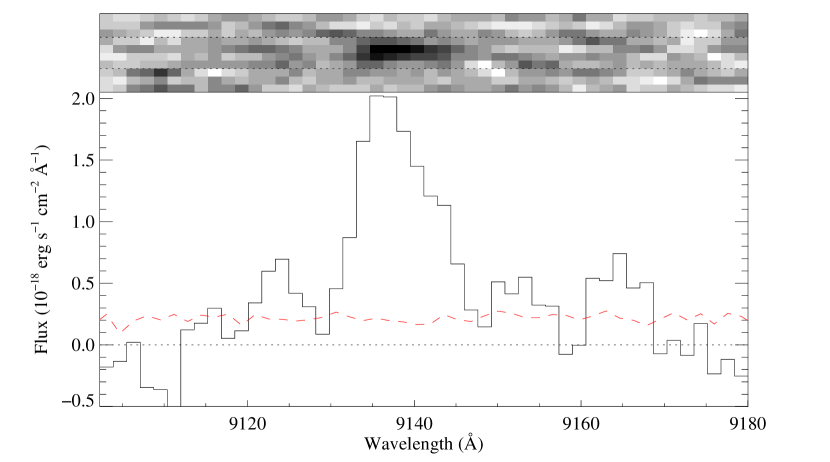
Among the detected emission lines, 37 lines were part of an identifiable line pair, either close (e.g. [S II]6716,6731) or far apart (e.g. H at 4861 Å and [O III]4959). The corresponding 87 counterparts have been removed from the sample of possible LAEs. As the [O II]3726,3729 doublet is only marginally resolved in our slitless spectra, we have not eliminated candidate [O II] emitters. From the remaining 234 objects, we have selected candidate Ly emitters based on the singular and isolated appearance of the line, and the absence of emission in the band or strong break of the possible counterpart. There is only one counterpart not detected in the band. This object, KCS 1166, has a line flux very close to the completeness limit (of 2.0 erg cm-2 s-1) and an colour or after subtraction of its line flux. The corresponding emission line has two other possible counterparts, which are almost equally probable to cause the line (as they are close in position and brightness) but do not show a spectral break between the and band (see Fig. 2 and Table 1). The images of the three possible counterparts are rather faint for a reliable determination of their sizes, but they are all consistent with being unresolved. The appearance of the emission line of this LAE candidate is asymmetric but it is difficult to quantify this as the s/n is low (see Fig. 3).
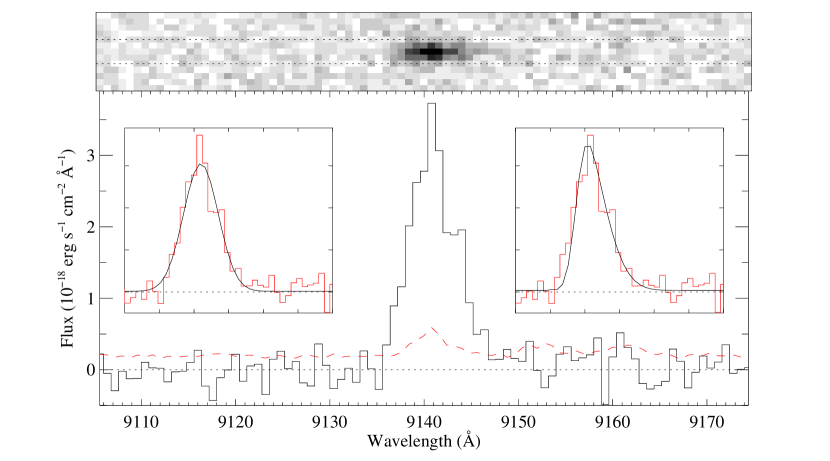
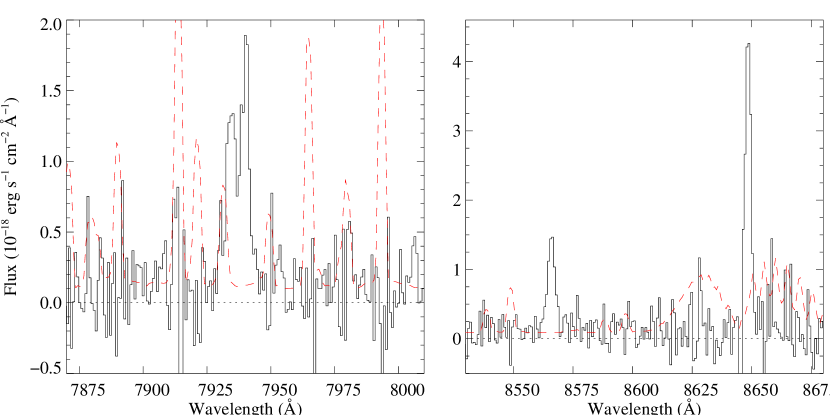
To determine the actual counterpart of this emission line and to cover a larger wavelength range with higher resolution and s/n, we have carried out multi object slit spectroscopy. Fig. 4 shows the two dimensional spectrum obtained with the slit mask, while Figs. 5 and 6 show the one dimensional spectra of the three possible counterparts. These spectra show that the line detected in the slitless image is from KCS 1166. The other two objects are also line emitters: KCS 1173 is identified as an [O II] emitter at and KCS 1147 as an [O III] emitter at . A Gaussian fit to the emission line of KCS 1166 results in a central wavelength of 9141.0 Å or if identified with Ly. KCS 1166 was also fit with a Gaussian profile truncated completely on the blue side (to simulate absorption) whereafter it was (as all fitted profiles) convolved with a Gaussian instrumental profile. This fit (also shown in Fig. 5) results in a FWHM of 280 km s-1 and redshift of 6.516 (for the unabsorbed line). Parameters derived from the Gaussian profile fits are presented in Table 2.
Subtracting the line flux of KCS 1166 from the flux measured in the image, we obtain a line–free continuum of 1.61.1 erg cm-2 s-1 Å-1 or AB magnitude of 27.3. In case the observed line can be identified with Ly, no continuum flux is expected blueward of the line and the derived continuum redward of the line would be 3.22.1 erg cm-2 s-1 Å-1. The latter continuum flux implies an observed EW of 600400 Å for the line. As the continuum detection is only 1 and we have conservatively used the high continuum flux, this value can be considered a lower limit. We have also measured the continuum level in the spectrum of KCS 1166 below (9005 9030 Å) and above (9165 9244 Å) the Ly line, resulting in values of -1.71.9 and 2.12.5 erg cm-2 s-1 Å-1, respectively. The difference of 3.83.1 erg cm-2 s-1 Å-1 is consistent with the continuum level redward of the line determined from the imaging.

| Source | Coordinates (J2000) | ||||
|---|---|---|---|---|---|
| KCS 1166 | 04 01 43.48 | -37 45 09.1 | 27.4 | 28.3 | 3.2 |
| KCS 1173 | 04 01 43.84 | -37 45 08.9 | 25.2 | 25.0 | 0.3 |
| KCS 1147 | 04 01 43.98 | -37 45 09.1 | a27.4 | 25.5 | 0.0 |
Magnitude limits are 1, errors are 0.1, except for a where it is 1.0
| Line | Source | Fluxa | FWHMb | EW0c | ||
|---|---|---|---|---|---|---|
| Ly 1216 | KCS 1166 | 6.518 | 1.9 | 0.1 | 160 | 80 |
| O II3726 | KCS 1173 | 1.129 | 0.5 | 0.1 | 110 | 10 |
| O II3729 | KCS 1173 | 1.129 | 0.6 | 0.1 | 110 | 15 |
| H4861 | KCS 1147 | 0.727 | 0.4 | 0.2 | 80 | 20 |
| O III4959 | KCS 1147 | 0.727 | 0.5 | 0.1 | 100 | 25 |
| O III5007 | KCS 1147 | 0.727 | 1.4 | 0.1 | 100 | 65 |
a10-17 erg cm-2 s-1 bkm s-1 (deconvolved) cÅ
4 Line asymmetry
Due to the absorption of Ly photons by intervening neutral hydrogen, Ly lines are expected to have an asymmetric appearance in constrast with non–resonant lines. A reliable identification of an emission line with Ly depends therefore critically on the assessment of the line profile. We have used various methods to quantify the asymmetry of the line of KCS 1166.
First, we have applied the three tests presented in Rhoads et al. (2003). A model–free test is provided by symmetrizing the spectrum about an assumed line center and measuring how well the symmetrized line fits to the observed line. The value obtained by this method depends on the amount of continuum included, which is relatively symmetric around the line and therefore reduces the value of . It also depends on the error estimation. We have used the rms estimated from a source-free region in the slitless image above and below the actual spectrum. We have measured the value for a range of assumed line centers in steps of 0.1 Å. The lowest reduced value measured was 1.35 for a conservative 20 Å wavelength range including some continuum emission and 1.46 for a range of 10 Å which includes the line only. These values imply likelihoods of 1.4% and 2.4%, respectively, that the line is consistent with its symmetrized profile. Two further tests attempt to measure the actual asymmetry. For both, the wavelengths where the flux peaks and where it has 10% of its peak value on the blue and red side are determined. The wavelengths are respectively: = 9140.8 Å, = 9136.0 Å and = 9147.2 Å. The wavelength ratio is then defined as and the flux ratio as . The resulting values are and , where we have assumed an error equal to the binsize (0.8 Å) for the wavelength and the measured sigma for the flux. These values are consistent with those measured for other high redshift Ly lines, according to Rhoads et al. (2003).
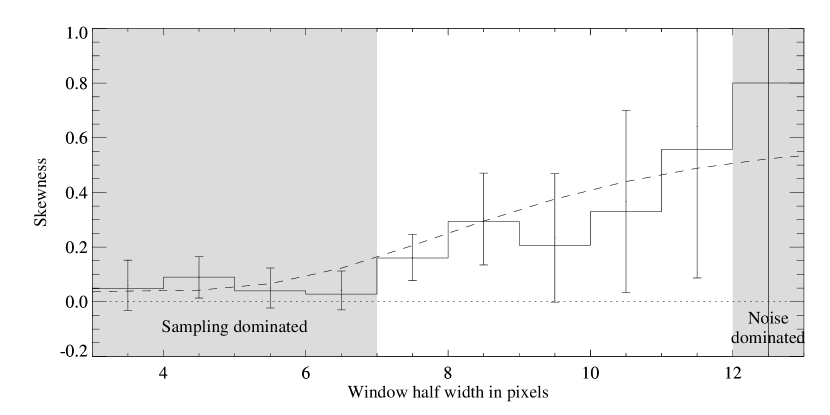
In addition to these three tests, we have also measured the skewness of the line for a range of wavelength windows. The skewness or third moment represents the degree of asymmetry of a distribution and is positive for a line if the values above the central wavelength are more spread out than those below it. The result is presented in Fig. 7, where the uncertainties for each window are also shown. These uncertainties are a combination of noise and sampling. For small window widths (7 pixels), the uncertainties in wavelength sampling dominate, while for large widths (12 pixels), the uncertainties in flux dominate. In between (7 – 12 pixels), a positive skewness is measured, consistent with a Gaussian emission line completely absorbed on the blue side and convolved with the instrumental profile.
The results of all tests are consistent with the line being asymmetric, strongly suggesting that the line has excess emission on its red side as expected for a high redshift Ly line.
5 Discussion
The absence of flux below the emission line at 9141 Å, especially in the deep band image (see Table 1) and the observed asymmetry support the identification of this line with Ly at . The flux ratio between the line–free and bands of 2 (or 4 for continuum redward of the line only) is consistent with strong attenuation by the Lyman forest at high redshift, but difficult to reconcile with a 4000 Å or Balmer break. The identification with other lines than Ly is very unlikely. As the slit spectrum covers wavelengths up to 9262 Å, we can exclude the identification with [O III] based on the absence of other lines in the spectrum. For the same reason, the identification with H is improbable as the accompanying [N II] lines would have to be ten times fainter and the H EW0 would be in excess of 400 Å. We would have resolved line doublets as [O II], Mg ii and C iv (as shown by the spectrum of KCS 1173, Fig. 6) and, if identified with [O II], the line would have an EW 240 Å, which is a factor of two higher than the largest EW0 observed in low redshift samples of emission line galaxies (e.g. Gallego et al. 1996). In addition, the measured colour, after line subtraction, is more consistent with a Lyman break than a Balmer jump.
We can derive the SFR for the Ly emitter based on the conversions for H and UV continuum given in Kennicutt (1998) and assuming a Ly/H ratio of 8.7 (Brocklehurst 1971). The Ly luminosity of the line is 1.1 erg s-1, which results in a SFRLyα of 10.00.5 M⊙ yr-1, while the continuum luminosity density of 6.6 erg s-1 Hz-1 results in a SFR6 M⊙ yr-1. Note that the SFRUV conversion used is calibrated only for the range between 1500 and 2800 Å, while our UV continuum is measured near 1200 Å, which can add additional uncertainties.
The useful surface area of the survey is 618693 or 42.8 square arcminutes. We do not take into account the surface area covered by spectra of bright objects which may inhibit detection of underlying emission lines as this is only a very small fraction (about 1%). The surface density of the complete sample of LAEs (with fluxes erg cm-2 s-1) in our field is 0.023 arcmin-2. Given the comoving volume of 18460 Mpc3 for our survey, we derive a lower limit to the SFRD at of 5 M⊙ yr-1 Mpc-3 (derived from the Ly flux). Using a much larger field of view and including LAEs with fluxes erg cm-2 s-1, Kodaira et al. (2003) arrive at a comparable SFRD of 4.8 M⊙ yr-1 Mpc-3. This SFRD is about ten times higher than that estimated for the complete sample of LAEs at with fluxes erg cm-2 s-1 in the LALA survey (Rhoads et al. 2004b). It is interesting to note that the SFRD derived from our observations is comparable with that derived from the abundance of -band drop-outs in the Hubble Ultra Deep Field (Bunker et al. 2004), which low value poses a challenge for models suggesting that the bulk of star forming galaxies that reionized the universe lie at redshifts just beyond . Larger samples of LAEs at are needed to measure the clustering of these galaxies and the resulting cosmic variance to obtain a better view of the SFRD at .
One of the major challenges in observational cosmology is the detection of the first stars. These enigmatic objects may be responsible for the ionization of neutral hydrogen in the universe and should be formed from primordial matter. Although recent WMAP results seem to place reionization at (Kogut et al. 2003), the existence of metal-free stars at lower redshift depends strongly on the distribution of supernova products. The detection of large optical depth neutral hydrogen in front of QSOs (e.g. Pentericci et al. 2002) illustrates that the ionization process might have occured very inhomogenously throughout the universe. Scannapieco et al. (2003) predict that metal-free stars can be formed down to and might be found in presently known LAEs (see also Fosbury et al. 2003). The Ly EW of PopIII objects is predicted to be very high (400 – 800 Å, Schaerer 2003), although the observed EW can be diminished by H I absorption and depends therefore on the geometry of the ionized and neutral gas. The lower limit to the EW0 of KCS 1166 (80 Å) is not particularly high but we stress that the unabsorbed EW0 can be significantly higher. Table 3 shows the EW0s for all known LAEs, as computed assuming that the observed continuum flux (or its 1 upper limit) is only present redward of the emission line. The galaxy described by Rhoads et al. (2004b) and the galaxy described in this work have the highest EW0s and are therefore the most likely LAEs at to contain metal-free stars. Given the present observing capabilities and the uncertain Ly/He ii flux ratio for PopIII objects (Schaerer 2003), it would be just feasible to detect a strong He ii line, a unique feature of metal-free stellar populations. Further investigation is needed to determine the nature of the stellar population of this and other galaxies.
| Name | Fluxa | EW | Refd | |
|---|---|---|---|---|
| HCM 6A | 6.556 | 0.65 | 25 | (1) |
| SDF J132415.7+273058 | 6.541 | 2.06 | 21 | (2) |
| SDF J132418.3+271455 | 6.578 | 1.13 | 44 | (2) |
| LALA J142442.24+353400.2 | 6.535 | 2.26 | 85c | (3) |
| KCS 1166 | 6.518 | 1.90 | 80c | (4) |
References
- Brocklehurst (1971) Brocklehurst, M. 1971, MNRAS, 153, 471
- Bunker et al. (2004) Bunker, A. J., Stanway, E. R., Ellis, R. S., & McMahon, R. G. 2004, astro-ph/0403223
- Ciardi et al. (2003) Ciardi, B., Stoehr, F., & White, S. D. M. 2003, MNRAS, 343, 1101
- Ellis et al. (2001) Ellis, R., Santos, M. R., Kneib, J., & Kuijken, K. 2001, ApJ, 560, L119
- Fan et al. (2000) Fan, X., White, R. L., Davis, M., et al. 2000, AJ, 120, 1167
- Fosbury et al. (2003) Fosbury, R. A. E., Villar-Martín, M., Humphrey, A., et al. 2003, ApJ, 596, 797
- Gallego et al. (1996) Gallego, J., Zamorano, J., Rego, M., Alonso, O., & Vitores, A. G. 1996, A&AS, 120, 323
- Gnedin (2000) Gnedin, N. Y. 2000, ApJ, 542, 535
- Heavens et al. (2004) Heavens, A., Panter, B., Jimenez, R., & Dunlop, J. 2004, Nature, 428, 625
- Hu et al. (2002) Hu, E. M., Cowie, L. L., McMahon, R. G., et al. 2002, ApJ, 568, L75
- Kennicutt (1998) Kennicutt, R. C. 1998, ARA&A, 36, 189
- Kneib et al. (2004) Kneib, J.-P., Ellis, R. S., Santos, M. R., & Richard, J. 2004, astro-ph/0402319
- Kodaira et al. (2003) Kodaira, K., Taniguchi, Y., Kashikawa, N., et al. 2003, PASJ, 55, L17
- Kogut et al. (2003) Kogut, A., Spergel, D. N., Barnes, C., et al. 2003, ApJS, 148, 161
- Martin & Sawicki (2004) Martin, C. L. & Sawicki, M. 2004, ApJ, 603, 414
- Pelló et al. (2004) Pelló, R., Schaerer, D., Richard, J., Le Borgne, J.-F., & Kneib, J.-P. 2004, A&A, 416, L35
- Pentericci et al. (2002) Pentericci, L., Fan, X., Rix, H., et al. 2002, AJ, 123, 2151
- Pirzkal et al. (2004) Pirzkal, N., X., C., Malhotra, S., et al. 2004, astro-ph/0403458
- Rhoads et al. (2004a) Rhoads, J., Cimatti, A., Cristiani, S., et al. 2004a, in preparation
- Rhoads et al. (2003) Rhoads, J. E., Dey, A., Malhotra, S., et al. 2003, AJ, 125, 1006
- Rhoads et al. (2004b) Rhoads, J. E., Xu, C., Dawson, S., et al. 2004b, astro-ph/0403161
- Ricotti et al. (2004) Ricotti, M., Haehnelt, M. G., Pettini, M., & Rees, M. J. 2004, astro-ph/0403327
- Scannapieco et al. (2003) Scannapieco, E., Schneider, R., & Ferrara, A. 2003, ApJ, 589, 35
- Schaerer (2003) Schaerer, D. 2003, A&A, 397, 527
- Steidel et al. (1999) Steidel, C. C., Adelberger, K. L., Giavalisco, M., Dickinson, M., & Pettini, M. 1999, ApJ, 519, 1
- Stern & Spinrad (1999) Stern, D. & Spinrad, H. 1999, PASP, 111, 1475
- Taniguchi et al. (2003) Taniguchi, Y., Shioya, Y., Ajiki, M., et al. 2003, Journal of Korean Astronomical Society, 36, 123