Sub-Galactic Clumps at High Redshift: A Fragmentation Origin?
Abstract
We investigate the origin of the clumpy structures observed at high redshift, like the chain galaxies. We use a three dimensional chemodynamical simulation describing the dynamics of stars and a two-phase interstellar medium, as well as feedback processes from the stars. For high efficiency of energy dissipation in the cold cloud medium, the initially gaseous disk fragments and develops several massive clumps of gas and stars. We follow the evolution of the individual clumps and determine their masses, metallicities and velocities. A few dynamical times after fragmentation of the disk, the clumps merge to build a massive bulge. Calculating HST- and UBVRIJHKLM-colors, including absorption by interstellar dust, we determine the morphologies and colors of this model in HST images. Several peculiar morphological structures seen in the HDF can be well-explained by a fragmented galactic disk model, including chain galaxies and objects consisting of several nearby knots.
1 Introduction
In the redshift range , galaxies evidence a large diversity of morphological types (e.g. Abraham et al., 2001; Steidel et al., 1996; van den Bergh et al., 1996, vdB96). Although some of the unusual morphological structures can be explained by the morphological K-correction, NICMOS observations (Dickinson, 2000) show that many galaxies indeed have a rest frame optical morphology that cannot be attached to the traditional Hubble scheme.
Examples are the so-called chain galaxies that show elongated knotty structures (Cowie et al., 1995, CHS95). Different scenarios have been proposed to explain these structures. CHS95 suggested that chains lie in the redshift range and have a mass comparable to that of a present-day galaxy. They speculate that these objects may be linear arrangements in space where star formation, once turned on, triggers further star formation along the line of maximum density. In some models the chains form in colliding supershells blown out of massive starburst galaxies (Taniguchi & Shioya, 2001). Dalcanton & Shectman (1996) argued that LSB galaxies are local counterparts to chains at high or intermediate redshift. O’Neil et al. (2000) suggested, from a comparison with less inclined objects, that the chains do not belong to a new galaxy class but are knotty disk like structures seen edge on. This is consistent with recent observations from (Elmegreen et al., 2004a, b), who find that the clump colors in face-on clumpy objects are similar to the colors of clumps in chain galaxies.
Here we investigate a model of a gaseous disk that becomes unstable and develops several clumps of gas and stars. The model presented here describes one of the evolutionary paths that a disk can take, in the sequence investigated in Immeli et al. (2004), with a higher-resolution simulation. The evolution of this disk is similar as in the scenario proposed by Noguchi (1998), but our model for the star-forming two-phase interstellar medium, including feedback processes, allows us to keep track of stellar ages and metallicities, and thus to determine realistic luminosities and colors for a direct comparison with observations in the Hubble Deep Field (HDF). We show here that several of the unusual morphological types in the HDF are well-described by a fragmented disk model seen from different viewing angles.
2 The Model
We use a two-phase model for the interstellar medium, consisting of a hot, low-density phase and a cold cloud medium from which stars are formed. We describe this system with a three-dimensional chemodynamical evolution code, which combines a hydrodynamical grid code for the two phases of the interstellar medium (ISM) with a particle mesh code for the stars. The interactions between the different ISM phases are described in Samland & Gerhard (2003, SG03). For the star formation rate (SFR) we use a Schmidt Law (Schmidt, 1959), with and consistent with the star formation (SF) rule derived by Kennicutt (1998).
The energy released from supernovae mostly goes into heating the hot phase, but also heats the cold phase. Most of the kinetic energy of the cloud fluid is in the motions of single clouds relative to the bulk flow. This kinetic energy can be dissipated by inelastic collisions (Larson, 1969) and augmented by supernova feedback (McKee & Ostriker, 1977). Its energy dissipation rate, here described by the parameter , is not well-determined, and may well vary between galaxies. One expects that it depends on the geometrical structure of the clouds, on whether a major part of the dense medium is arranged in filaments, and on their self-gravitating structure and magnetic fields (Kim et al., 2001; Balsara et al., 2001). The influence of on the dynamical evolution of gas-rich disks is investigated in more detail in Immeli et al. (2004); together with the infall rate it determines the amount of star-forming cold gas in the disk. Here we compare one of their fragmenting disk models () with observations of high-redshift galaxies.
The setup of our model describes an early and rapid formation of a massive galactic disk in a static dark halo. According to Sommer-Larsen et al. (2002) the delayed infall of the baryonic matter into the relaxed halo can solve the angular momentum problem arising in CDM structure formation simulations. The primordial gas enters the simulation volume at 7 kpc vertically and uniformly distributed over a radius of 17 kpc, with a rotation velocity equal to the circular velocity at the infall point, and infall velocity . The infall rate is during one Gyr, resulting in a total baryonic mass of . The simulation volume has a diameter of 37.2 kpc and a vertical height of 14 kpc with a spatial resolution of 300 pc in the horizontal and 120 pc in the vertical direction. We have also done the simulation at lower resolution, with similar results, indicating that the outcome is not sensitive to the resolution used (Immeli et al., 2004).

The chemodynamical model provides ages and metallicities of the stars formed, as well as ISM densities and metallicities. This enables us to calculate colors of the model at different redshifts, including absorption, using the method of Westera et al. (2002) except that we adopt here a three times lower absorption coefficient.
3 Results and Comparison to Observations
3.1 Global Evolution
The infall of the baryons into the halo leads to the build-up of a star-forming gaseous disk. Fig. 1 shows the resulting evolution of the star formation rate (SFR) in the model. The energy input from the supernovae type II dominates that from the infall during most of the evolution and prevents the rapid formation of a massive disk on a free fall timescale.
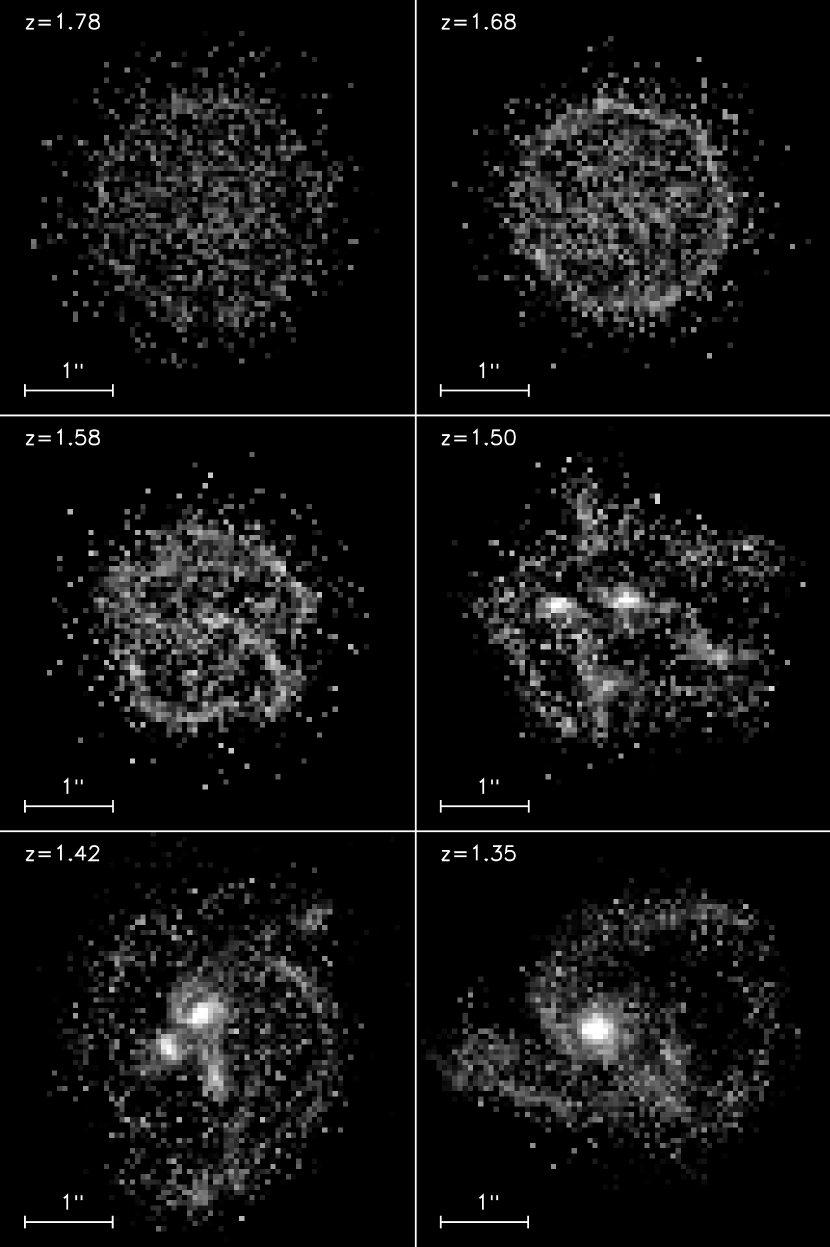
However, at around 700 Myr the gas disk becomes unstable on large scales and begins to fragment. The lower-mass stellar system follows the gravitational potential perturbations induced by the gas. Fig. 2 shows a face-on view of the model evolution from 500-1500 Myr in terms of observed HST F606W surface brightness. The model was shifted to the redshift range indicated in the frames.
To quantify the fragmentation we have used the asymmetry parameter (Abraham et al., 1996) in rest frame U-band. The evolution of is very similar to that of the SFR, which illustrates that the SF is driven by fragmentation. The high symmetry in the first two images reflects the symmetric infall of the gas. The pressure from the SF in the disk and the pressure from the infalling material causes the development of the ring-like structure at the border of the stellar disk, visible in the second image. This ring structure represents less than of the total mass of the cloudy medium in the disk at this time. Yet the enhanced SF in this structure, due to feedback-induced large density fluctuations, causes a very prominent UV emission shifted to F606W at the redshift considered.
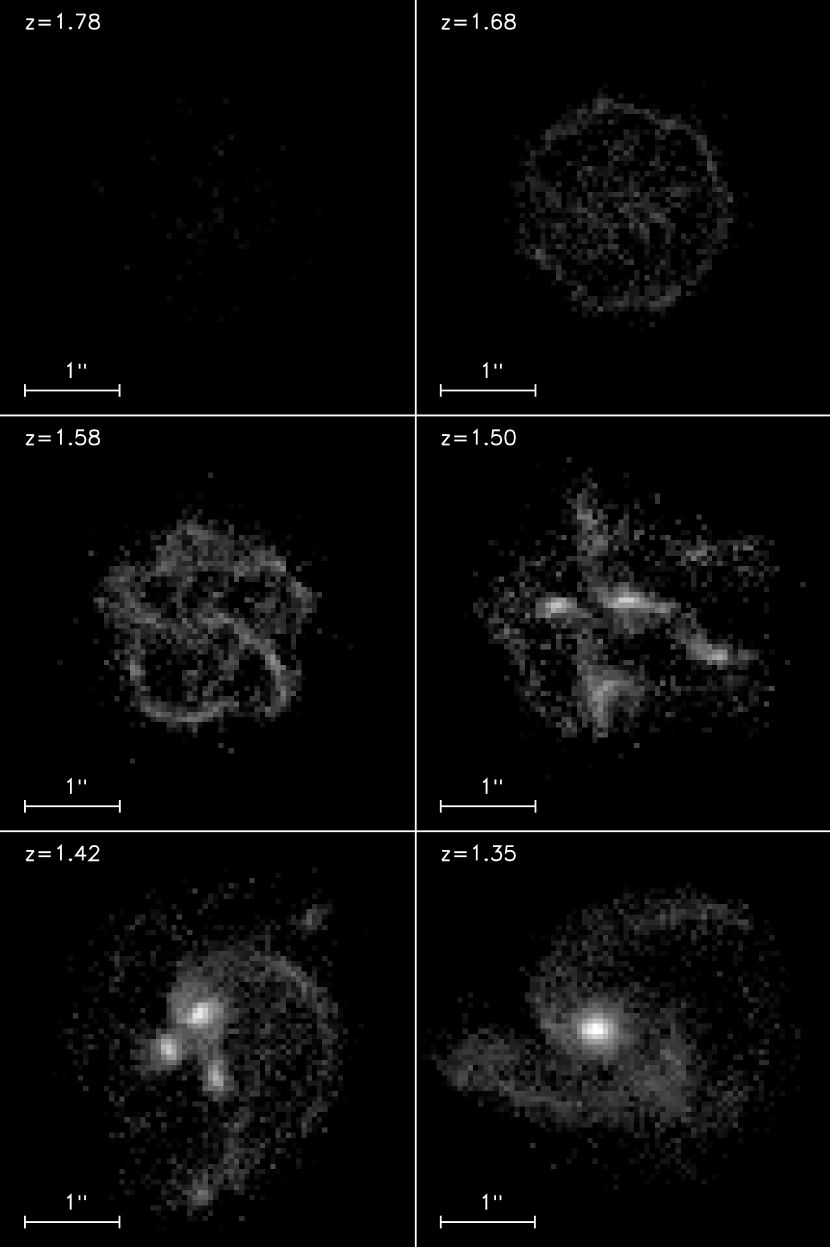
It is important to note that the disk shows its clumpy structure also in the H-band (Fig. 3), which would be traced by NICMOS observations. This emphasizes the fact that the clumps are not only regions of high star formation in an underlying smooth disk, but that the disk itself is fragmented, forming stars vigorously in several dense clumps. This makes it hard to distinguish such clumpy disks from a merger event on the basis of observed surface brightness maps alone.
The maximum SFR is reached in this simulation during the main fragmentation phase, after about 1 Gyr. The morphology of the disk at this time is bracketed by panels 3 and 4 of Fig. 2. The SFR at this time is around 220 , corresponding to a strong starburst galaxy. Indeed, many high-redshift objects may be starburst galaxies. Lowenthal et al. (1997) report similarities in stellar emission and interstellar absorption lines between galaxies and local starburst galaxies. The color selection criteria for Lyman Break Galaxies (LBG) also strongly favor starburst galaxies (Steidel et al., 1996). Age determinations of stellar populations and enhanced abundances of -elements in LBGs (Carollo & Lilly, 2001) indicate that the very high SFRs in these high-redshift objects persist only for a few hundred Myrs.
The clumps that form in the disk during the fragmentation phase spiral to the center, building a massive bulge (last two panels of Fig. 2). The clumps lose their angular momentum by dynamical friction against the massive arms they generate in the disk. Because a substantial fraction of the mass in the region of interest by then consists of baryonic material, the timescale for this spiral-in phase is relatively short, of the order of two disk rotation times. This is typical for all models with a fragmenting gas disk discussed in Immeli et al. (2004).
The strongly asymmetric potential leads to a redistribution of angular momentum, which is partially carried away by stars which leave the simulation volume. The high mass of the bulge is explained by the efficiency of the angular momentum transfer during the fragmentation phase.
Without newly infalling material there will be no major changes in the global structures of the galaxy after 2.5 Gyr. Formation of a bar is prevented due to the high-mass bulge. Numerical investigations of Noguchi (1999) showed a qualitatively similar evolution of a gaseous disk. Two main differences in his work are that the dissipative evolution is described by only a single sticky particle phase, and that in his model the high SF threshold allows SF only after fragmentation of the disk.
The stability properties of multi-phase star-gas disks such as the model analyzed here, and the implications for bar and bulge formation, are discussed in more detail in Immeli et al. (2004).
3.2 Comparison with Observations
In Fig. 4 the model morphology at different times during the fragmentation phase is compared to the morphologies of some objects in the HDF. Clearly, several HDF morphologies can be well explained by the fragmented disk model.
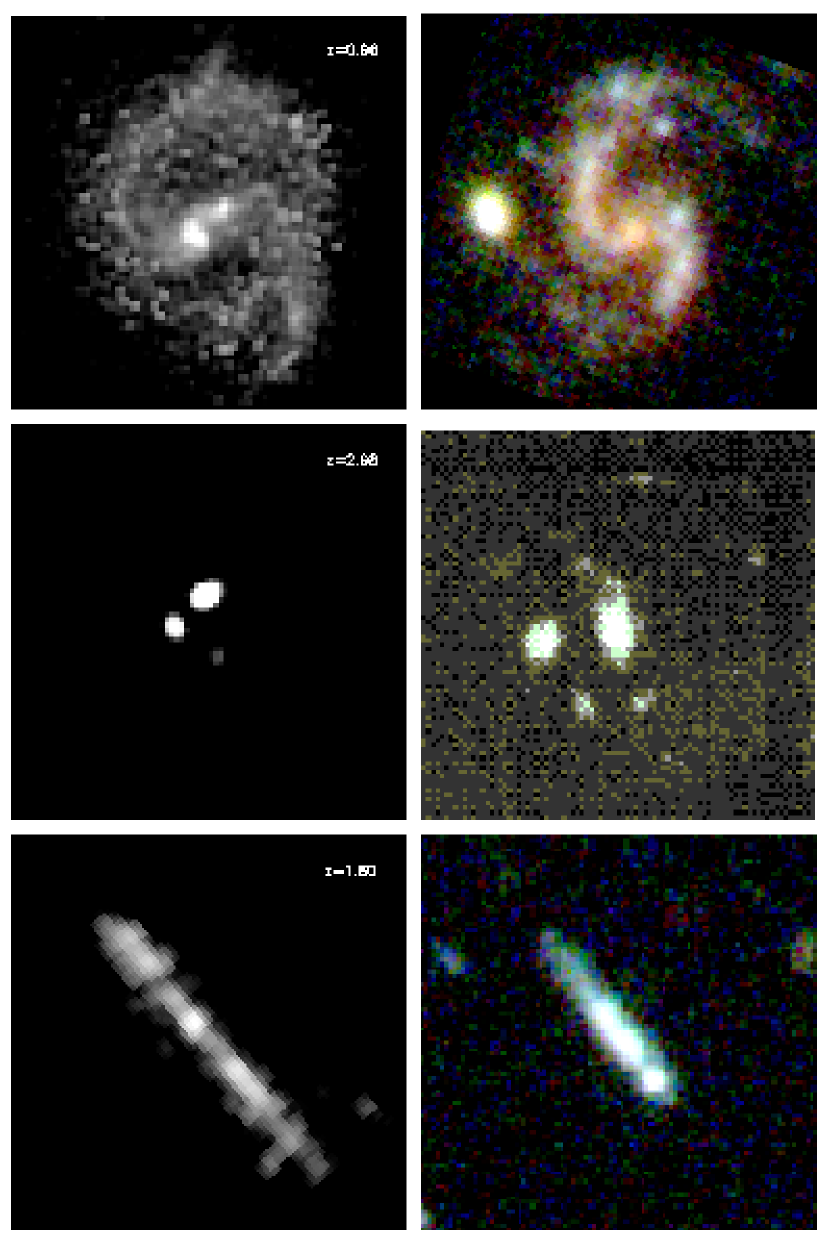
In the first row of Fig. 4 we show a phase of enhanced spiral arms at about 1.35 Gyr in the model, induced by the merging of the last two massive clumps, and a similar object observed in the HDF. In the second row we compare the model at 1.3 Gyr to a clumpy structure at high redshift. Seen edge-on (third row), the model resembles a chain galaxy during its fragmentation phase.
CHS95 reported observations of chain galaxies (chains), a new population of high redshift galaxies observed with HST in the Hawaii Survey Fields, with high major-to-minor axis ratios and very blue colors. vdB96 also found chain galaxies in the HDF.
As already mentioned in the introduction, there are different explanation scenarios for the chain galaxies. Recent observations point to the fact that chain galaxies are indeed edge-on disks (Elmegreen et al., 2004a). Comparison of the clump colors with the colors of clumpy face on disks (sometimes called clump clusters) leads to similar results, indicating that these clump clusters are indeed face-on counterparts of chain galaxies. Additionally these authors found that the distribution of axial ratios for chain galaxies and clumpy disks is similar to the distribution of local disk galaxies.
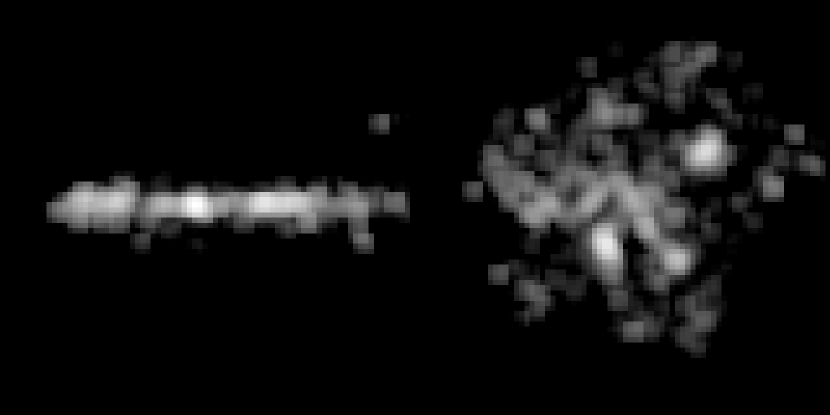
Given the small number of chains compared to approximately 1000 known high redshift galaxies (Giavalisco, 2002), it is likely that these objects are in a short evolutionary phase. Our clumpy disk model indicates that the interpretation of O’Neil et al. (2000) and Elmegreen et al. (2004a) is correct. It shows chain structures when viewed edge-on and during a period of very high SFR; see Fig. 5. Because this period is short compared to a Hubble time, these objects will be relatively rare, and because of the high SFR, they are very blue. The model therefore naturally explains also the observation of CHS95 that a large fraction of chains is very blue. A comparison of the model colors with those of CHS95 is shown in Fig. 6. Best agreement is obtained if our model is shifted to redshifts between 0.8 and 1.8 (see also Immeli et al. (2003)).

Comparing the color profile of the chain galaxies with observations (Fig. 7) shows also good agreement. The model reproduces the flat profile, which in our model is a direct consequence of the constant-surface density infall. The typical exponential profile observed in present-day disk galaxies only emerges in the instability phase. The scale length of the resulting exponential disk depends on the infall radius.

Because of the strong instabilities in the disk, gas and stars are dynamically heated. The gas, on the other hand, is also cooled by dissipative cloud collisions. In the present model, the velocity dispersion of the gas takes values between 30 and 50 , about 25% of the maximal rotation velocity. This is consistent with estimates from observations (Elmegreen et al., 2004a). Also the number of clumps and their masses are in perfect agreement with these observations.
3.3 Local galaxies
Do gas-rich disk systems at low redshift also tend to form fragments with enhanced SF? An example of a nearby galaxy in which the fragmentation process may be taking place, is the gas-rich, blue starburst galaxy NGC 7673 (Homeier & Gallagher, 1999). This object has a remarkably clumpy morphological appearance, seen in both the R-band and H, even though the H velocity field is that of a regular, rotating disk.
Dwarf irregular galaxies observed in the local universe generally have a high gas fraction and often a disk-like structure. Recent observations (Billett et al., 2002) show that there is a tendency for star formation to be concentrated in localized regions of high column density. Due to the lower mass of the dwarf galaxies, one cannot directly compare them to our model. In particular, the dynamical influence of the dark halo is likely to be more important in dwarf galaxies; explicit models of such lower mass galaxies are needed.
4 Merger or Fragmentation?
Kinematical data will be important to further clarify the nature of chain galaxies. While in our fragmented disk model the massive clumps should still show the underlying disk rotation, in a merger scenario no similar alignment of the clump velocities is expected. Fig. 8 shows the predicted influence of the clumps on the rotation curve of the gaseous disk; deviations from the smooth rotation profile are up to 100 . These deviations are due to the gravitational influence of the massive clumps; they are much larger than expected from the velocity dispersion in the disk alone. In summary, while the basic rotation pattern remains visible during the fragmentation phase, it is severely disturbed by the innermost brightest knots.

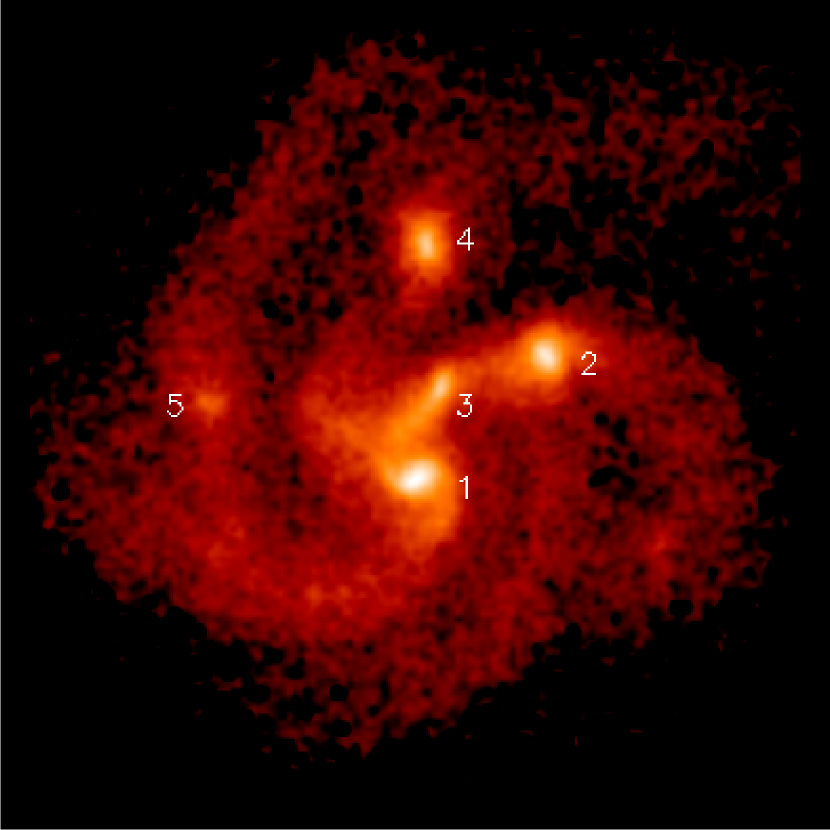
Additionally, the metallicities of the clumps in a merger event are expected to vary significantly, depending on the mass and evolution history of the merging clumps. Contrarywise, one expects similar metallicities for the clumps in a fragmented disk. We investigate the metallicity of five clumps selected in the fragmented disk model as indicated in Fig. 9. We get abundance differences of up to 0.25 dex (Table 1), depending on the masses of the clumps ( for those in Fig. 9). No differences in oxygen-to-iron ratios can be measured, due to dominance and young age of the starburst.
Many authors report observations of multiple knots (Driver et al., 1995; Steidel et al., 1996, vdB96). The fragmentation scenario naturally explains objects consisting of several clumps, whereas in a merging scenario it is much less likely to see more than three nearby clumps merging at the same time. Also, the synchronized colors often observed in these clumpy objects (Abraham et al., 2001) are naturally explained with the fragmented disk scenario. In the present model, the mean age of the stars seen edge-on in the clumps is constant within 70 Myr. At least some of the observed multi-clump systems may therefore represent fragmented disks. This is confirmed by the recent observations of Elmegreen et al. (2004a): a merger event would lead to more spheroidal systems than the thin chain galaxies.
5 Conclusions
A short formation timescale of a galactic disk due to a high dissipation rate for the cold gas phase leads to fragmentation and to the formation of a clumpy disk with an enhanced SFR in the clumps. After the fragmentation phase the clumps fall to the center building a massive bulge. Subsequent bar formation is prevented by the massive bulge.
Chain and multi-clump morphological structures, as well as synchronized colors observed in high redshift objects, can be well explained by a fragmented disk in a gas rich, single galaxy. Chain, double and tadpole galaxies may be different evolutionary states of a fragmented disk. Our model suggests that these galaxies are in their formation process and are observed during their relatively short fragmentation phase, with a high SFR, comparable to the model SFR of up to . This high SFR is generated by a disk instability alone, and there is no need for external triggering through interactions or a merger with other galaxies.
The effects of single clumps on the mass-weighted rotation curve in our model can be as high as 100 . Nonetheless the underlying rotation signature should be observable. Metallicity differences in the clumps of the fragmented disk are no larger than 0.25 dex, while their mean stellar ages are highly synchronized. Observations to test these predictions are highly desirable.
We thank the Schweizerischen Nationalfonds for financial support of this work and the Centro Svizzero di Calcolo Scientifico (CSCS) for giving us the opportunity to use their computing facilities.
| Clump | Mass [] | [O/H] | [Fe/H] | [O/Fe] |
|---|---|---|---|---|
| 1 | 7.96 | -0.32 | -0.72 | 0.40 |
| 2 | 4.10 | -0.38 | -0.77 | 0.39 |
| 3 | 2.02 | -0.44 | -0.84 | 0.40 |
| 4 | 2.39 | -0.42 | -0.82 | 0.40 |
| 5 | 0.64 | -0.59 | -0.98 | 0.39 |
References
- Abraham et al. (1996) Abraham, R. G., Tanvir, N. R., Santiago, B. X., Ellis, R. S., Glazebrook, K. & van den Bergh, S. 1996, MNRAS, 279, L47
- Abraham et al. (2001) Abraham, R. G., & van den Bergh, S. 2001, Science, 293, 1273
- Balsara et al. (2001) Balsara, D., Ward-Thompson, D., Crutcher, R. M. 2001, MNRAS, 327, 715
- Billett et al. (2002) Billett, O. H., Hunter, D. A., & Elmegreen, B. G. 2002, AJ, 123, 1454
- Carollo & Lilly (2001) Carollo, C. M. & Lilly, S. J. 2001, ApJ, 548, L153
- Cowie et al. (1995) Cowie, L. L., Hu, E. M. & Songaila, A. 1995, AJ, 110, 1576
- Dalcanton & Shectman (1996) Dalcanton, J. J., & Shectman, S. A. 1996, ApJ, 465, L9
- Dickinson (2000) Dickinson, M. 2000, in “Building Galaxies: From the Primordial Universe to the Present”, XIXth Moriond Astrophysics Meeting, ed. F. Hammer et al. (Paris: Ed. Frontieres), 257
- Driver et al. (1995) Driver, S. P., Windhorst, R. A., & Griffiths, R. E. 1995, ApJ, 453, 48
- Ellis et al. (2001) Ellis, R.S., Abraham, R.G., & Dickinson, M. 2001, ApJ, 551, 111
- Elmegreen et al. (2004a) Elmegreen, D. M., Elmegreen, Bruce G., Hirst, A. C. 2004, ApJ, 604, 21L
- Elmegreen et al. (2004b) Elmegreen, D. M., Elmegreen, Bruce G., Sheets, C. M. 2004, ApJ, 603, 74
- Fernandez-Soto et al. (1999) Fernandez-Soto, A., Lanzetta, K. M., & Yahil, A. 1999, ApJ, 513, 34
- Giavalisco (2002) Giavalisco, M. 2002, ARA&A, 40, 579
- Homeier & Gallagher (1999) Homeier N. L., Gallagher J. S., 1999, ApJ, 522, 199
- Immeli et al. (2003) Immeli, A., Samland, M., Gerhard, O. 2003, EAS Publications Series 10, “Galactic and Stellar Dynamics”, ed. C. M. Boily, P. Pastsis, S. Portegies Zwart, R. Spurzem and C. Theis, pp. 199
- Immeli et al. (2004) Immeli, A., Samland, M., & Gerhard, O. E., Westera P. 2004, A&A, 413, 547
- Kennicutt (1998) Kennicutt, R. C., 1998 ApJ, 498, 541
- Kim et al. (2001) Kim, J., Balsara, D., Mac Low, M.-M. 2001, JKAS, 34, 333
- Larson (1969) Larson, R.B., 1969, MNRAS, 145, 405
- Lowenthal et al. (1997) Lowenthal, J. D., Koo, D. C. Guzman, J. G., Phillips, A. C., Faber, S. M., Vogt, N. P., Illingworth, G. D., & Gronwall, C. 1997, ApJ, 481, 673
- McKee & Ostriker (1977) McKee, C. F., Ostriker, J. P., 1977, ApJ, 218, 148
- Noguchi (1998) Noguchi, M. 1998, Nature, 392, 253
- Noguchi (1999) Noguchi, M. 1999, ApJ, 514, 77
- O’Neil et al. (2000) O’Neil, K., Bothun, G. D., & Impey, C. D. 2000, ApJS, 128, 99
- Samland & Gerhard (2003) Samland, M., & Gerhard, O. 2003, A&A, 399, 961
- Schmidt (1959) Schmidt, M. 1959, ApJ, 129, 243
- Sommer-Larsen et al. (2002) Sommer-Larsen, J., Götz, M., & Portinari, L. 2002, astro-ph/0204366
- Steidel et al. (1996) Steidel, C., Giavalisco, M., Dickinson, M., & Adelberger, K. L. 1996, AJ, 112, 352
- Taniguchi & Shioya (2001) Taniguchi, Y, & Shioya, Y 2001, ApJ, 547, 146
- van den Bergh et al. (1996) van den Bergh, S., Abraham, R. G., Ellis, R. S., Tanvir, N. R., Santiago, B. X., & Glazebrook, K. G. 1996, AJ, 112, 359
- Westera et al. (2002) Westera, P., Samland, M., Gerhard, O., & Buser, R. 2002, A&A, 389, 761
- Williams et al. (1996) Williams, R. E., et al. 1996, AJ, 112, 1335