marcs-Model Stellar Atmospheres, and Their Application to the Photometric Calibration of the Spitzer-IRS
Abstract
We describe state-of-the-art marcs-code model atmospheres generated for a group of A dwarf, G dwarf, and late-G to mid-K giant standard stars, selected to photometrically calibrate the Spitzer-IRS444The IRS was a collaborative venture between Cornell University and Ball Aerospace Corporation funded by NASA through the Jet Propulsion Laboratory and the Ames Research Center. The Spitzer Space Telescope is operated by the Jet Propulsion Laboratory, California Institute of Technology under NASA contract 1407. Support for this work was provided by NASA through an award issued by JPL/Caltech., and compare the synthetic spectra to observations of HR 6688, HR 6705, and HR 7891. The general calibration processes and uncertainties are briefly described, and the differences between various templated composite spectra of the standards are addressed. In particular, a contrast between up-to-date model atmospheres and previously published composite and synthetic spectra is illustrated for wavelength ranges around 8 m (where the SiO band occurs for the cooler standards) and m, where the use of the Engelke function will lead to increasingly large discrepancies due to the neglect of gravity in cool stars. At this point, radiometric requirements are being met, absolute flux calibration uncertainties (1-) are % in the SH and LH, and % in the SL and LL data, and order-to-order flux uncertainties are 10 % or less. Iteration between the marcs model atmosphere inputs and the data processing will improve the S/N ratios and calibration accuracies.
Subject headings:
instrumentation: spectrographs — methods: data analysis — stars: atmospheres — infrared: stars1. Introduction
The scientific interpretation and modeling of the spectra produced by the Infrared Spectrograph (IRS; Houck et al., 2004) onboard the Spitzer Space Telescope (Werner et al., 2004) require accurate spectrophotometric calibrations, which depend stars with well known environmental and atmospheric properties. We have a unique opportunity to use the state-of-the-art marcs-code, developed by the Uppsala group (Gustafsson et al., 1975) and modified substantially in the numerical methods and input line and continuous opacities, to compute synthetic spectra of the IRS standard stars. The iteration between stellar models and instrument calibrations has been described by Decin et al. (2000, 2003a, 2003b, 2003c), with applications to calibrations of the Short Wavelength Spectrometer (SWS) onboard the Infrared Space Observatory (ISO).
In this paper we describe the synthetic spectra based on the marcs-code model atmospheres tailored to a set of standard stars that are relied upon for the photometric calibration of the IRS. We overview the calibration strategy, and summarize the primary IRS stellar standards. The latest generation model spectra of these stars are discussed, presented in comparison to IRS spectra of three standards. We finally contrast our synthetic spectrum for Dra (K5 III) with widely available Kurucz model and composite spectra, and summarize the current photometric uncertainties.
2. The IRS Spectrophotometric Calibration Scheme
The basic strategy for spectrally and photometrically calibrating the IRS modules has been outlined by Morris et al. (2003). Each spectral order in the Short Low and Long Low (SL and LL, respectively; ) long slit spectrographs, and the Short High and Long High (SH and LH, respectively; 700) echelle spectrographs is individually calibrated
2.1. Spectral Calibrations
Spectral calibrations are determined by observations of a combination of smooth, extended celestial sources, and emission line sources. The zodiacal light at its maximum intensity and extended nebulae pointed off the central source are useful for determining the order widths, which reflect the widths of the slits, spectrally imaged into the arrays. The order widths are measured at the 45% crossing point of the illumination profile for each order, and are very nearly 5 pixels for each of the SH and LH echelle orders, and 36 pixels for the low resolution orders. The output signal from the zodiacal light measurements can also be used to characterize the pixel-to-pixel response variations along the cross-dispersed direction of the SL and LL orders, but is not sufficiently strong for accurately determining these response variations in the high resolution orders. Emission line sources such as Be stars P Cygni (B2pe I) and Cas (B0.5e IV), planetary nebulae NGC7027, NGC6543, SMP083, and SMP031, and Saturnian moon Titan all provide strong, unresolved lines to determine the wavelength solutions, spectral resolutions, and instrument profiles. Moving the sources to different locations in the slits allows us to further characterize impacts on the wavelength calibration by pointing offsets, and by pixel undersampling of the point spread function (PSF). All four arrays undersample the PSF, due to the excellent focus of the telescope and of the f/12 light beamed onto the IRS arrays, which maximizes the sensitivities. However, the undersampling leads to various spectral and photometric complications, such that (for example) line centroiding accuracies are reliable to 1/5 a resolution element, about half of the accuracy achievable for a critically sampled PSF. Measurements from flight observations of celestial sources supersede the laboratory measurements, carried out in pre-launch tests to verify design requirements.
2.2. Photometric Calibratoins
Relative spectral response calibrations are determined by placing photometric standards at as many locations in the slits as is feasible (executed as fine spectral maps), processing and combining the data collection events into a single 2-D image plane, and removing signature of the celestial source by means of the synthetic spectra. Ideally the spectral flatfield for each array is determined by a weighted mean of flats individually derived from different stars; initially they are determined for each array from a single star. The resultant flatfield is then applied to observations of other standards, and the spectral extractions are analyzed to determine the flux conversion coefficients (electrons/second to Janskys) and polynomial “tuning” coefficients to correct for the effects of diffraction losses on point source observations, and systematic low frequency residual errors from the flatfielding. The flatfields are stored as FITS image files to be used in the IRS Basic Calibrated Data (BCD) Science pipeline, and the flux conversion and tuning coefficients are stored in ASCII-format tables for application to 1-D spectral extractions in the post-BCD Science pipeline.
The implementation of the above scheme requires staged efforts. In the Science Verification (SV) phase only sparse spectral maps of the calibration stars could be acquired, and depended on zodiacal light observations to spatially fill in the orders.555The zodiacal light itself is unreliable in the spectral dimension due to the likely presence of solid state features and latitudinal variations in dust temperature and grain properties (Reach et al., 2003). Due to the relatively low zodiacal fluxes (in SH, LH, and SL-2nd order), the effects of PSF undersampling, and space weather on the detectors, exhaustive observations of the standard stars continue to be carried out in order to meet the radiometric requirement of 5 %. The details of the stellar atmosphere models are especially important at this stage.
| Source | Sp. | Cal.aaCalibration types: P = Principal, S = Secondary, T = Testcase. Principal standards are observed to derive flatfields and absolute flux calibration; secondary standards, which may have limited visibilities or less certain stellar parameters, are observed to verify or further refine the calibrations. | RangebbEntries refer to the IRS modules, as follows: SL1 7.5-14.5 m; SL2 5.3-7.5 m; LL1 19.5-38.0 m; LL2 14.0-21.3 m; SH 9.9-19.6 m; LH 18.7-37.2 m. Brackets denote where calibration stars may be used only over certain ranges of the module. | g | |
|---|---|---|---|---|---|
| Type | [K] | [cm/s2] | |||
| HR 6688 | K2 III | P | SH, LH | 4465 (50)ccDerived from (). | 2.17 (0.19)ffUsing [Fe/H] from Cayrel de Strobel et al. (1997). |
| HR 7310 | G9 III | P | [SH],[LH] | 4830 (50)ccDerived from (). | 2.58 (0.06)ffUsing [Fe/H] from Cayrel de Strobel et al. (1997). |
| HR 2194 | A0 V | P | SL1,SL2 | 10325 (240)ddDerived from (). | 4.09 (0.08) |
| HR 7341 | K1 III | P | LL2 | 4570 (50)ccDerived from (). | 2.46 (0.08) |
| HR 7950 | A1.5 V | S | SL1,SL2 | 9060 (120)ddDerived from (). | 3.51 (0.08)ffUsing [Fe/H] from Cayrel de Strobel et al. (1997). |
| HR 7891 | A0 V | S | SL1,SL2 | 10170 (120)ddDerived from (). | 4.07 (0.07)ffUsing [Fe/H] from Cayrel de Strobel et al. (1997). |
| HR 6705 | K5 III | S | SH,LH | 3980 (50)ccDerived from (). | 1.06 (0.09)ffUsing [Fe/H] from Cayrel de Strobel et al. (1997). |
| HR 6606 | G9 III | S | all | 4975 (50)ccDerived from (). | 2.90 (0.07) |
| HR 2491 | A1 V | T | SH,LH | 10240 (120)ddDerived from (). | 4.39 (0.07)ffUsing [Fe/H] from Cayrel de Strobel et al. (1997). |
| HD 105 | G0 V | T | all | 5930 (70)eeDerived from ()-temperature relation of Flower (1996). | 4.31 (0.11)ggUsing [Fe/H] from the - – metallicity relation of Schuster & Nissen (1989). |
3. Standard Star Selection
Table 1 summarizes the stars which have been selected and observed during SV and in IRS Science campaigns for the purposes of photometrically calibrating IRS spectroscopy. The stars were chosen in the pre-launch preparatory phase, to meet (as closely as possible) specific criteria on the availability of observational data to make reasonable estimates of the stellar parameters (described in the next section), their environments, and absence of chromospheric activity, circumstellar dust shell or disk, multiplicity, or peculiar spectral activity. The IRS operating at low resolution is 300 times more sensitive than SWS was at 10 m, and consequently the fainter standard stars may meet the aforementioned requirements to a lesser extent than stars in the ISO calibration programs. We make use of observations from the ISO ground-based preparatory program (Hammersley et al., 1998; Hammersley & Jourdain de Muizon, 2003) and detailed theoretical work where possible. In particular, HR 6688, HR 6705, HR 7310, and HR 2491 in Table 1 have been previously modeled by Decin et al. (2003a, c) using ground-based and 2.4 – 12 m ISO-SWS spectroscopy. Generally, G-K giants are used to calibrate the LH, LL, and SH modules, and the A dwarfs to calibrate SL. This balance is struck by the higher potential for debris disks around the A stars, and non-photospheric molecular and dust layers around late-type M giants. The selection of the G and K standard stars was nevertheless made on a very restricted basis: several infrared studies based on the CO lines (at 2.3 m) and the CO lines (at 4.6 m) have revealed a thermal dichotomic structure in the outer layers of later-type stars (e.g. Wiedemann et al., 1994). A two-component structure — consisting of the traditional chromosphere and a radiative equilibrium region mediated by molecules with CO cooling dropping the temperature — with physically distinct areas of hot and cool material at the same altitude is thought to better represent the cool stellar atmosphere than do existing homogeneous one-component models. For our purposes, we have selected stars which are thought to belong to the group of “quiet” stars for which the radiatively-cooled regions very largely dominate the stellar surface, so that the single component RE atmospheric models are most likely to be valid.
4. Reference SEDs — marcs synthetic spectra
A new set of theoretical reference SEDs has been calculated using the marcs and turbospectrum code (Gustafsson et al., 1975; Plez et al., 1992, and further updates), using the same physical input parameters of atomic and molecular equilibrium constants, solar abundances, continuous opacity sources, etc., as the ones described by Decin (2000). For line opacities in the IRS spectral range, a database of infrared lines with atomic and molecular transitions (CO, SiO, H2O, OH, NH, HF, HCl, CH, and NO) has been prepared. References and discussion of the inputs can be found in Decin (2000). The standard assumptions of homogeneous stationary layers, hydrostatic equilibrium and LTE were made. Energy conservation was required for radiative and convective flux, where the energy transport due to convection was treated through a local mixing-length theory. The turbulent pressure was neglected. The Rosseland optical depth scale has been chosen to span values from 610-8 to 300 in order to ensure the fulfillment of the diffusion approximation adopted as lower boundary condition for all frequencies, and to minimize the the number of frequencies for which the surface layers are still optically thick.
The computed theoretical atmosphere model and synthetic spectrum depend on a large number of input parameters, the main ones being the effective temperature , the gravity , the microturbulence and the chemical composition. In case of a spherical symmetric geometry, one also has to provide either the mass or the radius . the stellar parameters as determined by Decin et al. (2003a, c) for stars in common with the ISO-SWS calibrators may be adopted. However, since we aim to set up a spectral response calibration independently, we prefer to make initial estimates of and [cm s-2] from photometric colors (see below). Since almost no information is available for the microturbulence , a value of 2 km s-1 was assumed. Nevertheless, it should be noted that since the final calibration of the ISO-SWS relative spectral response functions (RSRF) was also based on marcs model atmospheres, the IRS spectral response calibration and methods to iterate between the input parameters and spectroscopy (e.g., Decin et al. (2003a, b, c)) are linked to the SWS-RSRFs. Moreover, first estimates of C, N, and O abundances and the -ratio — being crucial for a correct computation of the molecular opacities in K-giants — are adopted from recent analyses of the ISO-SWS calibrators by Decin et al. (2003a). can be calculated for K and M giants directly from , and for A-type dwarfs from , using (semi)-empirical color-temperature relations (e.g., Bessell et al., 1998). Such a calibration is e.g. given by Bessell et al. (1998) who derived a polynomial fit between and or from (a) the infrared-flux method (IRFM) for A-K stars, and (b) Michelson interferometry for K-M giants. For that purpose, the and Johnson or 2MASS colors were converted to the Johnson-Cousins-Glass system (Bessell & Brett, 1988) and corrected for interstellar extinction using mag kpc-1 (Blackwell et al., 1990), and and (Mathis, 1990), with the distance calculated from the Hipparcos parallax . Whenever the derived color estimates were outside the ranges specified by Bessell et al. (1998) in their Tables 7 – 8, the color-temperature relation as determined by Flower (1996) was used.
In order to estimate the gravity, one needs the radius and the stellar mass . The first parameter is assessed from (, BCK, , ()) for K giants or (, BCV, , ()) for A-G dwarfs. The BCK bolometric corrections are derived from Bessell et al. (1998) whenever appropriate, otherwise the BCV data of Flower (1996) were used. The uncertainty on the bolometric correction is assumed to be 0.05. Mbol,⊙ is assumed to be 4.74 (Bessell et al., 1998). Mass values for the stars in our sample are estimated from evolutionary tracks with appropriate metallicity as calculated by Girardi et al. (2000). The estimated mass depends critically on the assumed metallicity, which has been adopted from literature references (see Table 1). Where no information was available, a solar metallicity was assumed. The resultant gravity for each star is listed in Table 1.
5. IRS Spectra of Representative Standards
In this section we compare reduced spectra of representative standards to their synthetic SEDs, to assess the models and calibrations. The observations have been processed to BCD products using the SSC pipeline version S9.5.0, and were response calibrated with the latest flatfields, except for HR 6688, which was calibrated from observations of Sirius and Vega. Prior to extraction of low resolution spectra of HR 7891, the flatfielded BCDs were treated for removal of background sky emission. Spectra were extracted and flux calibrated with the SSC pipeline, from BCDs with the star near the nod and slit center positions, and then spectra were sigma-clipped and combined. Photometric uncertainties are discussed in Sect. 7.
5.1. Bright standards HR 6688 and HR 6705
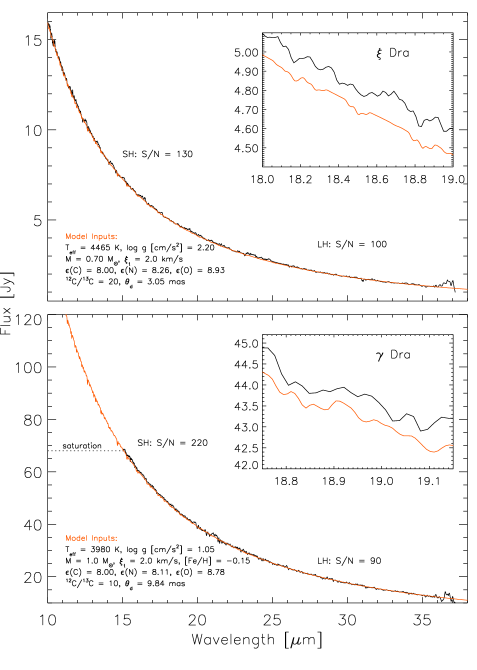
The comparison between the IRS spectra and the model of HR 6688 is shown in the upper panel of Fig. 1. The data quality is sufficiently high to make plausible detections of spectral lines with predicted line-to-continuum ratios as low as 1% (see Fig. 1 inset displaying OH spectral features). The shape of the observed continuum is in excellent agreement with the model (relying intrinsically on the accuracy of the Sirius model). The high resolution spectrum of HR 6705, the primary flux calibrator for the ISO-SWS, is shown in the lower panel of Fig. 1. The region between 1015 m is not plotted due to saturation over portions of echelle orders 1520. The remaining spectrum is calibrated with the default calibrations, that is, HR 6688-based flatfields and tuning factors. The shape of the continuum is again in excellent agreement with the model, and the inset plot again demonstrates the potential for detection of weak (molecular) spectral features, and improvements to processing methods.
5.2. HR 7891
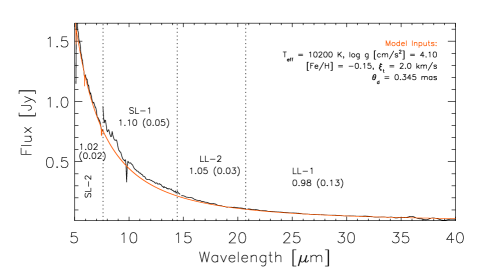
The spectrum of HR 7891 plotted in Fig. 2, spanning two orders of magnitude in flux densities, is representative of the agreement between independently calibrated low resolution spectroscopy of this A dwarf secondary stardard star, not previously observed at these wavelengths, and its marcs model atmosphere. The background sky was subtracted with off-pointed subslits prior to spectral extraction. The ratio the model and observations show a 10 % error in the absolute flux calibration of the SL-1 portion, but otherwise excellent agreement, and that the star has no detectable thermal excess from a potential debris disk.
It is helpful to point out the difficulties imposed by background emission, increasing towards the ecliptic plane to typical levels of several tens of MJy sr-1. Normally this can be corrected with an off-pointing, as done for the observations plotted in Fig. 2. If this is not available, then a coarse correction can be applied using a Spitzer-centric COBE/DIRBE thermal model of the zodiacal dust on the date of the observation, using appropriate scaling factors for the solid angles of the individual slits. The uncertainties associated with the zodiacal light model (including the likely presence of silicate dust bands), and with the aperture solid angles, limit the accuracy of the corrections to 20% at any wavelength. A residual tilt may also remain from the fact that both extended and point source signal may fall through the slits, while calibrations are based solely on point sources (such that corrections for diffraction losses would not be adequately compensated by simple scalings using a zodiacal light model).
6. Comparison with Templated Spectra
The photometric calibration schemes of the ISO and Spitzer instruments have been partly based on templated datasets, such as those constructed by M. Cohen and collaborators (e.g., Cohen et al., 2003), with both observational and theoretical components to them. The Cohen datasets can be divided into three categories: (a) a collection of absolutely calibrated photometric and spectroscopic data, merged to create a continuous spectrum with uncertainties traceable to a specific group of stars such as Tau and Vega; (b) a Kurucz model adopted at a literature concensus of , log(g), and metallicity, then fit to available photometry; and (c) a template constructed from a star from (a) and/or (b) with the same spectral type, and scaled to the observed photometric data. Stars with the same spectral type may exhibit a different abundance pattern, affecting e.g. the SiO band strengths and continuum levels. Products in the (a) group when available are helpful to the IRS since they rely on no theoretical assumptions, except for the use of an Engelke function at 20 m, and some products in the (c) group are also useful for “testcase” standards which can be observed to monitor the external photometric stability of the instrument in conjunction with pointing performance of the spacecraft, AOT repeatibility, and statistical measures. A number of stars not listed in Table 1 are being observed in normal operations for these activities, and we rely on products in groups (a) and (c) for stars whose individual value is their membership in the ensemble.
For the stars listed in Table 1, we rely explicitly on the marcs synthetic spectra for the detailed calibration analyses, noting that while a composite is available for HR 6705 (Cohen et al., 1996), it makes use of an Engelke function extrapolation beyond 18.5 m, which we prefer to avoid (see next paragraph). For a wider (secondary) set of stars, which are generally too uncertain in their stellar or environmental parameters to initially justify the computational resources of MARCS modeling, we can use composite observations templated by spectral type and luminosity class, or Kurucz synthetic spectra with the understanding that they are calculated assuming a plane-parallel geometry, solar abundances (scaled to the metallicity), and a microturbulent velocity of 2 km s-1, while these are all free input parameters for the marcs atmosphere models. Note also that some of the line lists for diatomic molecules used in Kurucz models are fifteen years old, incomplete, and do not reproduce line positions very well for high and high . The stars of this group are typically used for trending and checks of order-to-order and module-to-module calibrations, and response to high and low flux point sources.
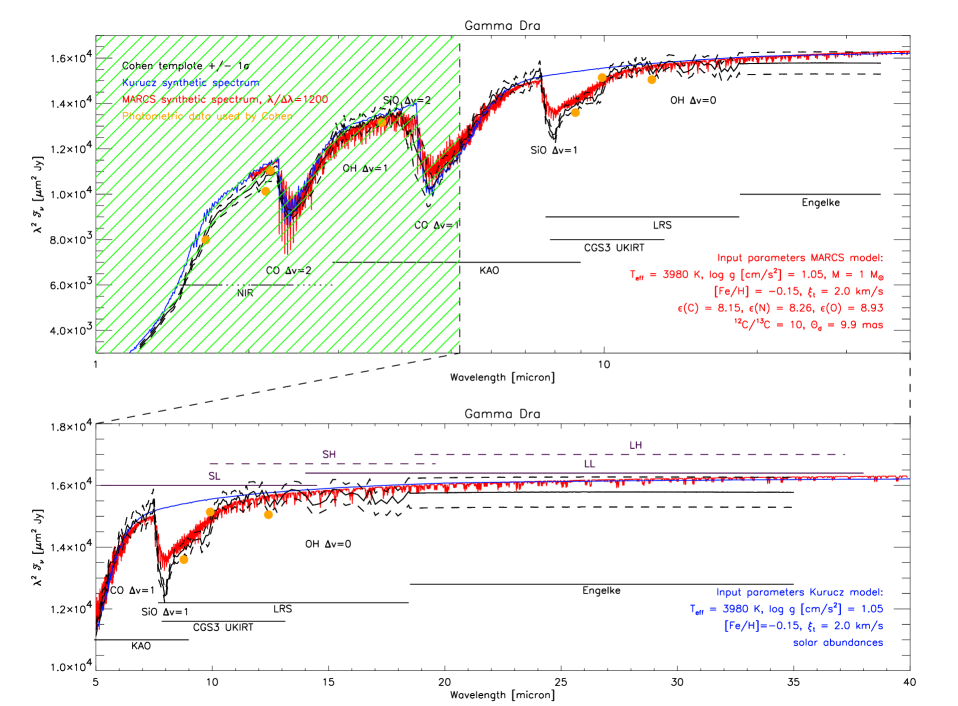
To illustrate these differences over the mid-IR spectral range, we show three datasets created for HR 6705 in Fig. 3. The composite constructed by Cohen et al. (1996) is plotted in black, with the photometric points and the various spectral fragments indicated. Of great importance to the IRS occurs at m, where fluxes are approximated with the Engelke function (Engelke, 1992), which offers an analytical implicit scaling of a semi-empirical solar atmospheric temperature profile to differing effective temperatures. This analytical (plane-parallel) approximation should be valid for the 2–60 m continuum for giants and dwarfs with effective temperature 3500 K 6000 K, where scattering of electrons from H- dominates the continuum opacity. By fitting this function to a set of standard stars, Engelke (1992) concluded that the estimated probable error in estimated flux is % below 10 m, up to % in the vicinity of 25 m, and 6 % at 60 m. The main spectral difference between the marcs and Kurucz theoretical spectra is the absence of the SiO fundamental (around 8 m) and first-overtone (around 4 m) lines in the Kurucz spectrum. Smaller differences do occur due to the use of a different abundance pattern. With an extension being only 3.7 %, the spectral differences between a plane-parallel and spherical geometry are only marginal.
The lowermost plot in Fig. 3 focuses on the wavelength ranges of the SL, LL, SH, and LH modules. Two main differences between the 3 data-sets are of major concern for IRS calibrations: (1) around 8 m where the SiO lines occur, and (2) for m.
(1) Comparison to the LRS data indicates that the abundance pattern used as input for the marcs model and synthetic spectrum calculation should be altered, in particular the oxygen (and carbon) abundance. With the moderate resolution of IRS () and the SL mode only starting around 5 m (being in the middle of the CO band for cool giants), it will be very difficult to constrain the stellar parameters (and in this case more specifically the oxygen abundance) from the IRS data. This situation can be avoided by relying on A dwarfs and G giants in this wavelength range.
(2) At LL and LH wavelengths, we see a clear difference between the slope of the marcs, Kurucz, and Cohen (Engelke) spectrum. With the Engelke function being a plane-parallel approximation, we have compared this function with marcs plane-parallel spectra for between 3500 and 6000 K for different values of the gravity. The best agreement occurs for = 6000 K, which is not surprising since Engelke’s function is based on a scaled solar model. For lower effective temperatures, the role of the gravity becomes more important: a higher gravity results in a higher opacity (from the free-free transitions of H-), a more compact object and a smaller temperature gradient due to the requirement of flux conservation. As a consequence, the infrared continuum slope ( m) is less steep for a higher gravity model. From a comparison with the marcs continua, we may conclude that the uncertainties quoted by Engelke (1992) do not account well for the influence of gravity. For HR 6705, the difference in slopes between the marcs model and the composite spectrum (using an Engelke function at 18.75 m) produces systematic underpredictions of fluxes in the composite by 4.2% at 30 m, and 6.3% at 70 m. These differences are easily within grasp of the sensitive IRS and the MIPS detectors.
7. Summary of the Spectrophotometric Uncertainties
First, we estimate that for well-pointed observations of point sources, the relative photometric uncertainties within any spectral order generally meet the 5% radiometric requirement, over the spectral ranges committed to observers. The exception is the two reddest orders of LH (34.2 – 37.2 m), where throughput response to HR 6688 is low, and will be improved with HR 6705 calibration observations by the time that this paper is published. It must also be noted that the ranges of 14.1–15.4 m in SL 1st order and 38–42.4 m in LL 1st order may be contaminated with light from around 7–8 and 19–21 m, respectively, due to a weakness in the transmission cutoff of the filter in the 2nd spectral orders. The level of contamination depends on the color of the source in the slit.
The photometric performance of the IRS is very sensitive to pointing effects, due to the sizes of the slits and the PSF widths. Combined with the effects of PSF undersampling, the absolute flux calibration is estimated at this point to be uncertain by 20% in the SH and LH data overall, and 15% in SL and LL data. Generally, order-to-order calibrations are 10% or less, for point sources in the low background (or background-corrected) limit666The low background limit is important even for the high resolution modules. Automatic background correction is not performed in the SSC pipeline. and well-placed in the center or nod positions of the slits. The errors are easily recognized, and can be mitigated by scaling to photometry, where available.
References
- Bessell & Brett (1988) Bessell, M. S. & Brett, J. M. 1988, PASP, 100, 1134
- Bessell et al. (1998) Bessell, M. S., Castelli, F., & Plez, B. 1998, A&A, 333, 231
- Blackwell et al. (1990) Blackwell, D. E., Petford, A. D., Haddock, D. J., Arribas, S., & Selby, M. J. 1990, A&A, 232, 396
- Cayrel de Strobel et al. (1997) Cayrel de Strobel, G., Soubiran, C., Friel, E. D., Ralite, N., & Francois, P. 1997, A&AS, 124, 299
- Cohen et al. (1996) Cohen, M., Witteborn, F. C., Carbon, D. F., Davies, J. K., Wooden, D. H., & Bregman, J. D. 1996, AJ, 112, 2274
- Cohen et al. (2003) Cohen, M., Megeath, S. T., Hammersley, P. L., Martín-Luis, F., & Stauffer, J. 2003, AJ, 125, 2645
- Decin (2000) Decin, L. 2000, PhD thesis, University of Leuven, Belgium
- Decin et al. (2000) Decin, L., Waelkens, C., Eriksson, K., et al. 2000, A&A, 364, 137
- Decin et al. (2003a) Decin, L., Vandenbussche, B., Waelkens, C., et al. 2003a, A&A, 400, 709
- Decin et al. (2003b) Decin, L., Vandenbussche, B., Waelkens, C., et al. 2003b, A&A, 400, 679
- Decin et al. (2003c) Decin, L., Vandenbussche, B., Waelkens, C., et al. 2003c, A&A, 400, 695
- Engelke (1992) Engelke, C. W. 1992, AJ, 104, 1248
- Flower (1996) Flower, P. J. 1996, ApJ, 469, 355
- Girardi et al. (2000) Girardi, L., Bressan, A., Bertelli, G., & Chiosi, C. 2000, A&AS, 141, 371
- Gustafsson et al. (1975) Gustafsson, B., Bell, R. A., Eriksson, K., & Nordlund, Å. 1975, A&A, 42, 407
- Hammersley & Jourdain de Muizon (2003) Hammersley, P. L. & Jourdain de Muizon, M. 2003, in ESA SP-481: The Calibration Legacy of the ISO Mission, 129
- Hammersley et al. (1998) Hammersley, P. L., Jourdain de Muizon, M., Kessler, M. F., et al. 1998, A&AS, 128, 207
- Houck et al. (2004) Houck, J., et al. 2004, ApJS, this issue.
- Mathis (1990) Mathis, J. S. 1990, ARA&A, 28, 37
- Morris et al. (2003) Morris, P. W., Charmandaris, V., Herter, T., Armus, L., Houck, J., & Sloan, G. 2003, in ESA SP-481: The Calibration Legacy of the ISO Mission, 113
- Plez et al. (1992) Plez, B., Brett, J. M., & Nordlund, Å. 1992, A&A, 256, 551
- Reach et al. (2003) Reach, W. T., Morris, P., Boulanger, F., & Okumura, K. 2003, Icarus, 164, 384
- Schuster & Nissen (1989) Schuster, W. J. & Nissen, P. E. 1989, A&A, 221, 65
- Werner et al. (2004) Werner, M., et al. 2004, ApJS, this issue.
- Wiedemann et al. (1994) Wiedemann, G., Ayres, T. R., Jennings, D. E., & Saar, S. H. 1994, ApJ, 423, 806