Nature of two massive protostellar candidates: IRAS 21307+5049 and IRAS 22172+5549
We present observations of continuum and molecular lines towards the protostar candidates IRAS 21307+5049 and IRAS 22172+5549. Single-dish maps in the 12CO (2–1), C18O (2–1), H13CO+ (1–0) lines and 850 m continuum are compared with interferometric maps in the 12CO (1–0) line and 3 mm continuum, and with mid- and near-infrared images. Also, single-pointing spectra of the CH3C2H (6–5), (8–7) and (13–12) lines observed towards IRAS 21307+5049, and H2 and [FeII] line emission observed towards IRAS 22172+5549, are presented. A plausible interpretation of our data based on the continuum maps and spectral energy distributions is that two components are present: a compact molecular core, responsible for the continuum emission at wavelengths longer than m, and a cluster of stars located close to the center of the core, but not spatially coincident with it, responsible for the emission at shorter wavelengths. The core is approximately located at the center of the associated molecular outflow, detected for both sources in the 12CO (1–0) and (2–1) lines. The cores have masses of , and luminosities of . The outflows parameters are consistent with those typically found in high-mass young stellar objects. Our results support the hypothesis that in these sources the luminosity is dominated by accretion rather than by nuclear burning. We conclude that the sources embedded inside the cores are likely protostars with mass .
Key Words.:
Stars: formation – Radio lines: ISM – ISM: molecules, continuum – ISM: individual objects: IRAS 21307+5049, IRAS 22172+55491 Introduction
Molecular outflows are a well known phenomenon associated with the star formation process. Their origin is related to the formation of proto-stellar disks, and they play an important role in the accretion phase of a protostar. In fact, they increase the turbulence of the surrounding material, hence contributing to support the molecular cloud against gravitational contraction and perhaps halting the collapse onto the forming star. The role of outflows is especially relevant in the context of the high-mass () star formation process. While low-mass stars are believed to form through accretion, the mechanism for the formation of high-mass stars is still unclear. Two scenarios have been proposed: accretion (Behrend & Maeder behrend (2001)), or coalescence of several lower mass protostars (Bonnell et al. bonnell (1998); Stahler et al. stahler (2000)). Theoretical models predict that the accretion process naturally leads to the formation of disks and collimated bipolar outflows driven by the forming star, whereas in the coalescence scenario the outflows must be poorly collimated: it is thus important to investigate at high angular resolution the presence of collimated outflows originating from massive protostellar candidates in order to discriminate between coalescence and accretion.
Although many studies have been carried out on outflows originating from low-mass objects, only a limited number of observations are available for those associated with high-mass young stellar objects (YSOs). Moreover, most of these have been performed at low angular resolution (e.g. Zhang et al. zhang (2001); Beuther et al. 2002a ).
In this paper, we investigate the structure of two candidate massive protostars: IRAS 21307+5049 (hereafter I21307) and IRAS 22172+5549 (hereafter I22172). These sources, located at a kinematic distance of 3.2 and 2.4 kpc respectively (Molinari et al. mol02 (2002)), are part of an initial large sample of luminous IRAS sources. In a series of studies, Molinari et al. (mol96 (1996), 1998a , 1998b , mol00 (2000)) selected from the initial sample of 260 sources, a small number of likely massive YSOs thought to be in an early evolutionary stage preceding the formation of a compact Hii region. Then, more recently, Molinari et al. (mol02 (2002)) observed 11 of these sources at high angular resolution with the Owens Valley Radio Observatory (OVRO) in the HCO+ (1–0) line and in the millimeter continuum, and in the 3.6 cm radio continuum with the Very Large Array (VLA). For several of these sources, a compact molecular core was detected, and in several cases this core does not show emission at 3.6 cm. Moreover, in a few cases, non gaussian wings were identified in the HCO+ (1–0) line, suggesting the presence of outflows. These results indicate that in the OVRO sample there is a number of sources which present observational features expected for protostars. This is confirmed by Fontani et al. (fonta2 (2004)) who observed one of these sources, IRAS 23385+6053, with single dish telescopes and interferometers at various wavelengths: the authors have demonstrated the presence of a massive dusty core, which likely hosts a young stellar object in the protostellar phase.
Two other sources of the OVRO sample, I21307 and I22172, show the presence of a compact dusty core without centimeter continuum emission, with prominent wings in the HCO+ (1–0) line, and characterised by IRAS luminosities of a few (Molinari et al. mol02 (2002)). Hence, they represent likely massive YSOs, in an evolutionary stage preceding the formation of a compact Hii region. Recently, Zhang et al. (zhang (2001)) and Molinari et al. (mol02 (2002)) have detected towards both sources a compact outflow in the 12CO (2–1), 13CO (2–1) and HCO+ (1–0) lines. Here we present the results obtained from single-dish and interferometric observations towards I21307 and I22172, aimed at investigating their nature.
2 Observations and data reduction
The main characteristics of the observed sources are given in Table 1. The coordinates corresponding to the sub-mm peak position (Molinari et al. mol00 (2000)) in I21307 and to the 3.4 mm emission (Molinari et al. mol02 (2002)) in I22172, are listed in Cols. 2 and 3; the kinematic distance, , and the Galactocentric distance, , are given in Cols. 4 and 5, while the bolometric luminosity, (from Molinari et al. mol02 (2002)), and the source velocity, ( from Molinari et al. mol96 (1996)), are shown in Cols. 5 and 6, respectively.
Table 2 lists all molecular transitions observed. For each line, we give the rest frequency (Col. 2), the telescopes used (Col. 3), the half power beam width (HPBW) (Col. 4), the total bandwidth (Col. 5) and the spectral resolution (Col. 6).
2.1 IRAM-30m observations
2.1.1 12CO (2–1) and C18O (2–1)
The observations of the 12CO (2–1) line were carried out on February 28 2002 towards I21307, and July 14 2003 towards I22172. Those of the C18O (2–1) line were performed on July 13 2003. We made maps in the 12CO (2–1) line, and maps in the C18O (2–1) line using the HERA mutibeam receiver in the on-the-fly mode, in which the telescope moves across the source and dumps the data with 4′′ sampling. The dump time was 2 sec per position. We used the receiver with a derotator angle of 9.6∘. The observations were made in position switching mode for the 12CO (2–1) line, and in frequency switching mode for the C18O (2–1) line. The reference positions used for the 12CO (2–1) maps were 280 and for I21307, and 8 and for I22172, and they are CO-free at levels of K. Telescope HPBW, total bandwidth and spectral resolution are listed in Table 2. Focus and pointing were checked every hour by means of continuum cross scans on Uranus or 1253-055. The data were calibrated with the “chopper wheel” technique described in Kutner & Ulich (kutner (1981)). Calibration was checked by measuring the 12CO (2–1) line intensity towards the ultracompact Hii region W51D.
2.1.2 CH3C2H, H13CO+ and SiO
The CH3C2H, H13CO+ and SiO lines were observed towards I22172 on August 11, 1999.
For the CH3C2H lines, we simultaneously observed the (6–5), (8–7) and (13–12) rotational transitions in the 3 mm, 2 mm and 1.3 mm bands, respectively. The observations were made towards the nominal central position of I22172 given in Table 1. We used two spectrometers simultaneously: an autocorrelator, which covered the lowest components with high spectral resolution, and a filterbank with low spectral resolution which covered all components for the (6–5) and (8–7) transitions and up to the for the (13–12) line. In the following we shall make use only of the spectra obtained with the autocorrelator because all lines detected fall in the autocorrelator band.
For the H13CO+ (1–0) and the SiO (2–1), (3–2) and (5–4) () lines, 33 point maps were obtained, with 12′′ (H13CO+) and 24′′ (SiO) spacing.
We observed in “wobbler switching” mode, which uses a nutating secondary reflector with a beam-throw of 240′′ in azimuth and a phase duration of 2 sec. Pointing and receiver alignment were checked on nearby point sources, and were found to be accurate within 2′′. The data were calibrated with the “chopper wheel” technique. Calibration was checked by measuring the intensity of Venus at the same frequencies. The main beam brightness temperature, , and the flux density, , are related by the expression .
2.1.3 Data reduction and fitting procedure
CH3C2H is a symmetric-top molecule whose rotational levels are described by two quantum numbers: , associated with the total angular momentum, and , associated with its projection on the symmetry axis. This structure implies that for each rotational transition, lines are observable (for a detailed description see Townes & Schawlow townes (1975)). To analyze the CH3C2H data we have adopted the fitting procedure described in Fontani et al. (fonta (2002)), which assumes the same rest velocity and linewidth for all components.
All data were reduced with the GAG software developed at IRAM and Observatoire de Grenoble.
2.2 NRAO observations
Observations of the 12CO (2–1) transition were made on February 21 1998 towards I21307, and on January 10 1998 towards I22172, using the 12-m telescope of the National Radio Astronomy Observatory (NRAO) at Kitt Peak. We used the 1 mm SIS array receiver (Payne & Jewell payne (1995)), consisting of independent beams. The maps were acquired with a 29′′ spatial sampling, which is approximately the telescope HPBW at the 12CO (2–1) line frequency. The typical integration time on each position was about 4 minutes, with a system temperature of K for I21307, and K for I22172. Data were taken in position switching mode, and the same reference positions given in Sect. 2.1 were used, which are CO-free down to K. HPBW, spectral resolution and bandwidth are listed in Table 2.
2.3 JCMT observations
The 850m continuum images were taken on October 16 1998 with SCUBA at the JCMT (Holland et al. holland (1998)) towards the positions given in Table 1. The standard 64-points jiggle map observing mode was used, with a chop throw of 2 arcmin in the SE direction. This results in a map size. The atmospheric optical depth at 225 GHz was 0.15. Telescope focus and pointing were checked using Uranus and the data were calibrated following standard recipes as in the SCUBA User Manual (SURF).
2.4 OVRO Observations
Millimeter interferometric observations were performed using the Owens Valley Radio Observatory millimeter array. I21307 and I22172 were observed in the period from October to December 2001. The six 10.4-m dishes were employed in three separate configurations (C, L, and H), offering baselines from the shadowing limit to approximately 220 m. The flexible digital correlator was configured to observe simultaneously the CO(1–0) and the C17O(1–0) lines at 2.6 mm. The resolution used was 0.9 km s-1 over a 80 km s-1 bandwidth for the CO(1–0), and 0.65 km s-1 over a 20 km s-1 bandwidth for the C17O(1–0). Continuum observations have been performed making use of the 2 GHz bandwidth of the analog correlator. The observing cycle alternated observations of the two target sources and of the phase calibrators (2201508 and BL Lac); a calibration scan was acquired every 12 min. Pointing was checked and refined by frequent pointing sessions on BL Lac. Bandpass calibration was performed using observations of 3C273 and/or 3C345, while the flux density scale was determined using observations of either Uranus or Neptune (the expected accuracy is within 15%). The raw visibility data were calibrated using the OVRO in-house MMA package (Scoville et al. mma (1993)); the calibrated source data were then exported in FITS format for further analysis with standard packages.
2.5 Near-Infrared observations
2.5.1 Palomar 60-inch broad-band observations
I21307 and I22172 were observed in the three standard J, H, and Ks near-infrared broad-band filters using the P60IRC (Murphy et al. Mea95 (1995)) camera at the Palomar 60-inch telescope on 1999, November 30. For each source we obtained a set of dithered frames. After flat fielding and sky subtraction the frames were registered and coadded, producing final mosaics of a region of 3.′53.′5 around each of the two IRAS sources. Photometric calibration was ensured by observations of a set of stars from the Arnica and Las Campanas lists (Hunt et al. Hea98 (1998); Persson et al. Pea98 (1998)). The limiting magnitudes of our observations were found to be 18.0, 17.5 and 17.0 in J, H, and Ks respectively. Astrometric calibration was performed using stars from the HST Guide Star Catalogue, and later checked with 2MASS111http://www.ipac.caltech.edu/2mass/ objects in the field (the derived accuracy is within 1′′ rms).
2.5.2 TNG/NICS narrow-band observations
Near-Infrared narrow-band observations of I21307 and I22172 were performed on August 21, 2002, at the 3.56-m Telescopio Nazionale Galileo (TNG) at the Roque de Los Muchachos Observatory on the Spanish island of La Palma. The instrument used is the Near Infrared Camera and Spectrograph (NICS, Baffa et al. Bea01 (2001)), a cryogenic focal reducer designed and built by the Arcetri Observatory IR group as a common-user instrument for the TNG. NICS is equipped with a Rockwell 10242 HAWAII near infrared array detector. The plate scale used for our observations is 0.′′252/pix, for a total field of view of 4.′5. Series of dithered frames were obtained in the FeII, Hc, H2, and Kc filters, centered at the rest frequencies of the [FeII] 1.64 m transition, the H2(1-0)S(1) 2.12 m transition and the nearby continua (see Ghinassi et al. Gea02 (2002) for more details on the NICS filters). The seeing at the time of the observations was 0.′′9, but the sky conditions were not photometric, which did not allow to obtain a flux calibration for our images.
Data reduction and analysis were performed using the IRAF software package, following standard flat-fielding and sky subtraction, the individual images were registered and the final mosaic was produced. The narrow-band “continuum” filters were used to subtract continuum emission from the FeII and H2 images, assuming that a set of stars within each frame were not affected by significant line emission or absorption. Note that, because the Hc filter has a central wavelength slightly shorter (1.57 m) than that of the [FeII] filter, while Kc has a central wavelength slightly longer (2.19 m) than the H2 filter, very red stars will leave a positive residual in the [FeII] continuum subtracted image and a negative residual in the H2 continuum subtracted image. Accurate () astrometry was derived for all mosaics using stellar positions from the 2MASS observations.
3 Results
| Name | R.A.(J2000) | Dec.(J2000) | ||||
|---|---|---|---|---|---|---|
| (kpc) | (kpc) | () | (km s-1) | |||
| I21307 | 21 | 51 | 3.2 | 8.4 | 4.0 | 46.7 |
| I22127 | 22 | 56 | 2.4 | 7.8 | 1.8 | 43.8 |
3.1 Line emission
| Molecular | Rest freq. | Telescope | HPBW | Bandwidth | Resolution |
|---|---|---|---|---|---|
| transition | (GHz) | (′′) | (MHz) | (MHz) | |
| 12CO (1–0) | 115.271 | OVRO | 6.956.12 | 26.3 | 0.33 |
| 12CO (2–1) | 230.538 | 30m | 11 | 320 | 0.32 |
| 12CO (2–1) | 230.538 | NRAO | 29 | 150 | 0.78 |
| C18O (2–1) | 219.560 | 30m | 12 | 140 | 0.078 |
| H13CO+ (1–0) | 86.754 | 30m | 29 | 70 | 0.078 |
| CH3C2H (6–5) | 102.547 | 30m | 24 | 70 | 0.078 |
| CH3C2H (8–7) | 136.728 | 30m | 18 | 70 | 0.078 |
| CH3C2H (13–12) | 222.166 | 30m | 11 | 140 | 0.078 |
| SiO (,=2–1) | 86.846 | 30m | 29 | 70 | 0.078 |
| SiO (,=3–2) | 130.269 | 30m | 20 | 70 | 0.078 |
| SiO (,=5–4) | 217.105 | 30m | 12 | 140 | 0.078 |
rest frequency of the transition
In Figs. 1 and 2, we show the 12CO (2–1), C18O (2–1) and H13CO+ (1–0) (not observed towards I21307) spectra taken at the central position in the maps. We also show the CH3C2H (6–5), (8–7) and (13–12) spectra obtained towards I22172 (Fig. 3): for these lines, only single-pointing spectra are available. The 12CO (2–1) lines show non-Gaussian wings, while the C18O (2–1) line, the H13CO+ (1–0) line and the CH3C2H lines are well fitted by Gaussians. The SiO (2–1), (3–2) and (5–4) () lines are undetected up to a level of 0.18 K, 0.4 K and 0.3 K, respectively.
Finally, Fig. 4 presents the spectra of the 12CO (1–0) line observed with the OVRO interferometer: both spectra have been obtained by integrating the emission of the line above the level. In this case, the brightness temperature in the synthesized beam, , is plotted against the velocity. Both spectra clearly show intense emission in the wings, and the central peak is lacking: this is due to the fact that the channels near the line peak are representative of the more extended emission, which has been resolved out by the interferometer.
The integrated maps of the 12CO (2–1), C18O (2–1) and H13CO+ (1–0) lines are presented in Figs. 5 and 6. In I21307, the C18O integrated intensity map peaks right on the sub-mm source detected by Molinari et al. (mol00 (2000)). In I22172 all line maps are offset by ′′ E from the millimeter core (Molinari et al. mol02 (2002)). Since the H13CO+ and C18O observations have been carried out in different observing runs, it is unlikely that this effect is due to a pointing error. Moreover, we will see in Sect. 3.5.1 that a similar offset between line and continuum is confirmed by the interferometric observations.
In Table 3 we give the outflow parameters, namely: the velocity range of the blue- and red- wings, and (Cols. 3 and 4, respectively), the integrated intensity in the wings, (blue) and (red) (Cols. 5 and 6), and the maximum velocity of the wings, and (Cols. 7 and 8), defined as the difference between the maximum velocity of the blue- and red- wings and the line peak. The latter has been derived from the rest velocity given in Table 1. The velocity ranges of the wings have been determined from the spectrum of the 12CO (1–0) line observed with OVRO, which has the best angular resolution, and they are consistent with the wings observed in the other lines. The values listed in Cols. 5 and 6 are mean brightness temperatures over the blue and the red lobes, respectively.
| Source | Line | (blue) | (red) | ||||
|---|---|---|---|---|---|---|---|
| (km s-1 ) | (km s-1 ) | (K km s-1 ) | (K km s-1 ) | (km s-1 ) | (km s-1 ) | ||
| I21307 | 12CO (2–1) (NRAO) | (, ) | (, ) | 10.2 | 8.9 | 8.3 | 8.7 |
| 12CO (2–1) (30m) | (, ) | (, ) | 16.2 | 14.9 | 8.3 | 8.7 | |
| 12CO (1–0) (OVRO) | (, ) | (, ) | 13.2 | 34.8 | 8.3 | 8.7 | |
| I22172 | 12CO (2–1) (NRAO) | (, ) | (, ) | 21.1 | 22.5 | 7.4 | 13.6 |
| 12CO (2–1) (30m) | (, ) | (, ) | 25.4 | 30.0 | 7.4 | 13.6 | |
| 12CO (1–0) (OVRO) | (, ) | (, ) | 37.2 | 38.1 | 7.4 | 13.6 |


3.2 Continuum maps
| D | |||||
| (arcsec) | (pc) | () | () | (cm-3 ) | |
| 12CO (2–1) (12m) | 63 | 0.97 | 2061 | – | – |
| 12CO (2–1) (30m) | 40 | 0.62 | 1640 | – | – |
| C18O (2–1) (30m) | 18 | 0.28 | 360 | 62 | |
| 12CO (1–0) (OVRO) | 14 | 0.24 | – | – | – |
| 850 m (SCUBA) | 8.6 | 0.13 | – | 155 | |
| 3 mm (OVRO) | 5.8 | 0.09 | – | 53 |
| D | |||||
| (′′) | (pc) | () | () | (cm-3) | |
| 12CO (2–1) (12m) | 51 | 0.59 | 1330 | – | – |
| 12CO (2–1) (30m) | 30 | 0.35 | 780 | – | – |
| C18O (2–1) (30m) | 25 | 0.29 | 250 | 95 | |
| (1–0) (30m) | 15 | 0.17 | 68 | 120 | |
| 12CO (1–0) (OVRO) | 14 | 0.16 | – | – | – |
| 850 m (SCUBA) | 11 | 0.13 | – | 128 | 8.2 |
| 3 mm (OVRO) | 3.34 | 0.04 | – | 38 | 7.6 |
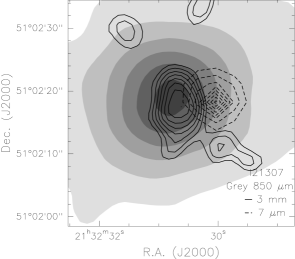
In Fig. 7, the 850 m map observed with SCUBA towards I21307 is superimposed on the 3 mm and the 7 m emission observed with OVRO and ISOCAM, respectively. The angular resolution of both the ISOCAM and OVRO maps is ′′, identical to that of the 12CO (1–0) observations (Table 2). The intensity profile of the SCUBA map indicates the presence of an unresolved central core, and a halo extending over ′′. Such a halo is not detected in the line maps presented in Sect. 3.1. However, it is well known that the optically thin emission of dust and the molecular line intensities do not depend on temperature and column density in the same manner. Furthermore, chemistry and optical depth effects can affect the line emission and cause a different shape of the maps.
The OVRO map indicates the presence of a compact core, whose diameter is pc, located near the emission peak of the 850 m map. One sees that the emission peak of the ISOCAM map is offset by ′′ in R.A. from the the 3 mm and the 850 m emission peaks. This is confirmed by the 15 m ISOCAM map, whose emission peak is nearly coincident with that detected at 7 m. Therefore, the ISOCAM maps may suggest that in I21307 the bulk of the MIR emission does not arise from the millimeter core. However, we point out that these maps have to be regarded with caution because the astrometric uncertainty may be as large as ′′ (see Cesarsky & Blommaert cesarsky (2000)), and maps with better astrometric precision and angular resolution are required to assess the origin of the mid-infrared emission.
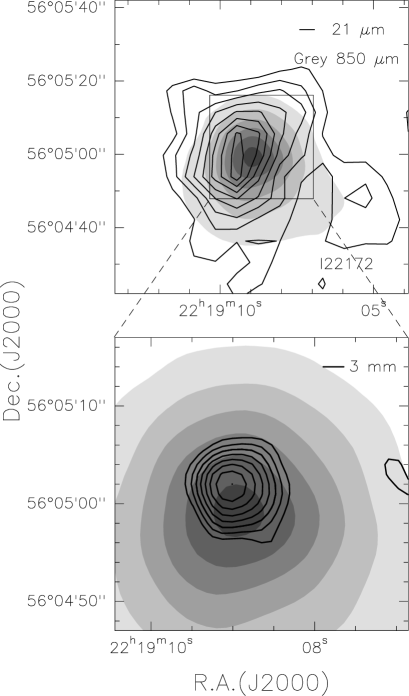
The top panel of Fig. 8 shows the SCUBA map observed towards I22172. In this case, to make a comparison with the MIR emission, we have superimposed the MSX222 MSX images have been taken from the on-line MSX database http://www.ipac.caltech.edu/ipac/msx/msx.html 21 m image, because no ISOCAM maps are available for this source. The bottom panel presents an enlargement of the central region with a contour plot of the 3 mm continuum observed with OVRO, which shows the presence of a compact millimeter core ( pc) approximately located at the center of the SCUBA map. Although the angular resolution of the MSX map is times worse than that of ISOCAM, we find that also in this case the peak of the MIR emission does not coincide with that at 850 m and 3 mm.
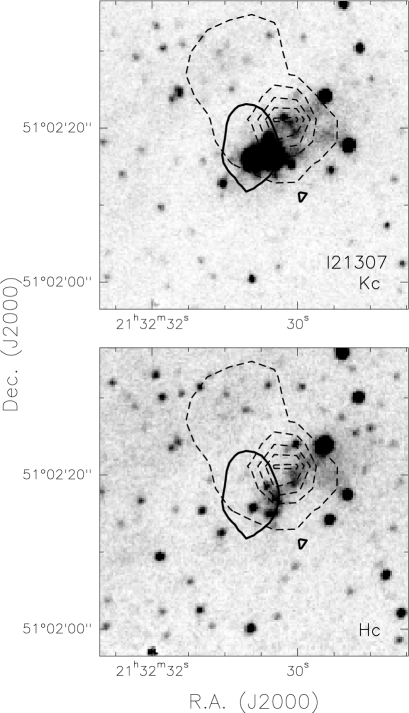
Near-infrared images of both sources are presented in Fig. 9 and 10, obtained at 2.2 m (Kc-band) and 1.7 m (Hc-band). In both maps, the half maximum power contour of the 3 mm core, and the MIR emission are also shown. The Kc-band image of I21307 (top panel of Fig. 9) shows a cluster of stars, the “centroid” of which is located at ′′ ( pc) in R.A. from the peak of the millimeter core. However, the brightest cluster member in Kc is ′′ South of the OVRO peak. The 15 m ISOCAM peak lies on the western side of the cluster. It seems probable to us that such emission is due to a combination of emission from the cluster members and small particle emission from the adjacent cloud.
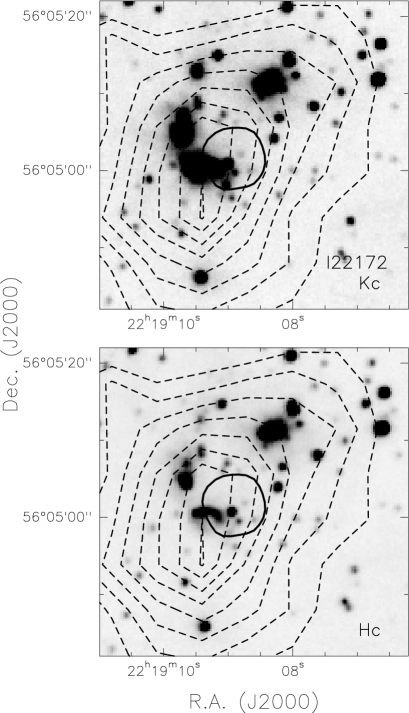
In I22172, the 3 mm core is nearly at the center of a cluster of NIR sources distributed as a patchy “ring”, detected both at 1.7 and 2.2 m (Fig. 10). In this case also the 21 m emission is roughly coincident with the position of the cluster.
It is interesting to notice that in both sources the stars detected in the near-infrared images are located close to the millimeter core, but have a distribution that does not exactly coincide with it: the “average position” of the reddest stars of the cluster is ′′ offset from the millimeter peak, i.e. well above the positional uncertainties on the maps, estimated to be ′′. This is reminescent of the observations of the candidate massive protostar IRAS 23385+6053 (Fontani et al. fonta2 (2004)), in which a compact massive core, believed to host a newly formed massive (proto)star, is surrounded by a cluster of more evolved B stars, distributed as a patchy ring around the core.
3.2.1 The NIR clusters
The near infrared broad band images of I21307 and I22172 clearly show a concentration of red star-like sources near the IRAS positions. This is consistent with the detection of young stellar objects closely associated with the molecular clumps. Following the methods described in Testi et al. (Tea97 (1997); Tea98 (1998)) we have verified the presence of a stellar surface density peak and we have estimated the richness indicator IC for both regions. The resulting values are I13 for I21307 and I9 for I22172.
In order to compare these numbers with other cluster surveys, it is necessary to give a rough estimate of the minimum stellar mass we are able to detect in our observations. Following Testi et al. (Tea98 (1998)), but using the Palla & Stahler (PS99 (1999)) pre-main sequence evolutionary tracks, we have computed the expected stellar mass sensitivity of our observations. Neglecting the effects of infrared excess and assuming an age of 0.1–1 Myr and an extinction AV=10 mag, we estimate that our observations should be sensitive to young stellar objects more massive than 0.5–1.5 M⊙. This is necessarily a rough estimate, and our observations are certainly not complete to these low masses.
3.3 SED and luminosities
It is clear that these regions are very complex and a proper modeling of the SED would require a detailed radiation transfer calculation, taking into account both the geometry of the core and cluster as well as the radiation field of each cluster member and the contribution of very small dust grains and PAHs. This approach would require a substantial number of assumptions and goes beyond the scope of this paper. Our aim here is to estimate the relative contribution to the SED of the two main components detected in each region: the NIR cluster and the cold molecular core. This simplified approach is described in the following.
Let us consider first I21307: the SED of this source was already derived by Molinari et al. (mol00 (2000)). With respect to their Fig. 3, Fig. 11 contains more data, namely MSX, IRAS, OVRO and VLA. On the basis of the observations presented in Sect. 3.2 we can distinguish between two components: the 3 mm core (hereafter I21307-C), and the emission of a stellar cluster, detected in the NIR images. The millimeter and sub-millimeter flux densities arise from the core I21307-C, while, as discussed in Sect. 3.2, the MIR data are likely due to the nearby cluster. Therefore in Fig. 11 we have performed two grey-body fits.
The solid line represents the best grey-body fit obtained using data representative of the emission arising from I21307-C, i.e. from millimeter to far-infrared wavelengths. Assuming a dust opacity index , which is a value typically found in envelopes of high-mass YSOs (Hunter 1997; Molinari et al. mol00 (2000)) the corresponding parameters are: dust temperature K, angular diameter ′′, and mass . This fit yields a luminosity of , which corresponds to the luminosity of a B1.5 ZAMS star. This luminosity has to be regarded as an upper limit to the “real” luminosity of the core I21307-C. This is because the IRAS flux densities at 100 and 60 m may arise both from the core and from the external cluster, because the IRAS beam is much larger than the core region. However, the goodness of the grey-body fit shown in Fig. 11 suggests that the 100 and 60 m flux densities are mainly due to I21307-C, and therefore the luminosity computed above is close to the “real” core luminosity.
The dotted line is a grey-body fit to the data at wavelengths m, and it represents the emission coming from the external cluster. The fit is obtained for a temperature of 150 K. By integrating the flux densities we obtain a luminosity of .
Let us now consider I22172: Fig. 12 shows the SED of this source. The images obtained at different wavelengths show that also in this case there is a molecular core (hereafter I22172-C), detected in the millimeter continuum and molecular lines maps, and a cluster of stars revealed in the near-infrared images. Therefore, as for I21307-C, we have performed a two grey-body fit to the SED. Using , from Fig. 12 we have derived the following best fit parameters: dust temperature K, angular diameter of the source ′′ and mass of . The resulting luminosity is . In this case also, this luminosity must be regarded as an upper limit for the luminosity of I22172-C, but, as discussed for I21307, the fact that the fit is reasonable suggests that the emission at 100 and 60 m arises mainly from the core, so that the real core luminosity is close to the value estimated before. The dotted line shows the grey-body fit to data with m, which represent the emission due to the cluster of stars surrounding the core. It has been obtained for a temperature of 140 K and a luminosity of .
The shape of both spectra is similar to that of the massive protostar candidate IRAS 23385+6053 (Fontani et al. fonta2 (2004)). In addition, as pointed out in Sect. 3.2, the source structures are also similar. This may suggest that the evolutionary stage of the sources is the same. We will come back to this point in Sect. 4.2.


3.4 Mass, density, and temperature estimates
Core masses have been derived in two different ways: from the continuum emission and from the lines. In the first case, assuming dust emission to be optically thin, we can compute the core mass directly from the observed flux density:
| (1) |
where is the flux density integrated over the area described by the level of the SCUBA map, is the distance, is the dust opacity parametrised as (in units of cm2 g-1), is the Planck function and is the dust temperature. We assume cm2 g-1 (Kramer et al. kramer (1998)), that implies a standard gas-to-dust ratio of 100. We have also deduced the core mass by means of the total column density derived from some of the lines observed, according to the expression:
| (2) |
where is the source diameter, the mass of the H2 molecule, the abundance of the molecule relative to H2, and is the source averaged column density. For the C18O molecule, following Wilson & Rood (wilson (1994)) we assumed that the oxygen isotope ratio 16O/18O depends on the galactocentric distance , according to the relationship ; using the galactocentric distances given in Table 1, and assuming a mean abundance of for the 12CO molecule, we infer a C18O mean abundance of . For the H13CO+ molecule, we applied a similar argument: the carbon isotope ratio, 13C/12C, depends on the galactocentric distance , according to the relationship ; thus, assuming a mean abundance of for the HCO+ molecule (Irvine et al. irvine (1987)), we derive a H13CO+ mean abundance of .
Furthermore, from the linewidth and the core linear diameter of each molecular line, we can estimate the virial mass: assuming the source to be spherical and homogeneous, neglecting contributions from magnetic field and surface pressure, the virial mass is given by:
| (3) |
The mass estimates deduced from Eqs. (1) and (2) are listed in Col. 5 of Tables 4 and 5, while the virial masses are shown in Col. 4. In Col. 6 we also give the mean volume density, , deduced from the corresponding mass and diameter. The values found clearly show that both cores are massive, and the masses needed for virial equilibrium are within a factor of from those computed from the continuum emission or from the lines. Hence the cores are likely virialised. Furthermore, increases towards the core center in both sources; the increment is roughly consistent with what is expected for a density profile of the type , which is the typical profile found in molecular clumps that surround high-mass YSOs (see e.g. Fontani et al. 2002, Beuther et al. 2002b ). As usual, the uncertainties on the mass estimates are mainly due to the molecular abundances, the assumed dust opacity and the gas-to-dust ratio, which are known to be affected by large errors and difficult to quantify.
One notices that the masses estimated from the flux densities at 850 m are larger than those derived from the C18O (2–1) line, although the source diameters are bigger in the C18O (2–1) line. This may be due to the fact that all diameters have been estimated from the FWHM of the emission, and in the 850 m maps a significant fraction of the total integrated emission arises from a halo of 40′′ in diameter, which is not detected in the line maps.
Finally, from the CH3C2H spectra observed towards I22172 (Fig. 3), we have derived the kinetic temperature and the total column density of this source by means of the rotational diagram method (see e.g. Fontani et al fonta (2002)). The fundamental assumption of this method is that the gas is in local thermodynamic equilibrium (LTE) conditions, which we believe to be valid for CH3C2H because of its low dipole moment. If we further assume the lines to be optically thin, one can derive the column density of the upper level of each transition from the integrated intensity of the line. We obtain the source kinetic temperature and column density listed in Cols. 1 and 2 of Table 6, respectively. We also list the virial mass (Col. 3), the gas mass (Col. 4) and the volume density (Col. 5), computed as explained before for the other molecular tracers. The diameter used to compute is that derived from the SCUBA map. We assumed an abundance of CH3C2H relative to H2 of . This is an average value taken from Fontani et al. (fonta (2002)) and Wang et al. (wang (1993)), who studied this molecule in massive star forming regions.
| (K) | (cm-2) | () | () | (cm-3) |
| 27 | 4 1013 | 73 | 92 | 1.0 105 |
3.5 The outflows
3.5.1 Integrated maps and morphology
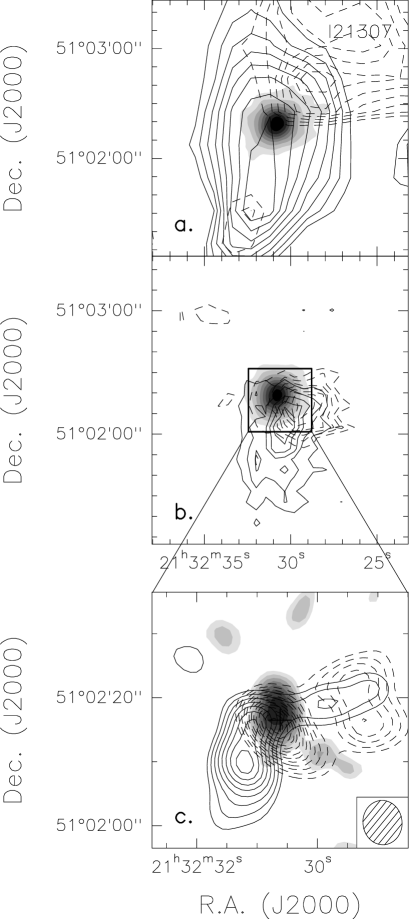
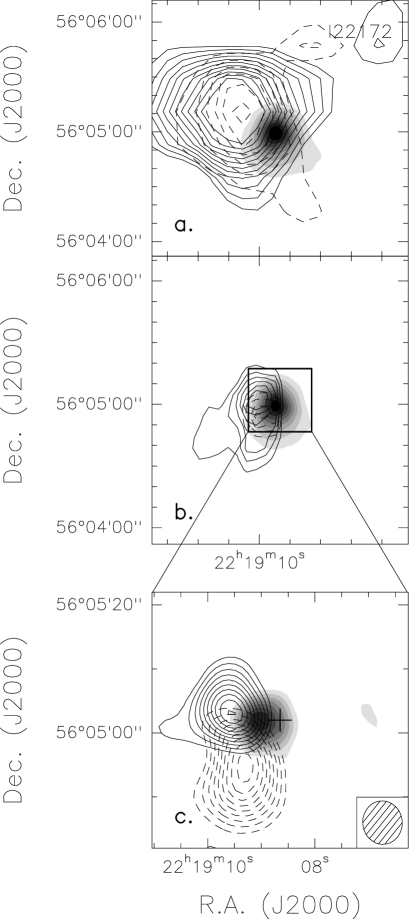
Figures 13 and 14 show the integrated intensity maps of the red and the blue wings of the 12CO (2–1) line. Panels a and b show the observations performed with the NRAO-12m telescope and the IRAM-30m telescope, respectively. Solid and dashed lines correspond to the integrated emission under the blue and the red wings, respectively. The velocity intervals are given in Table 3. These have been superimposed on the SCUBA map at 850 m, which indicates the position of the cores.
The outflow associated with I21307 is oriented approximately NW-SE, with the blue-shifted gas towards the SE, and the lobes appear to be well separated. In contrast, towards I22172 the lobes overlap completely. However, in both cases, the angular resolution is too poor to resolve the outflow structure. The interferometric observations obtained with OVRO in the 12CO (1–0) line give us better understanding of the structure of the flows: in panels c of Figs. 13 and 14, the outflow maps are shown. These have been obtained integrating the line emission over the same velocity intervals as in panels a and b.
Let us consider the two outflows separately. I21307 (Fig. 13c) presents an outflow oriented NW-SE, with the blue-shifted gas located to the SE. The lobe peaks are centered near the core position. The morphology is quite chaotic and the outflow seems to be made at least of two components: a stronger one centered on the core I21307-C, and a weaker one, offset by ′′ to the west. Various authors (e.g. Beuther et al. 2002a ) have demonstrated the presence of multiple outflows in massive star forming regions. Hence, such a complex morphology may be due to the fact that we are seeing the superimposition of several flows.
In I22172 (Fig. 14c), the outflow axis is clearly oriented N-S, with red-shifted gas to the south and blue-shifted gas to the north. The whole outflow has an extension of ′′, corresponding to pc at 2.4 kpc. In this case the lobes have similar sizes and there is little overlap between them. It is striking that the center of the lobes is offset by ′′ from the dust emission peak. This suggests that the source driving the outflow is not located at the center of the dust emission. The outflow might originate from a source belonging to the more evolved cluster, and not from the massive object embedded inside I22172-C; in fact, comparing the image at 1.7m (bottom panel of Fig. 10) with the panel c of Fig. 14, one notices that the center of the lobes roughly corresponds to one of the near-infrared sources. Thus, the molecular core might host a source in a very early evolutionary stage prior to the formation of an outflow. However, as we will briefly discuss in Sect. 3.5.2, the flow parameters indicate that the source driving the outflow must be massive. Therefore, wherever the source driving the outflow is located, it must be a massive young object. Since the stars of the cluster are probably low- to intermediate-mass stars, it is unlikely that the flow originates in one of the cluster members.
We can compare our OVRO maps with those presented in Molinari et al. (mol02 (2002)), who used the HCO+ (1–0) line to observe the outflows in both sources. They adopted velocity intervals slightly different from ours. After integrating the 12CO (1–0) lines in the same intervals, one sees that our maps are consistent with those of Molinari et al. (mol02 (2002)) for I21307, but not for I22172. This might be explained by the fact that Molinari et al. (mol02 (2002)) observed only the inner part of the region observed by us using a more compact configuration of the interferometer, sensitive to more extended structures.
3.5.2 Physical parameters
The characteristics of the flows are listed in Table 7, in which the source and the tracer used are given in Col. 1 and 3, respectively. The derived physical properties have been computed using the same relations given in Beuther et al.2002a : the mean column densities of the blue- and the red- lobes, and , are given in Col. 4 and 5, the mass of the blue- and the red- lobes and , and the total mass, , in Col. 6, 7 and 8, respectively, the momentum in Col. 9, the energy in Col. 10, the size in Col. 11, the dynamical timescale in Col. 12, the mass entrainment rate in Col. 13, the mechanical force in Col. 14 and the mechanical luminosity in Col. 15. All values have been derived assuming the mean inclination angle of (Cabrit & Bertout cabrit2 (1992)) with respect to the line of sight.
To determine the size , we have adopted the maximum extension from the center of the lobes (Cabrit & Bertout cabrit2 (1992)). Since in I21307 the lobes have different extensions, we have adopted their arithmetic mean.
| Source | tracer | ||||||||||||
|---|---|---|---|---|---|---|---|---|---|---|---|---|---|
| I21307 | 12CO (1–0) (OVRO) | 33.8 | 17.9 | 2.3 | 0.8 | 3.2 | 48.3 | 3.7 | 0.1 | 1.3 | 4.5 | 2.9 | 10.5 |
| 12CO (2–1) (30m) | 0.8 | 0.7 | 5.2 | 3.0 | 8.2 | 127.8 | 20.0 | 0.7 | 4.3 | 1.9 | 2.9 | 6.8 | |
| 12CO (2–1)(12m) | 0.5 | 0.4 | 15.8 | 4.2 | 20.0 | 311.0 | 48.3 | 1.0 | 5.7 | 3.4 | 5.5 | 13.1 | |
| I22172 | 12CO (1–0) (OVRO) | 52.4 | 39.1 | 1.1 | 1.6 | 2.7 | 55.6 | 12.4 | 0.1 | 0.7 | 7.6 | 12.2 | 14.2 |
| 12CO (2–1) (30m) | 1.2 | 1.6 | 5.0 | 3.4 | 8.4 | 153.5 | 31.0 | 0.4 | 1.7 | 4.7 | 9.0 | 27.3 | |
| 12CO (2–1)(12m) | 1.0 | 1.1 | 12.8 | 10.1 | 22.9 | 428.7 | 89.3 | 0.6 | 2.9 | 7.8 | 14.8 | 79.3 |
The velocity intervals chosen for the line wings are the same used for the OVRO 12CO (1–0) spectra (see Table 3).
The 12CO (2–1) and (1–0) lines may have large opacities also in the wings. Hence, we should take into account this effect in computing the column density. For the 12CO (2–1) line we have followed the method outlined in Beuther et al. (2002a ): one can assume a mean value for the 13CO/12CO (2–1) line wing ratio of (Choi et al. choi (1993)), and that this ratio is constant throughout the outflow (Cabrit & Bertout cabrit (1986)). Even though we have not made maps of the 13CO (2–1) line, we can verify if this assumption holds for our sources using the data of Brand et al. (brand (2001)): they observed the 13CO (2–1) line towards I21307, and by comparing their spectra with ours in the 12CO (2–1) line, we conclude that a mean ratio of 0.1 is plausible for the wings. Under this assumption, the column densities of the wings, and , have been computed using the relation (see Beuther et al. 2002a ):
| (4) | |||||
We have assumed and K as in Beuther et al. (2002a ), to make a consistent comparison. For this reason the correction for the galactocentric distance has not been applied. However, such a correction would not affect any of the conclusions drawn by us and Beuther et al..
For the 12CO (1–0) line, we have estimated the optical depth in the wings as follows: from the mean line wing ratio 13CO/12CO (2–1), and a relative mean abundance , we derive an optical depth of the 12CO (2–1) line in the wings of . One can demonstrate that, in LTE conditions, for a kinetic temperature of 30 K, the optical depth of the (2–1) line is 3 times that of the (1–0) line. Hence, we adopted a mean value for the 12CO (1–0) line to compute the column density in the wings, and corrected the column density estimates accordingly.
The parameters deduced from the 12CO (1–0) line are in good agreement with those previously found by Molinari et al. (mol02 (2002)), who observed the HCO+ (1–0) line towards both sources with similar angular resolution, as mentioned in Sect. 3.5.1. The outflow masses, the mechanical forces and the mechanical luminosities are at least an order of magnitude greater than those typically associated with low-mass YSOs (see e.g. Bontemps et al. bontemps (1996)), and in good agreement with those found by Beuther et al. (2002a ) in a sample of massive YSOs, believed to be precursors of UC Hii regions. A detailed comparison between our results and those found by other authors (both in low-mass and high-mass star forming regions) will be done in Sect. 4.1.
3.5.3 Near-Infrared H2 and [FeII] images.
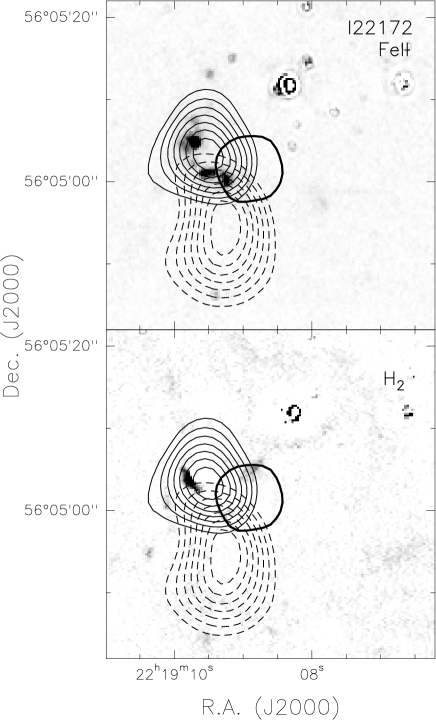
Fig. 15 presents the image of I22172 in the H2 and [FeII] lines. They have been superimposed on the outflow image derived from the 12CO (1–0) line. Also indicated in Fig. 15 is the position of the core I22172-C. The [FeII] emission is in the center of the blue lobe of the outflow, and it is oriented approximately NE-SW. The H2 emission has roughly the same inclination, and it seems to follow the boundary of the [FeII] emission. Hence, we conclude that both these tracers are associated with the 12CO flow seen with OVRO.
It is well known that NIR lines of H2 and [FeII] are tracers of the hotter and faster component of a flow in low-mass YSOs (e.g. Nisini et al. nisini (2001)). In particular, [FeII] is thought to be a tracer of the inner region of the jet, while the H2 emission is likely due to the shocked gas on the surface between the jet and the ambient material. From Fig. 15 one can see that our observations are consistent with this picture: the H2 and [FeII] emission both arises from the inner parts of the outflow lobes.
No H2 or [FeII] line emission was detected in I21307.
4 Discussion
In order to understand the nature of IRAS 21307+5049 and IRAS 22172+5549, in the following we will discuss the results obtained in Sect. 3.
4.1 Comparison with outflows associated with other YSOs
In Fig. 16, we plot the mechanical force, , of the outflows against the bolometric luminosities of the sources. Our data are compared to those derived by Bontemps et al. (bontemps (1996)), who studied outflows associated with low-mass objects, and those of Beuther et al. (2002a ), who analysed massive molecular outflows. We also compare our results to those obtained by Molinari et al. (1998b ) and Fontani et al. (fonta2 (2004)) for IRAS 23385+6053, a candidate massive protostar. Figure 16 is similar to Fig. 4b of Beuther et al. (2002a ); however, unlike these authors, we consider only sources without ambiguity between the near and the far kinematical distance. Also the values computed by Beuther et al. (2002a ) have been corrected for the mean inclination angle of : this allow us to make a consistent comparison.

Beuther et al. (2002a ) have shown that there is a correlation between the mechanical force and the luminosity of the core driving the outflow. They suggest that a similar relation, established for low-mass objects (Bontemps et al. bontemps (1996)), holds up to the high-mass regime. Our results and those obtained by Fontani et al. (fonta2 (2004)) for IRAS 23385+6053 appear to confirm this statement. In particular, I21307 and I22172 have bolometric luminosities close to those of early B stars.
Finally, we have computed the dynamical timescale of the outflows. These values represent a lower limit to the outflow age (see e.g. Parker parker (1991)). For I21307 and I22172, we have found (see Table 7) that is of the order of yr. Beuther et al. (2002a ) found values ranging from to yr. These values are again in good agreement with our estimates.
4.1.1 Mass accretion rates and accretion efficiencies
From the mass entrainment rate, we can derive the mass accretion rate, , and the accretion efficiency, . For both, we will adopt the same argument outlined by Beuther et al. (2002a ).
Based on the assumptions that the source driving the outflow is a single star, the momentum of the outflow is equal to that of the internal jet and that the ratio between mass loss rate of the jet and mass accretion rate is (Tomisaka tomi (1998); Shu et al. shu99 (1999)), we obtain accretion rates of order (see Table 8). Such values are slightly higher than those derived by Beuther et al. (2002a ) in sources with comparable luminosities (from to ), but still consistent within the uncertainties.
From the accretion rate we estimate the accretion efficiency, :
| (5) |
Using , , and the values of computed from the 850 m map, we derive and for I21307 and I22172, respectively (see Table 8).
can also be determined following the argument outlined in Richer et al. (richer (2000)). They consider two approaches:
-
(a)
the luminosity is accretion dominated:
(6) -
(b)
the luminosity is mainly due to ZAMS stars: 2002a ):
(7)
where is the stellar escape velocity, assumed equal to the jet velocity, and and are the stellar mass and radius for a ZAMS star with bolometric luminosity . The luminosities used are those derived in Sect. 3.3. and have been calculated as explained in Sect. 3.5.2.
| source | tracer | (*) | (a) | (b) | |
|---|---|---|---|---|---|
| () | |||||
| I21307 | 12CO (1–0) | 0.8 | 0.04 | 0.01 | 0.4 |
| 12CO (2–1) (30-m) | 0.6 | 0.03 | 0.01 | 0.2 | |
| 12CO (2–1) (12-m) | 0.4 | 0.02 | 0.02 | 0.2 | |
| I22172 | 12CO (1–0) | 1.3 | 0.07 | 0.003 | 0.3 |
| 12CO (2–1) (30-m) | 1.4 | 0.08 | 0.003 | 0.1 | |
| 12CO (2–1) (12-m) | 0.8 | 0.05 | 0.006 | 0.09 | |
| IRAS 23385+6053 (♣) | HCO+ (1–0) | 1.5 | 0.006 | 0.01 | 0.1 |
| Beuther et al. (♠) | 12CO (2–1) (30-m) | 0.3 | 0.02 | 0.08 | 0.2 |
4.2 Nature of the sources

We stress that the quantities previously obtained have been derived under several hypotheses, the most important being the assumed jet velocity and the efficiency of the ejection mechanism (i.e. the ratio between mass loss rate and accretion rate, assumed to be 0.3), which are both very uncertain. Hence, the values listed in Table 8 have to be taken with caution. Neverthless, the results presented in Sects. 4.1 and 4.1.1 indicate that I21307 and I22172 have physical parameters comparable to those obtained by Beuther et al. (2002a ) in sources with similar luminosities, and hence likely in similar evolutionary stages.
In Fig. 17 we plot estimated using Eq. (5), (6) and (7) for I21307, I22172 and IRAS 23385+6053 (big symbols), and for the sources of the Beuther et al. sample with comparable luminosity (small symbols). Although the spread of the values is about an order of magnitude for the three estimates of , one can notice that the values derived from Eq. (5) are more consistent with those computed from Eq. (6), i.e. under the assumption of accretion dominated luminosity, than with those estimated in the case of luminosity dominated by a ZAMS star. This result favours the conclusion that our sources, as well as those of Beuther et al., are likely massive protostars still in the accretion phase.
4.2.1 Comparison with the massive protostar candidate IRAS 23385+6053
In Sects. 3.2 and 3.3 we have shown that the continuum maps indicate the presence of two “sub-regions” in both I21307 and I22172: a massive compact core (called I21307-C and I22172-C) and a cluster of stars which surround the core. From the maps and the SEDs, we concluded that the core is responsible for the continuum emission at wavelengths longer than m, while the emission at shorter wavelengths is mainly due to the cluster. Grey-body fits to the SEDs indicate that the cores have luminosities of , an order of magnitude greater than those of the clusters.
The structure of both objects is similar to that of IRAS 23385+6053. This source, which has a bolometric luminosity of , has been proposed by Molinari et al. (1998b ) and Fontani et al. (fonta2 (2004)) as the best example of a candidate massive protostar. As in I21307 and I22172, we can distinguish two components: a compact core detected at millimeter and sub-millimeter wavelengths and a cluster of stars which lie around the core, detected at near- and mid-infrared wavelengths. Other important similarities between IRAS 23385+6053, I21307 and I22172 are the lack of free-free emission towards the core and the presence of a compact outflow driven by a source embedded in the core.
Given the strong similarities between I21307, I22172 and IRAS 23385+6053, it seems plausible that also the nature of the embedded YSOs is approximately the same. Molinari et al. (1998b ) propose two possible scenarios for IRAS 23385+6053, that the object which lies inside the core is a B0 ZAMS star, and the Hii region is not detectable because it is very compact and optically thick; another possibility is that there is no Hii region because the central object is still in the proto-stellar phase. In both scenarios, the embedded source is young and massive, while the stars of the surrounding cluster are more evolved. These scenarios are plausible also for I21307 and I22172. In the first hypothesis, the objects embedded inside I21307-C and I22172-C are B1-B2 ZAMS stars; in the second, they are intermediate-mass protostars, and the luminosity observed is due to accretion. Behrend & Maeder (behrend (2001)) computed evolutionary tracks for protostars from 1 to 85 : in their models the luminosities of our sources correspond to protostellar masses of . However, this value must be regarded with caution, because the authors assume the relation found by Churchwell (church2 (1998)) between and , which in the high-mass regime does not provide a good fit to the data.
As discussed in Sect. 4.2, the protostellar hypothesis seems to be more likely. However, to confirm this conclusion further interferometric observations are needed. In particular, it would be important to measure the temperature of the cores with great accuracy. In fact, newly formed massive stars lie inside “hot cores”, namely compact molecular regions with kinetic temperature higher than K (Kurtz et al. kurtz (2000)). Hence, as discussed by Fontani et al. (fonta2 (2004)), measuring the core temperature would be an important step to improve our understanding of their evolutionary stage.
4.3 The formation of ”Clusterinos”
As we have discussed in the previous sections, it is very likely that the outflows, the bulk of the bolometric luminosity and other properties of the regions are dominated by the most massive forming star. Nevertheless, our infrared images reveal that small young stellar aggregates are also found in the same regions (see also Molinari et al. 1998b and Fontani et al. 2004). It is interesting to explore the idea that, along with the 5–8 M⊙ protostar, a small stellar cluster is forming within the molecular clump, a “clusterino” similar to those found around the more evolved early type Herbig Be stars (see e.g. Testi et al. Tea99 (1999)). The values of the clusterinos richness indicators that we derived in Sect. 3.2.1 are relatively low if compared with the values for Herbig Be clusters. This is not unexpected, as our observations are not as sensitive (in terms of the least massive objects detectable) as those of Testi et al. (Tea98 (1998)), this is mainly due to the larger distance of our sources compared with the sample of Herbig Be stars. An additional reason could be that our objects are generally younger and more extincted, and, finally, it is possible that the clusterinos have not been completely assembled yet.
From the photometric data alone, it is difficult to estimate the membership of individual objects (see also the discussion in the Testi et al. papers on Herbig Ae/Be clusterinos). Assuming that all the sources within 30′′ from the IRAS nominal position are cluster members and all the other sources in the field are not related to the clusterinos, it is possible to derive an estimate of the most luminous (already formed) star and the integrated near infrared emission for each clusterino. The result of this exercise shows that the most massive star in the I21307 region is consistent with a moderately reddened (Amag) B6 ZAMS, while in I22172 the brightest near infrared star close to the IRAS position could be a more embedded (Amag) B1.5 ZAMS. The integrated near infrared fluxes at 2.2 m are 5 mJy and 90 mJy for I21307 and I22172, respectively. These numbers show that the already formed members of the clusterinos contribute only to a minimal fraction of the emission from the region in the case of I21307, while in I22172 a substantial fraction of the total luminosity could be ascribed to the most massive member.
It is important to point out that these estimates of the most massive member of the clusterinos and their integrated emission at near infrared wavelengths have been made assuming that all objects close to the IRAS source are bona fide members. Clearly this is a simplifying assumption: it is likely that an important contribution from foreground and background objects is affecting our estimates. The comparison of the richness indicator values and the number of objects close to the IRAS source shows that this contamination could be as high as 50%. Unfortunately, with our data alone, it is not possible to pin point the contaminating objects, hence our estimates should be regarded as upper limits (both for the luminosity of the most massive star and the integrated flux of the clusterinos).
5 Summary and conclusions
We have observed two massive proto-stellar candidates, IRAS 21307+5049 and IRAS 22172+5549, in the 12CO (1–0) and (2–1), C18O (2–1), H13CO+ (1–0), CH3C2H (6–5), (8–7) and (13–12) molecular lines, and in the continuum at various wavelengths from the near-infrared to the millimetric range. The following results have been obtained:
-
•
Maps of the 3 mm continuum observed with the OVRO interferometer reveal in both sources the presence of a compact, massive core, whose linear diameter and mass are pc and for I21307, and pc and for I22172;
-
•
Near-infrared images at 1.7 and 2.2 m indicate that clusters of more evolved stars surround both cores. The continuum maps and the SEDs suggest that for both sources the core is mainly responsible for the emission at wavelengths longer than m, while the emission at shorter wavelengths is due to the surrounding cluster. The SEDs indicate that the core luminosity is a few for both sources.
-
•
By mapping the 12CO (1–0) and (2–1) line wings, we find outflows associated with both sources that are driven by YSOs embedded in the cores. Outflows have masses of a few to a few tens of , dynamical timescales of yr and mass loss rates of a few times . Images of the H2 and [FeII] lines at near-infrared wavelengths suggest the presence of an ionized jet in the inner part of the outflow associated with I22172.
-
•
The flows physical parameters of both sources are consistent with those of a sample of massive protostar candidates (Beuther et al. 2002a ) with comparable luminosity. The values of the accretion efficiencies, of , are consistent with values derived assuming that in these sources the luminosity is accretion-dominated.
-
•
Based on the similarity between our sources and the massive protostar candidate IRAS 23395+6053, we believe that the massive YSOs embedded inside the cores are protostars accreting material from the environment, the masses of which at present are , assuming that the luminosity observed is due to accretion onto the forming star.
-
•
Near-infrared images suggest that, together with the massive protostar, a small stellar cluster (“clusterino”) is forming inside the molecular clump, similar to those found around Herbig Be stars. Assuming that the sources within 30′′ from the IRAS position are all bona fide members of the clusterino, we have derived that the already formed stars of the clusterino contribute only to a small fraction to the total observed luminosity in I21307, while in I22172 a significative fraction of the total luminosity could be due to the most massive members.
Acknowledgements.
We thank Hans Ungerechts for his precious help with the IRAM-30m observations, and Henrik Beuther for stimulating disussions. This publication makes use of data products from the Two Micron All Sky Survey, which is a joint project of the University of Massachusetts and the Infrared Processing and Analysis Center/California Institute of Technology, funded by the National Aeronautics and Space Administration and the National Science Foundation. The OVRO mm array is supported by NSF grant AST-99-81546, research on young stars and disks is also supported by the Norris Planetary Origins Project and NASA Origins of Solar Systems program (grant NAG5–9530). This paper is partly based on observations made with the Italian Telescopio Nazionale Galileo (TNG) operated on the island of La Palma by the Centro Galileo Galilei of the INAF (Istituto Nazionale di Astrofisica) at the Spanish Observatorio del Roque de los Muchachos of the Instituto de Astrofisica de Canarias. The NICS/TNG observations were performed in service mode by the TNG staff, we especially acknowledge the help of Antonio Magazzù. We also thank Marina Cecere for help with the Palomar observations and data reduction.References
- (1) Baffa C., Comoretto G., Gennari S., et al. 2001, A&A, 378, 722
- (2) Behrend, R., & Maeder, A. 2001, A&A, 373, 190
- (3) Beuther, H., Schilke, P., Sridharan, T.K., Menten, K.M., Walmsley, C.M., Wyrowski, F. 2002a, A&A, 383, 892
- (4) Beuther, H., Schilke, P., Menten, K.M., Motte, F., Sridharan, T.K., Wyrowski, F. 2002b, ApJ, 566, 945
- (5) Bonnell, I.A., Bate, M.R., Zinnecker, H. 1998, MNRAS, 298, 93
- (6) Bontemps, S., Andre, P., Terebey, S., Cabrit, S. 1996, A&A, 311, 858
- (7) Brand, J., Cesaroni, R., Palla, F., Molinari, S. 2001, A&A, 370, 230
- (8) Cabrit, S. & Bertout, C. 1986, ApJ, 307, 313
- (9) Cabrit, S. & Bertout, C. 1990, ApJ, 348, 530
- (10) Cabrit, S. & Bertout, C. 1992, A&A, 261, 276
- (11) Cesarsky, D. & Blommaert, J. 2000, ISOCAM Calibration Accuracies Document, http://www.iso.vilspa.esa.es/users/expllib/CAMtop.html
- (12) Choi, M., Evans, N.J. II, Jaffe, D.T. 1993, ApJ, 417, 624
- (13) Churchwell, E. 1998, in The Origins of Stars and Planetary Systems, ed. C.J. Lada, & N.D. Kylafis, NATO Science Series, 540 (Kluwer), 515
- (14) Churchwell, E. 2000, in The Origins of Stars and Planetary Systems, ed. C.J. Lada, & N.D. Kylafis (Kluwer Academic Press)
- (15) Fontani, F., Cesaroni, R., Caselli, P., Olmi, L. 2002, A&A, 389, 603
- (16) Fontani, F., Cesaroni, R., Testi, L., Walmsley, C.M., Molinari, S. et al. 2004, A&A, 414, 299
- (17) Ghinassi F., Licandro J., Oliva E., et al. 2002, A&A 386, 1157
- (18) Holland, W.S., Cunningham, C.R., Gear, W.K., Jenness, T., Laidlaw, K. et al. 1998, SPIE, 3357, 305
- (19) Hunt L.K., Mannucci F., Testi L., Migliorini S., Stanga R.M., et al. 1998, AJ 115, 2594
- (20) Hunter, T. 1997, Ph.D. Thesis, Caltech
- (21) Irvine, W.M., Goldsmith, P.F., Hjalmarson, A. 1987, Chemical abundances in molecular clouds, in Interstellar Processes, ed. D. J. Hollenbach, & H. A. Thronson (Reidel, Dordrecht), 561
- (22) Kramer, C., Alves, J., Lada, C. et al. 1998, A&A, 329, L33
- (23) Kurtz, S., Cesaroni, R., Churchwell, E., Hofner, P., Walmsley, C.M. 2000, Protostars and Planets IV, 299
- (24) Kutner, M.L. & Ulich, B.L. 1981, ApJ, 250, 341
- (25) Molinari S., Brand J., Cesaroni R., Palla F. 1996, A&A, 308, 573
- (26) Molinari S., Brand J., Cesaroni R., Palla F., Palumbo G.G.C. 1998a, A&A, 336, 339
- (27) Molinari, S., Testi, L., Brand, J., Cesaroni, R., Palla, F. 1998b, ApJ 505, L39
- (28) Molinari, S., Brand, J., Cesaroni, R., Palla, F. 2000, A&A, 355, 617
- (29) Molinari, S., Testi, L., Rodriguez, L.F., Zhang, Q. 2002, ApJ, 570, 758
- (30) Murphy D.C., Persson S.E., Pahre M.A., Sivaramakrishnan A., Djorgovski S.G. 1995, PASP 107, 1234
- (31) Nisini, B., Massi, F., Vitali, F., Giannini, T., Lorenzetti, D. et al. 2001, A&A, 376, 553
- (32) Norberg, P. & Maeder, A. 2000, A&A, 359, 1025
- (33) Palla F. & Stahler S. 1999, ApJ, 525, 772
- (34) Parker, N.D., Padman, R., Scott, P.F. 1991, MNRAS, 252 442
- (35) Persson S.E., Murphy D.C., Krzeminski W., Roth M., Rieke M.J. 1998, AJ 116, 2475
- (36) Payne, J.M & Jewell, P.R. 1995, in ASP Conf. Ser.75, Multi-Feed Systems for Radio Telescopes, ed. D. T. Emerson & J. M. Payne (San Francisco: ASP), 144
- (37) Richer, J., Shepherd, D., Cabrit, S., Bachiller, R., Churchwell, E. 2000, in Protostars and Planets IV, ed. V. Mannings
- (38) Scoville N.Z., Carlstrom J.E., Chandler C.J., Phillips J.A., Scott S.L., Tilanus R.P.J., & Wang Z. 1993, PASP 105, 1482
- (39) Shepherd, D. & Churchwell, E. 1996, ApJ, 472, 225
- (40) Shepherd, D.S., Yu, K.C., Bally, J., Testi, L. 2000, ApJ, 535, 833
- (41) Shu, F.H., Adams, F.C., Lizano, S. 1987, ARA&A, 25, 23
- (42) Shu, F.H., Allen, A., Shang, H. et al. 1999, in The Origins of Stars and Planetary Systems, ed. C.J. Lada, & N.D. Kylafis (Kluwer Academic Press)
- (43) Stahler, S., Ho, P.T.P, Palla, F. 2000, Protostars and Planets IV, eds. S. Mannings, A. Boss and S. Russel, p.372
- (44) Testi L., Palla F., Prusti T., Natta A., Maltagliati S. 1997, A&A, 320, 159
- (45) Testi L., Palla F., Natta A. 1998, A&AS, 133, 81
- (46) Testi L., Palla F., Natta A. 1999, A&A, 342, 515
- (47) Tomisaka, K. 1998, ApJ, 502, L163
- (48) Townes, C.H. & Schawlow, A.L. 1975, Microwave Spectroscopy (Dover, New York)
- (49) Wang, T.Y., Wouterloot, J.G.A., Wilson, T.L. 1993, A&A, 277, 205
- (50) Wilson, T. L., Rood, R. 1994, ARA&A, 32, 191
- (51) Zhang, Q., Hunter, T.R., Brand, J., Sridharan, T.K., Molinari, S. et al. 2001 ApJ, 552, L167